| Param | Original file | Final file |
|---|---|---|
| Filename | modeM0/AS1T03_286T01_9000004268_29606cztM0_level2.evt | modeM0/AS1T03_286T01_9000004268_29606cztM0_level2_quad_clean.evt |
| Size (bytes) | 554,486,400 | 109,851,840 |
| Size | 528.8 MB | 104.8 MB |
| Events in quadrant A | 3,649,712 | 702,052 |
| Events in quadrant B | 3,730,566 | 718,000 |
| Events in quadrant C | 3,869,619 | 685,151 |
| Events in quadrant D | 5,003,603 | 669,477 |
| Mode SS | |||
|---|---|---|---|
| Quadrant | BADHDUFLAG | Total packets | Discarded packets |
| A | 0 | 158 | 0 |
| B | 0 | 158 | 0 |
| C | 0 | 158 | 0 |
| D | 0 | 158 | 0 |
| Mode M0 | |||
|---|---|---|---|
| Quadrant | BADHDUFLAG | Total packets | Discarded packets |
| A | 0 | 16277 | 0 |
| B | 0 | 16381 | 0 |
| C | 0 | 16698 | 0 |
| D | 0 | 19922 | 0 |
| Quadrant | Total seconds | Saturated seconds | Saturation percentage |
|---|---|---|---|
| A | 7940 | 216 | 2.720403% |
| B | 7940 | 252 | 3.173804% |
| C | 7940 | 401 | 5.050378% |
| D | 7941 | 344 | 4.331948% |
Noise dominated data is calculated using 1-second bins in cleaned event files. If a bin has >2000 counts, and if more than 50% of those come from <1% of pixels, then it is considered to be noise-dominated and hence unusable.
| Quadrant | # 1 sec bins | Bins with >0 counts | Bins with >2000 counts | High rate bins dominated by noise | Noise dominated (total time) | Noise dominated (detector-on time) | Marked lightcurve |
|---|---|---|---|---|---|---|---|
| A | 7940 | 7940 | 0 | 0 | 0.00% | 0.00% | 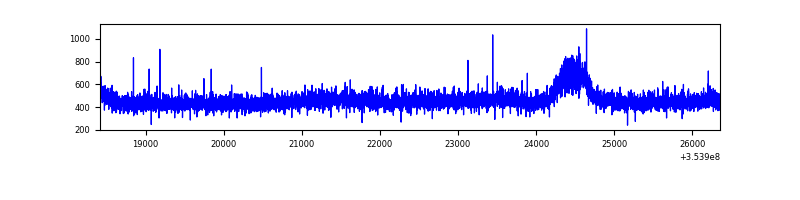 |
| B | 7940 | 7940 | 5 | 5 | 0.06% | 0.06% | 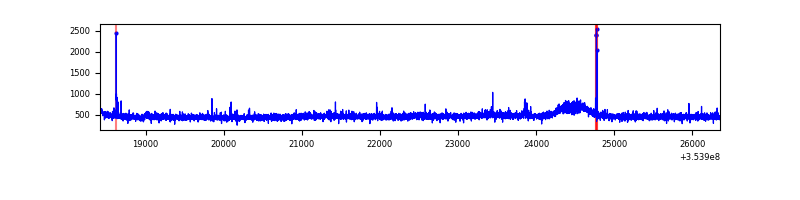 |
| C | 7940 | 7940 | 1 | 1 | 0.01% | 0.01% | 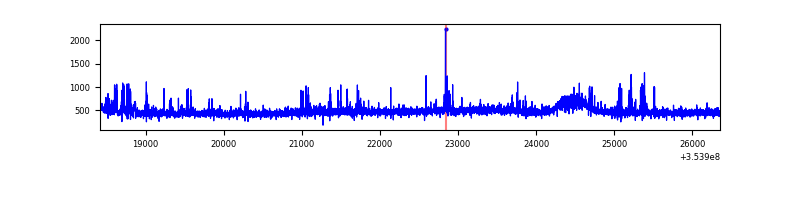 |
| D | 7941 | 7941 | 190 | 190 | 2.39% | 2.39% | 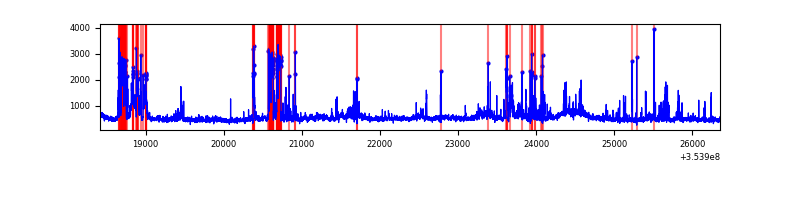 |
Top three noisy pixels from each quadrant. If the there are fewer than three noisy pixels in the level2.evt file, extra rows are filled as -1
| Pixel properties | Quadrant properties | ||||||
|---|---|---|---|---|---|---|---|
| Quadrant | DetID | PixID | Counts | Sigma | Mean | Median | Sigma |
| A | 13 | 254 | 13174 | 64.07 | 943 | 922 | 191.2 |
| A | 3 | 137 | 9872 | 46.8 | 943 | 922 | 191.2 |
| A | 1 | 113 | 8305 | 38.61 | 943 | 922 | 191.2 |
| B | 0 | 230 | 37534 | 202.9 | 939 | 913 | 180.5 |
| B | 12 | 111 | 22936 | 122.02 | 939 | 913 | 180.5 |
| B | 11 | 111 | 20942 | 110.97 | 939 | 913 | 180.5 |
| C | 14 | 238 | 211373 | 999.81 | 899 | 901 | 210.5 |
| C | 14 | 254 | 91489 | 430.32 | 899 | 901 | 210.5 |
| C | 10 | 22 | 18293 | 82.62 | 899 | 901 | 210.5 |
| D | 7 | 238 | 780390 | 3638.55 | 900 | 875 | 214.2 |
| D | 8 | 195 | 370348 | 1724.59 | 900 | 875 | 214.2 |
| D | 7 | 80 | 200428 | 931.46 | 900 | 875 | 214.2 |
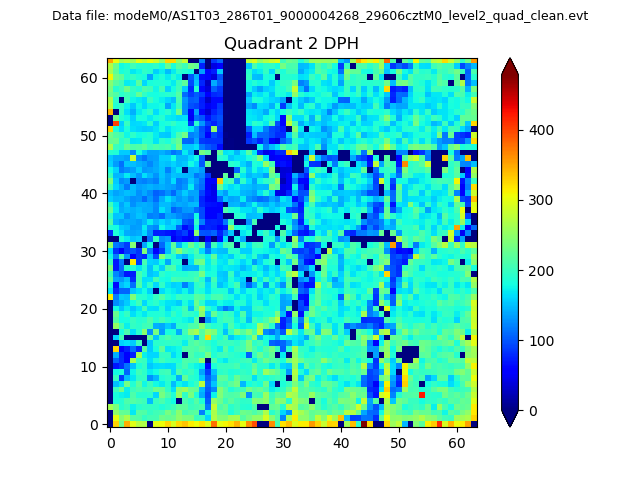
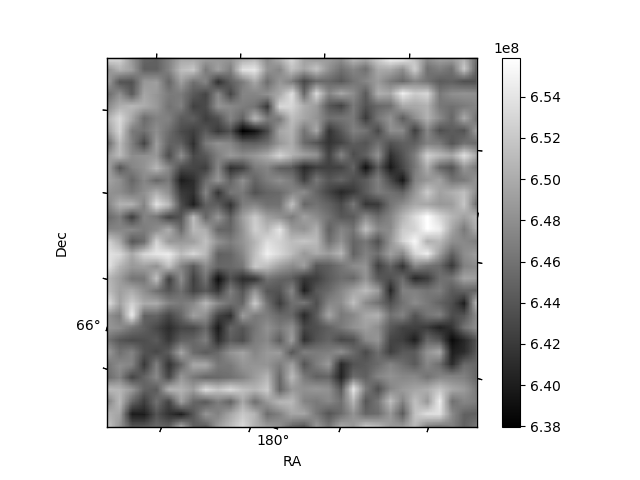
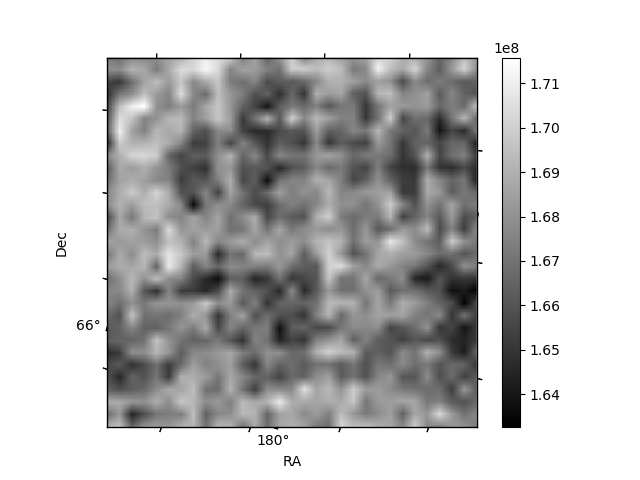
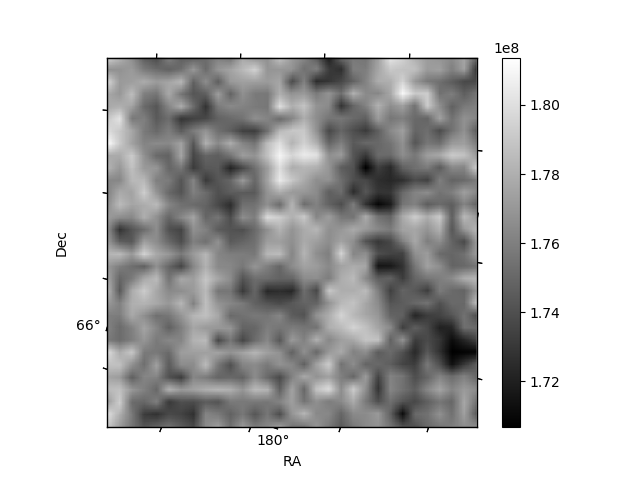
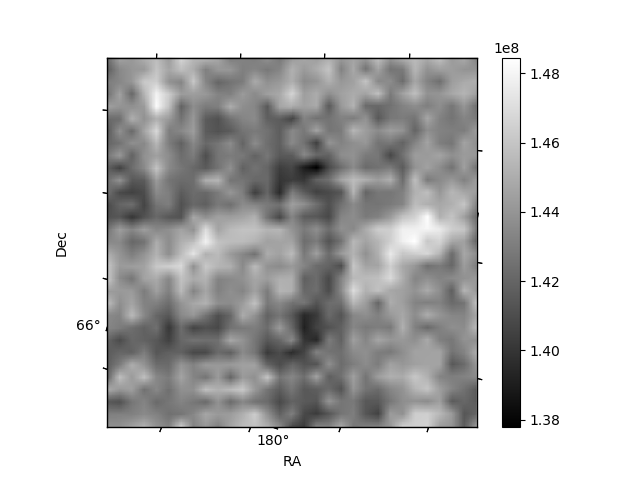
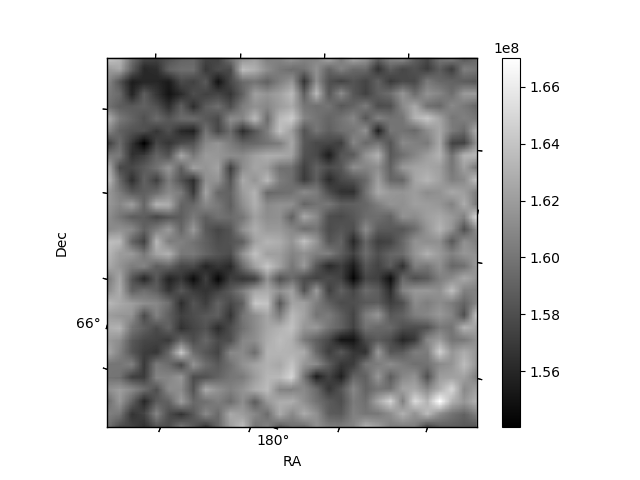
Histogram calculated using DETX and DETY for each event in the final _common_clean file
| Quadrant A | 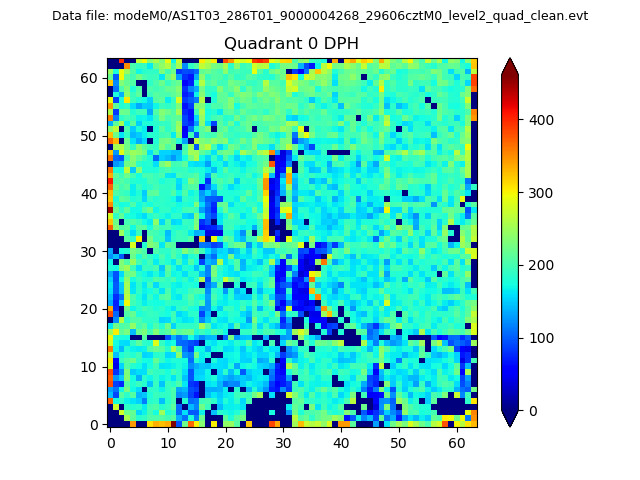 |
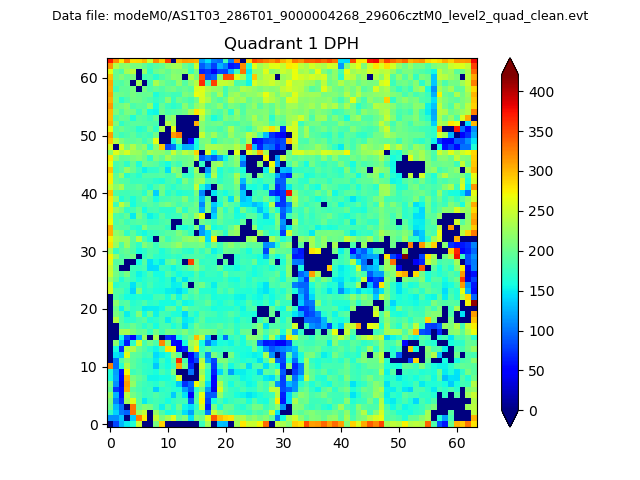 |
Quadrant B |
|---|---|---|---|
| Quadrant D | 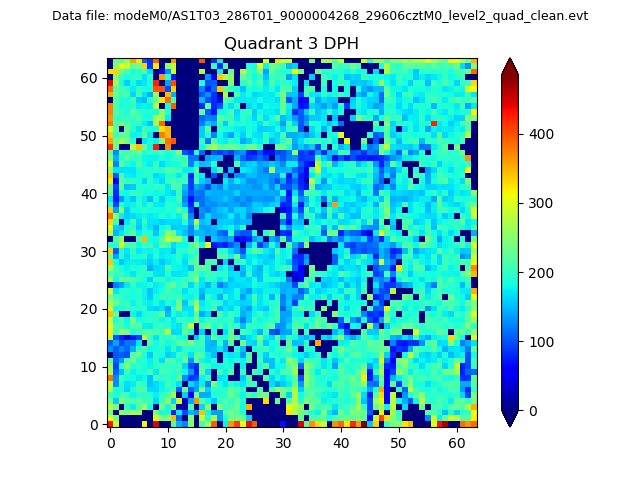 |
 |
Quadrant C |
| Plot type | Count rate plots | Images |
|---|---|---|
| Comparison with Poisson distribution Blue bars denote a histogram of data divided into 1 sec bins. Red curve is a Poisson curve with rate = median count rate of data. |
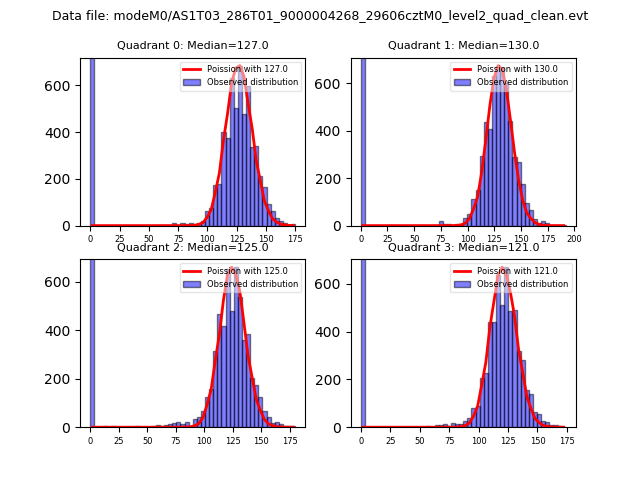 |
 |
| Quadrant-wise count rates Data is divided into 100 sec bins |
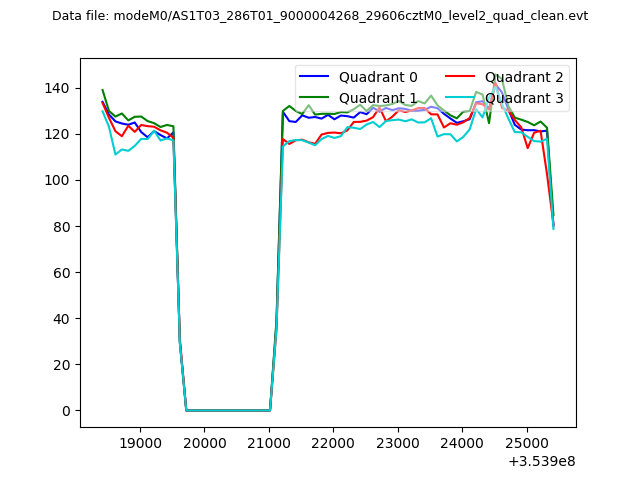 |
|
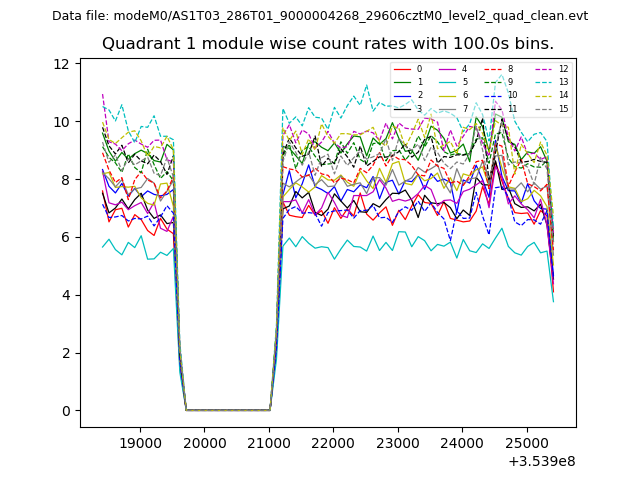
| Module-wise count rates for Quadrant A Data is divided into 100 sec bins |
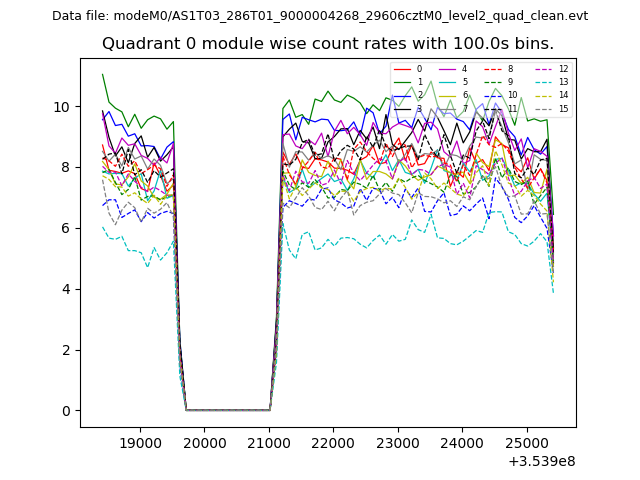 |
 |
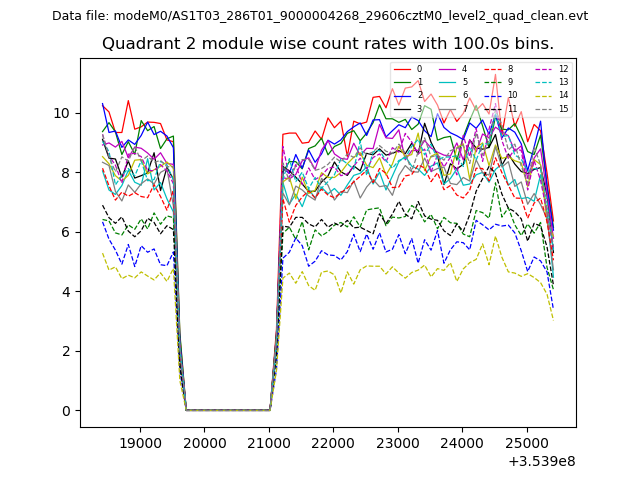
| Module-wise count rates for Quadrant B Data is divided into 100 sec bins |
 |
 |
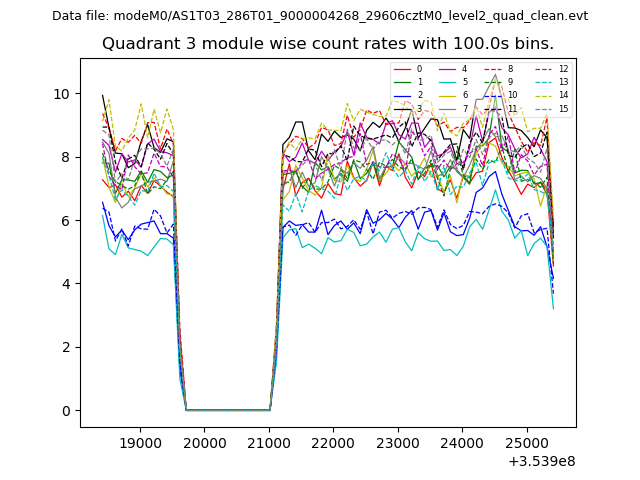
| Module-wise count rates for Quadrant C Data is divided into 100 sec bins |
 |
 |
| Module-wise count rates for Quadrant D Data is divided into 100 sec bins |
 |
 |
| Parameter | Plot |
|---|---|
| CZT HV Monitor | 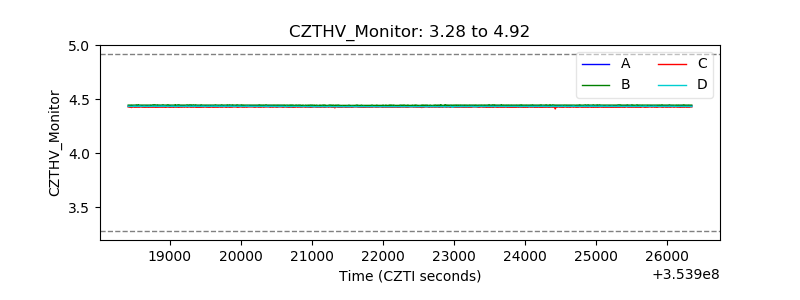 |
| D_VDD | 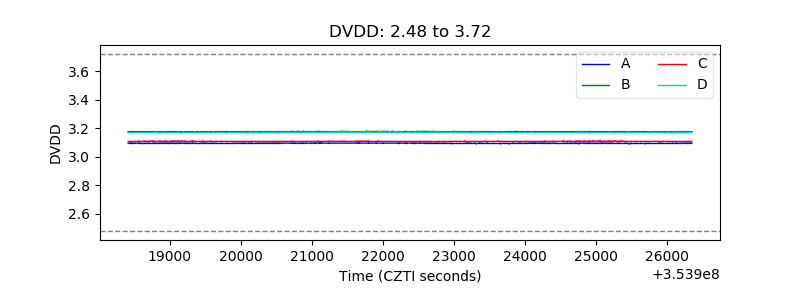 |
| Temperature 1 | 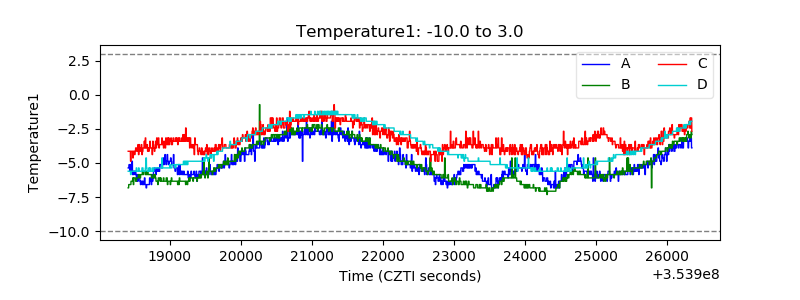 |
| Veto HV Monitor | 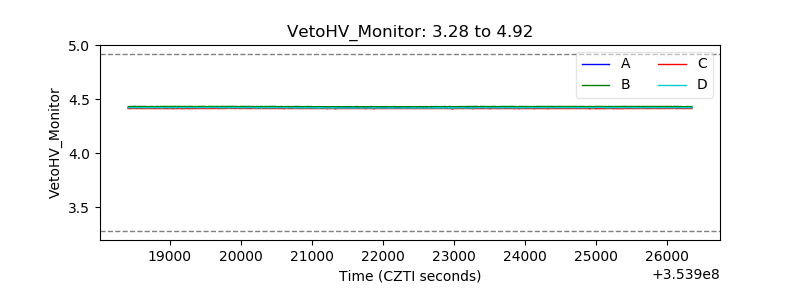 |
| Veto LLD | 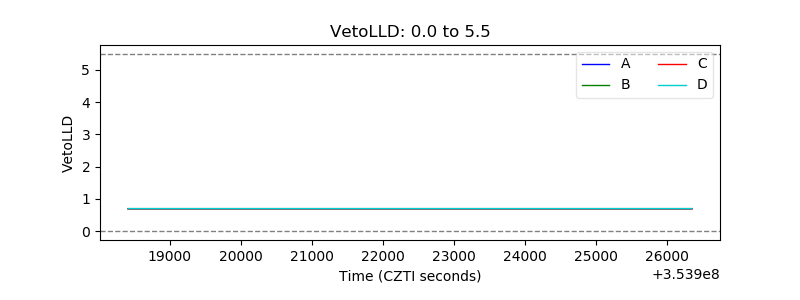 |
| Alpha Counter | 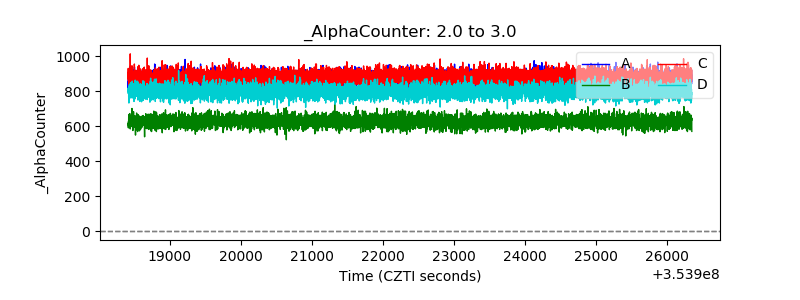 |
| _CPM_Rate | 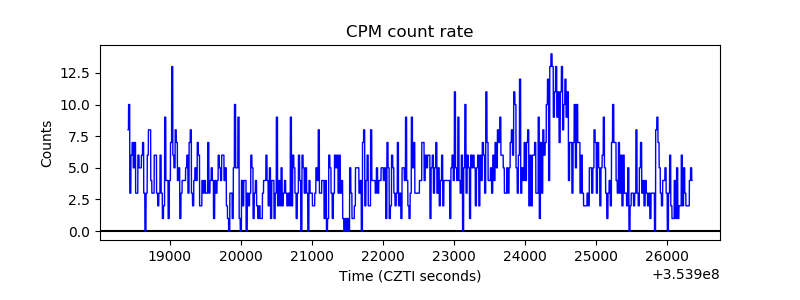 |
| CZT Counter | 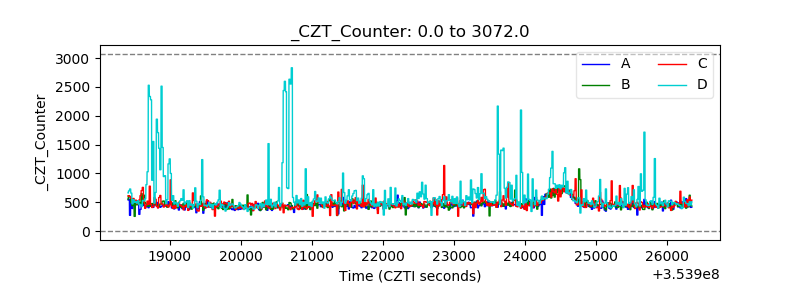 |
| +2.5 Volts monitor |  |
| +5 Volts monitor | 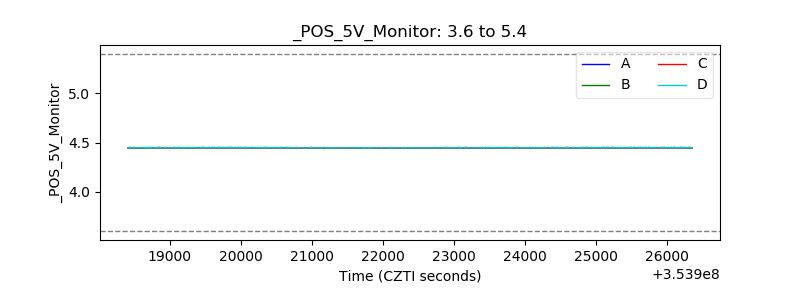 |
| _ROLL_ROT | 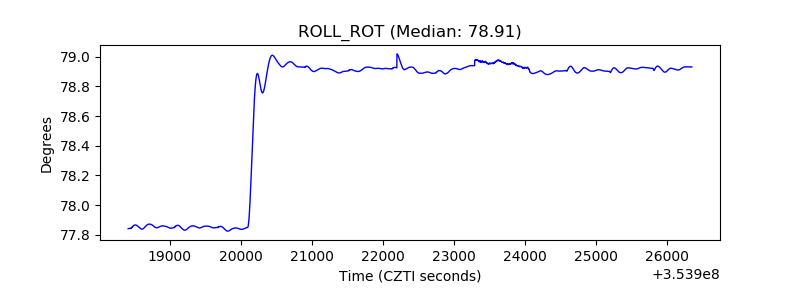 |
| _Roll_DEC | 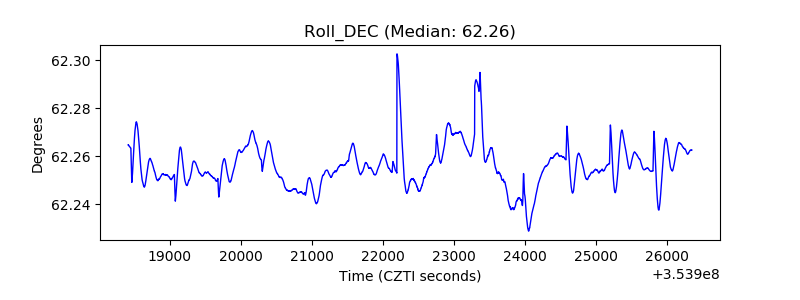 |
| _Roll_RA | 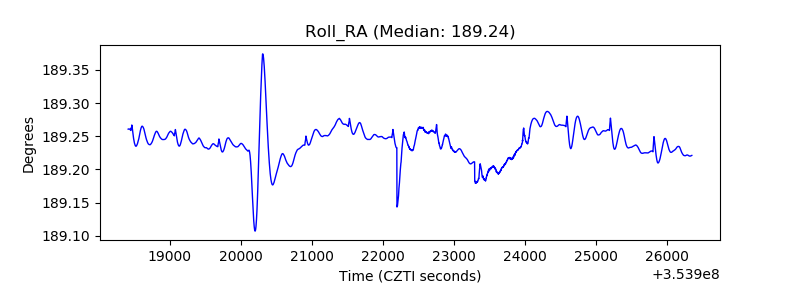 |
| Veto Counter | 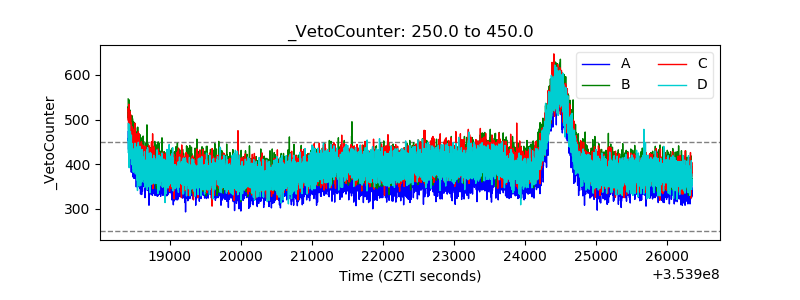 |