| Param | Original file | Final file |
|---|---|---|
| Filename | modeM0/AS1T03_286T01_9000004268_29607cztM0_level2.evt | modeM0/AS1T03_286T01_9000004268_29607cztM0_level2_quad_clean.evt |
| Size (bytes) | 526,412,160 | 91,897,920 |
| Size | 502.0 MB | 87.6 MB |
| Events in quadrant A | 3,328,848 | 577,939 |
| Events in quadrant B | 3,418,297 | 591,943 |
| Events in quadrant C | 3,524,960 | 559,124 |
| Events in quadrant D | 5,176,527 | 547,594 |
| Mode M9 | |||
|---|---|---|---|
| Quadrant | BADHDUFLAG | Total packets | Discarded packets |
| A | 0 | 3 | 0 |
| B | 0 | 3 | 0 |
| C | 0 | 3 | 0 |
| D | 0 | 3 | 0 |
| Mode SS | |||
|---|---|---|---|
| Quadrant | BADHDUFLAG | Total packets | Discarded packets |
| A | 0 | 146 | 0 |
| B | 0 | 146 | 0 |
| C | 0 | 146 | 0 |
| D | 0 | 146 | 0 |
| Mode M0 | |||
|---|---|---|---|
| Quadrant | BADHDUFLAG | Total packets | Discarded packets |
| A | 0 | 14766 | 2 |
| B | 0 | 14917 | 1 |
| C | 0 | 15167 | 1 |
| D | 0 | 20138 | 1 |
| Quadrant | Total seconds | Saturated seconds | Saturation percentage |
|---|---|---|---|
| A | 7275 | 101 | 1.388316% |
| B | 7276 | 138 | 1.896647% |
| C | 7276 | 264 | 3.628367% |
| D | 7276 | 351 | 4.824079% |
Noise dominated data is calculated using 1-second bins in cleaned event files. If a bin has >2000 counts, and if more than 50% of those come from <1% of pixels, then it is considered to be noise-dominated and hence unusable.
| Quadrant | # 1 sec bins | Bins with >0 counts | Bins with >2000 counts | High rate bins dominated by noise | Noise dominated (total time) | Noise dominated (detector-on time) | Marked lightcurve |
|---|---|---|---|---|---|---|---|
| A | 7515 | 7276 | 0 | 0 | 0.00% | 0.00% | 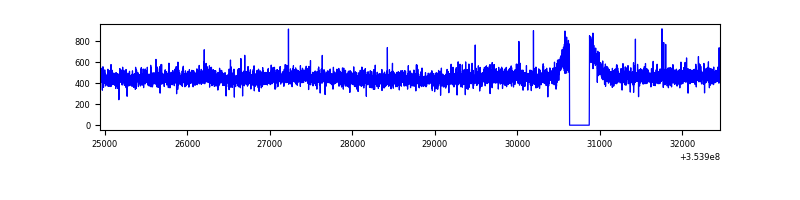 |
| B | 7516 | 7276 | 7 | 7 | 0.09% | 0.10% | 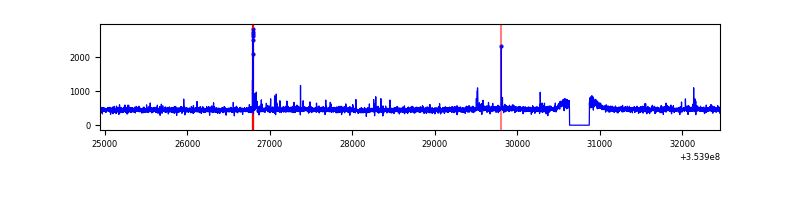 |
| C | 7516 | 7277 | 2 | 2 | 0.03% | 0.03% | 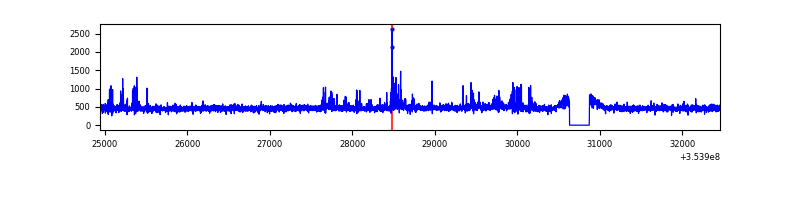 |
| D | 7516 | 7277 | 248 | 248 | 3.30% | 3.41% | 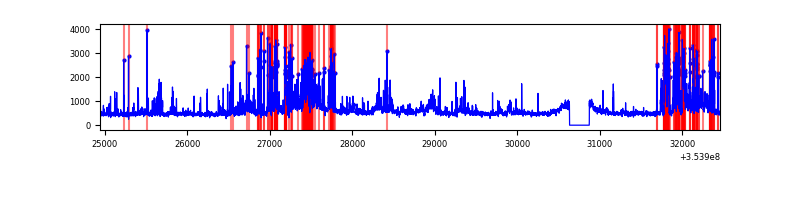 |
Top three noisy pixels from each quadrant. If the there are fewer than three noisy pixels in the level2.evt file, extra rows are filled as -1
| Pixel properties | Quadrant properties | ||||||
|---|---|---|---|---|---|---|---|
| Quadrant | DetID | PixID | Counts | Sigma | Mean | Median | Sigma |
| A | 1 | 113 | 14363 | 78.12 | 858 | 838 | 173.1 |
| A | 13 | 254 | 12563 | 67.72 | 858 | 838 | 173.1 |
| A | 3 | 137 | 8933 | 46.76 | 858 | 838 | 173.1 |
| B | 12 | 111 | 21138 | 123.24 | 853 | 830 | 164.8 |
| B | 5 | 172 | 20990 | 122.35 | 853 | 830 | 164.8 |
| B | 0 | 230 | 19244 | 111.75 | 853 | 830 | 164.8 |
| C | 14 | 238 | 186106 | 974.13 | 815 | 821 | 190.2 |
| C | 14 | 254 | 72944 | 379.18 | 815 | 821 | 190.2 |
| C | 10 | 22 | 43109 | 222.33 | 815 | 821 | 190.2 |
| D | 7 | 80 | 1184003 | 6150.81 | 816 | 793 | 192.4 |
| D | 8 | 195 | 441267 | 2289.76 | 816 | 793 | 192.4 |
| D | 12 | 227 | 227473 | 1178.38 | 816 | 793 | 192.4 |
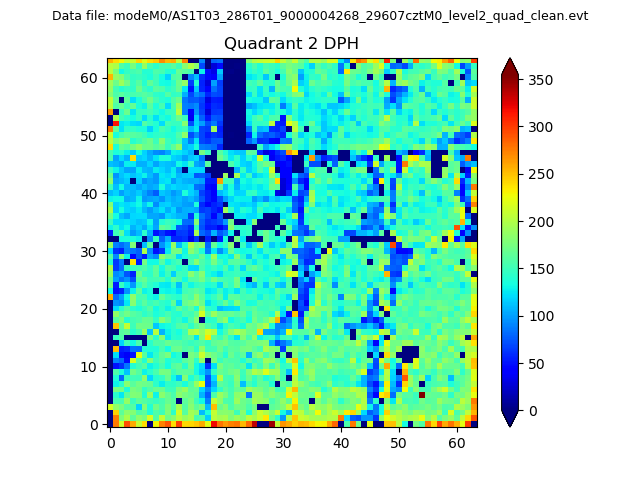
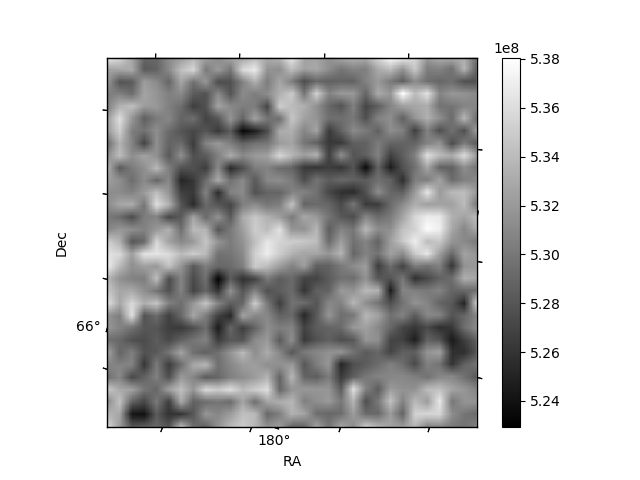
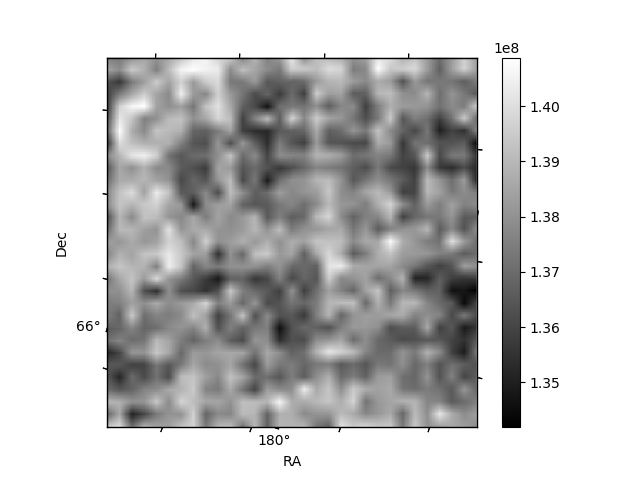
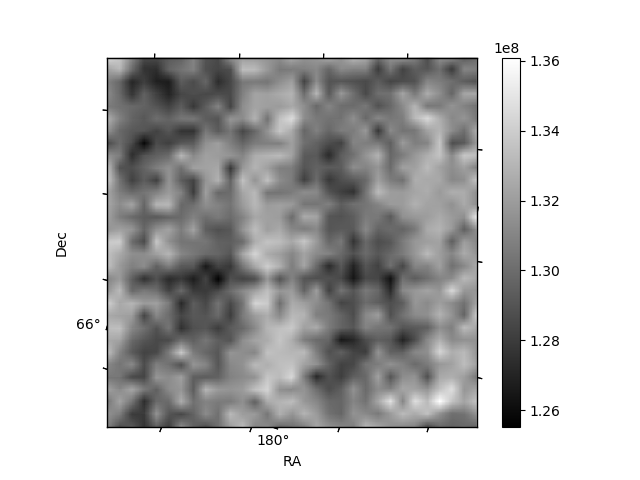
Histogram calculated using DETX and DETY for each event in the final _common_clean file
| Quadrant A | 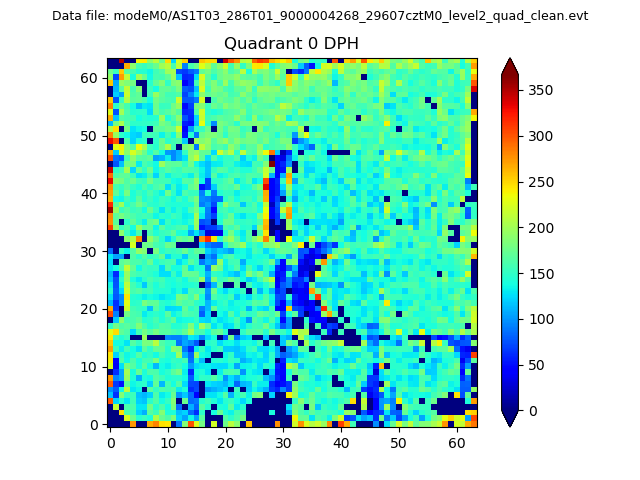 |
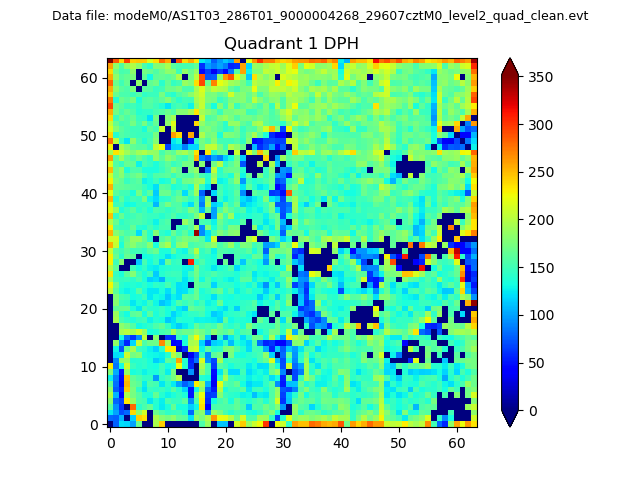 |
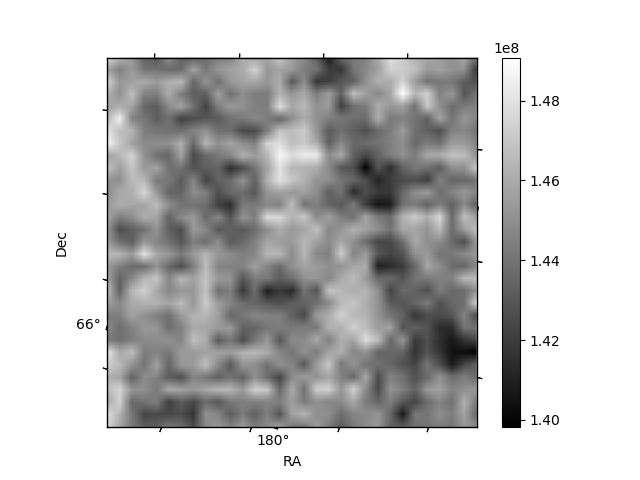
Quadrant B |
|---|---|---|---|
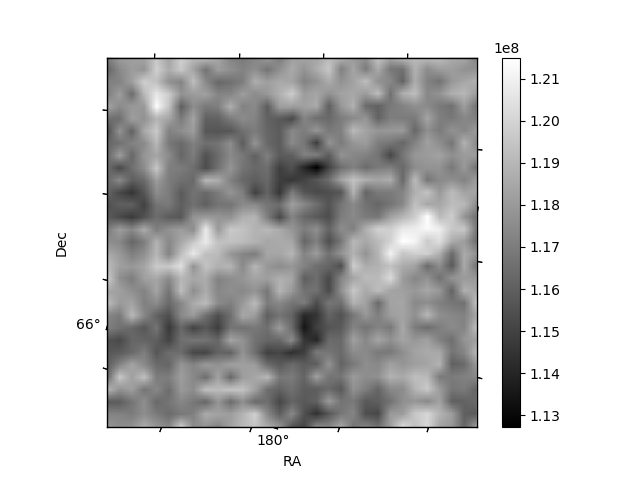
| Quadrant D | 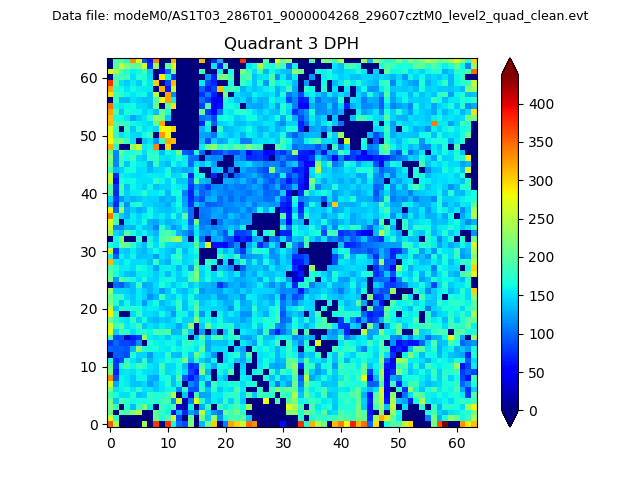 |
 |
Quadrant C |
| Plot type | Count rate plots | Images |
|---|---|---|
| Comparison with Poisson distribution Blue bars denote a histogram of data divided into 1 sec bins. Red curve is a Poisson curve with rate = median count rate of data. |
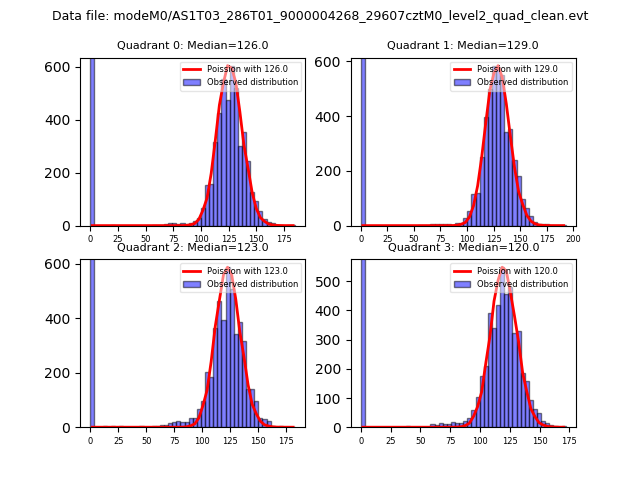 |
 |
| Quadrant-wise count rates Data is divided into 100 sec bins |
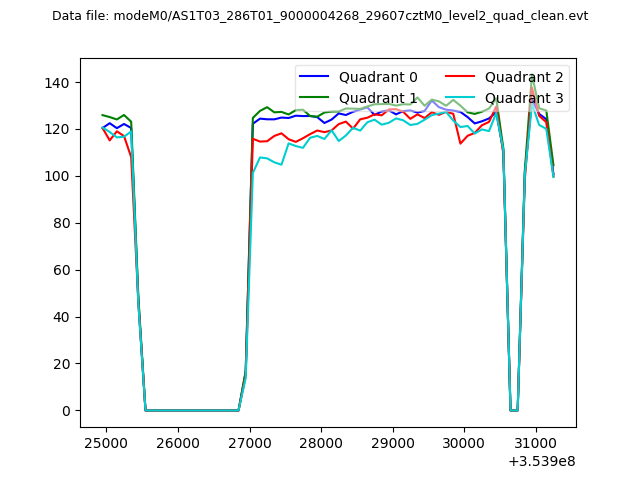 |
|
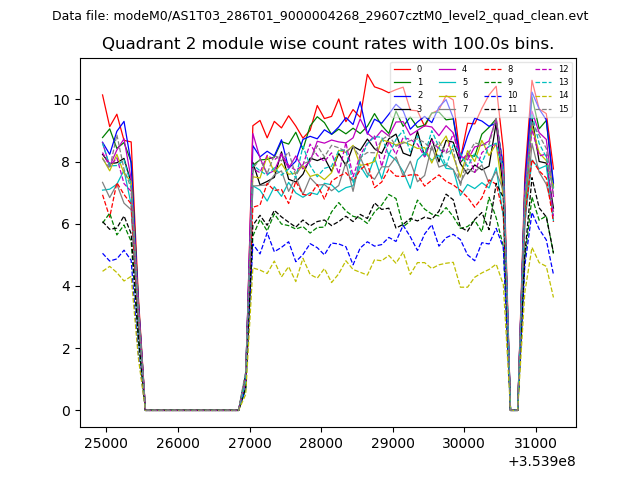
| Module-wise count rates for Quadrant A Data is divided into 100 sec bins |
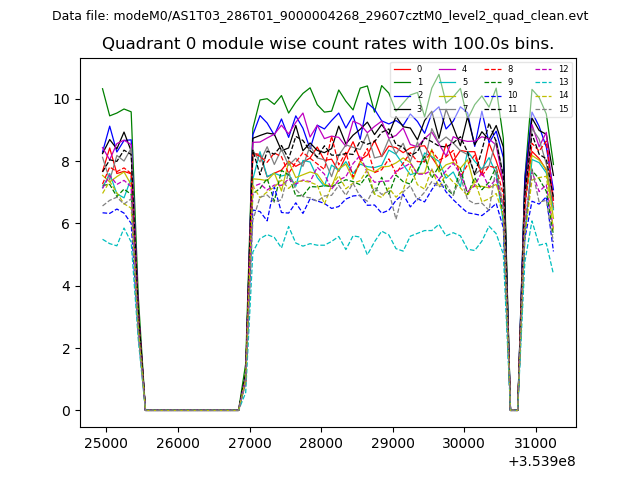 |
 |
| Module-wise count rates for Quadrant B Data is divided into 100 sec bins |
 |
 |
| Module-wise count rates for Quadrant C Data is divided into 100 sec bins |
 |
 |
| Module-wise count rates for Quadrant D Data is divided into 100 sec bins |
 |
 |
| Parameter | Plot |
|---|---|
| CZT HV Monitor |  |
| D_VDD | 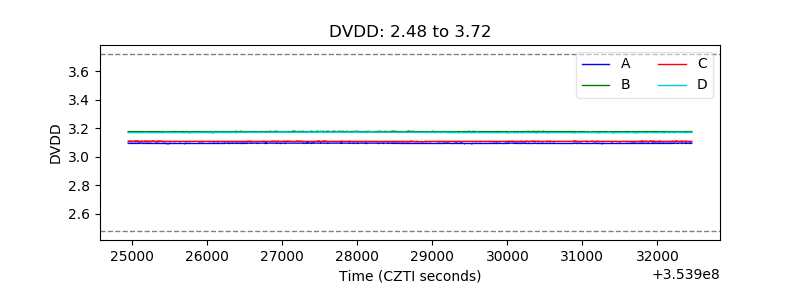 |
| Temperature 1 | 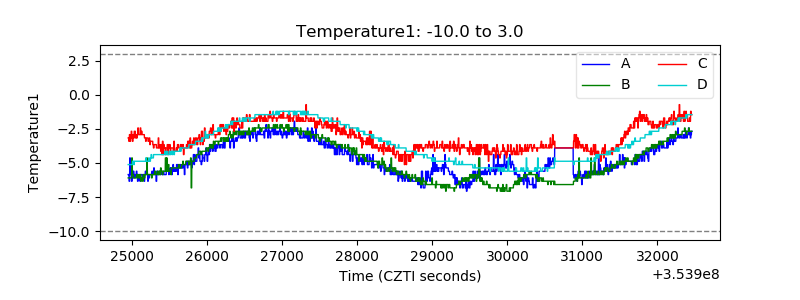 |
| Veto HV Monitor | 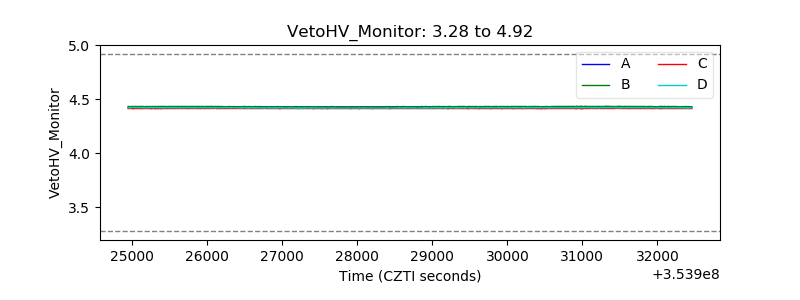 |
| Veto LLD | 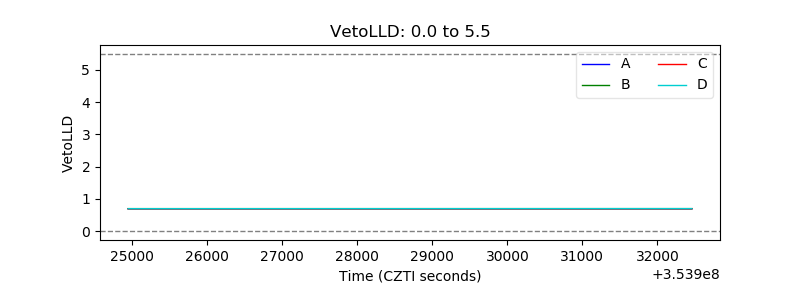 |
| Alpha Counter | 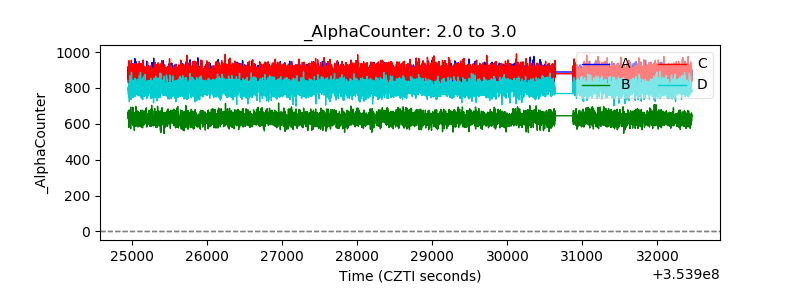 |
| _CPM_Rate | 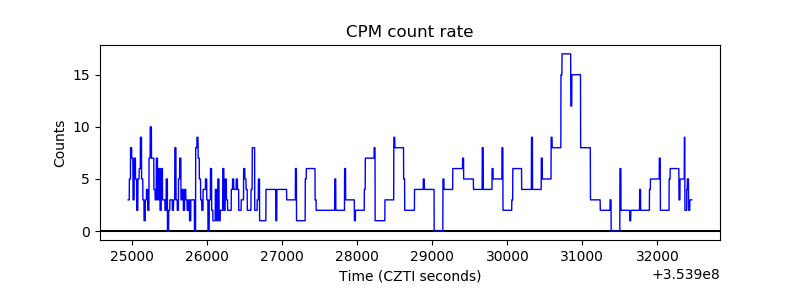 |
| CZT Counter | 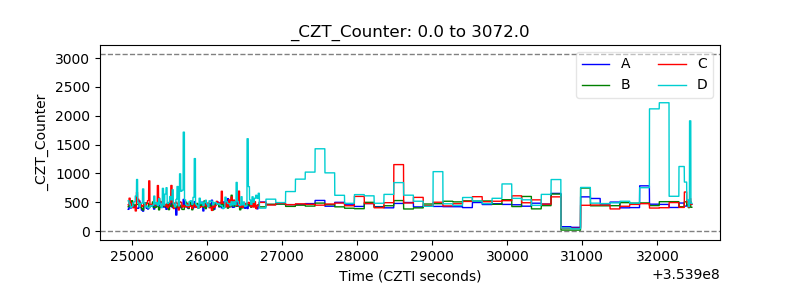 |
| +2.5 Volts monitor |  |
| +5 Volts monitor |  |
| _ROLL_ROT |  |
| _Roll_DEC | 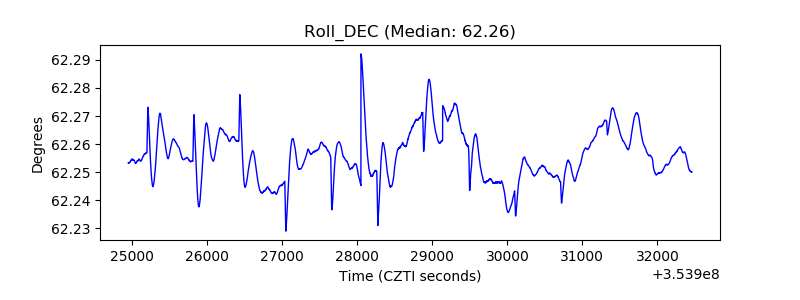 |
| _Roll_RA | 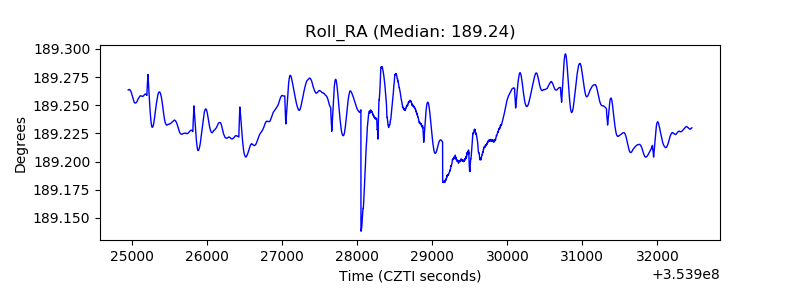 |
| Veto Counter |  |