| Param | Original file | Final file |
|---|---|---|
| Filename | modeM0/AS1T03_286T01_9000004268_29610cztM0_level2.evt | modeM0/AS1T03_286T01_9000004268_29610cztM0_level2_quad_clean.evt |
| Size (bytes) | 809,864,640 | 173,551,680 |
| Size | 772.3 MB | 165.5 MB |
| Events in quadrant A | 5,093,368 | 1,148,652 |
| Events in quadrant B | 5,236,716 | 1,161,994 |
| Events in quadrant C | 5,487,966 | 1,105,543 |
| Events in quadrant D | 7,961,292 | 1,076,334 |
| Mode M9 | |||
|---|---|---|---|
| Quadrant | BADHDUFLAG | Total packets | Discarded packets |
| A | 0 | 14 | 0 |
| B | 0 | 14 | 0 |
| C | 0 | 14 | 0 |
| D | 0 | 14 | 0 |
| Mode SS | |||
|---|---|---|---|
| Quadrant | BADHDUFLAG | Total packets | Discarded packets |
| A | 0 | 224 | 0 |
| B | 0 | 224 | 0 |
| C | 0 | 224 | 0 |
| D | 0 | 224 | 0 |
| Mode M0 | |||
|---|---|---|---|
| Quadrant | BADHDUFLAG | Total packets | Discarded packets |
| A | 0 | 22645 | 2 |
| B | 0 | 22824 | 2 |
| C | 0 | 23428 | 3 |
| D | 0 | 31169 | 2 |
| Quadrant | Total seconds | Saturated seconds | Saturation percentage |
|---|---|---|---|
| A | 11040 | 132 | 1.195652% |
| B | 11040 | 186 | 1.684783% |
| C | 11039 | 473 | 4.284808% |
| D | 11039 | 451 | 4.085515% |
Noise dominated data is calculated using 1-second bins in cleaned event files. If a bin has >2000 counts, and if more than 50% of those come from <1% of pixels, then it is considered to be noise-dominated and hence unusable.
| Quadrant | # 1 sec bins | Bins with >0 counts | Bins with >2000 counts | High rate bins dominated by noise | Noise dominated (total time) | Noise dominated (detector-on time) | Marked lightcurve |
|---|---|---|---|---|---|---|---|
| A | 12450 | 11040 | 2 | 2 | 0.02% | 0.02% | 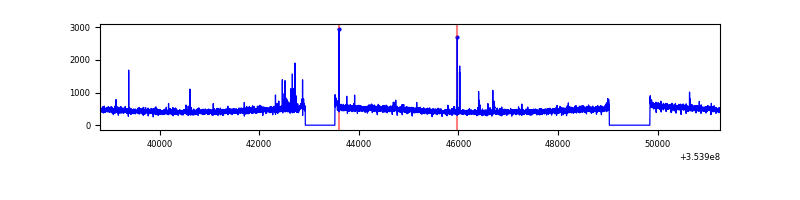 |
| B | 12450 | 11040 | 14 | 14 | 0.11% | 0.13% | 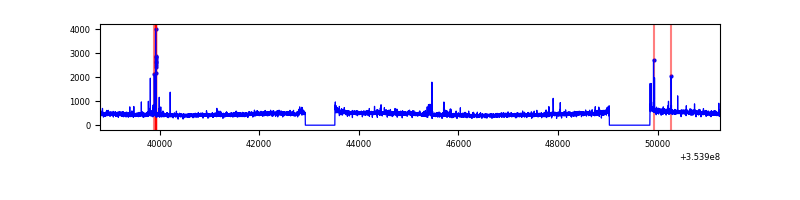 |
| C | 12449 | 11039 | 13 | 13 | 0.10% | 0.12% | 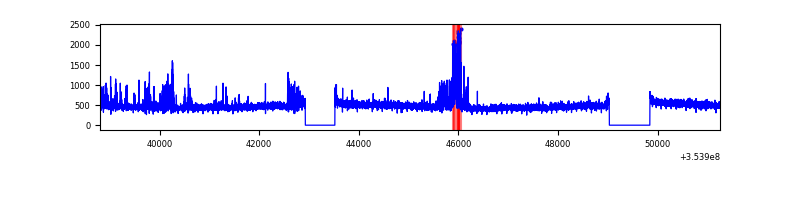 |
| D | 12449 | 11040 | 294 | 294 | 2.36% | 2.66% | 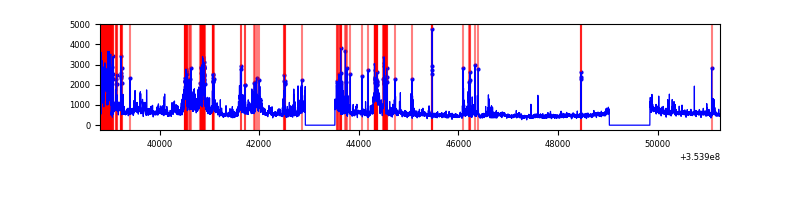 |
Top three noisy pixels from each quadrant. If the there are fewer than three noisy pixels in the level2.evt file, extra rows are filled as -1
| Pixel properties | Quadrant properties | ||||||
|---|---|---|---|---|---|---|---|
| Quadrant | DetID | PixID | Counts | Sigma | Mean | Median | Sigma |
| A | 12 | 96 | 57814 | 215.13 | 1304 | 1276 | 262.8 |
| A | 13 | 254 | 18261 | 64.63 | 1304 | 1276 | 262.8 |
| A | 3 | 137 | 13309 | 45.79 | 1304 | 1276 | 262.8 |
| B | 0 | 229 | 55582 | 217.76 | 1295 | 1257 | 249.5 |
| B | 5 | 172 | 45985 | 179.29 | 1295 | 1257 | 249.5 |
| B | 12 | 111 | 31250 | 120.23 | 1295 | 1257 | 249.5 |
| C | 14 | 238 | 304538 | 1039.16 | 1247 | 1250 | 291.9 |
| C | 14 | 254 | 145513 | 494.29 | 1247 | 1250 | 291.9 |
| C | 10 | 22 | 143709 | 488.11 | 1247 | 1250 | 291.9 |
| D | 12 | 227 | 1055788 | 3527.82 | 1251 | 1214 | 298.9 |
| D | 8 | 195 | 715486 | 2389.43 | 1251 | 1214 | 298.9 |
| D | 7 | 238 | 597732 | 1995.51 | 1251 | 1214 | 298.9 |
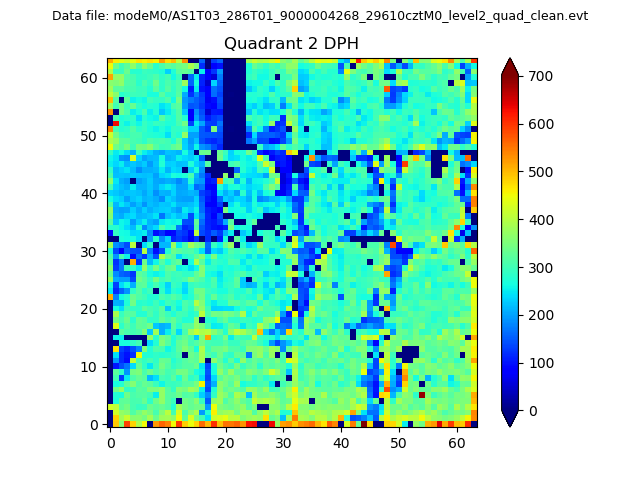
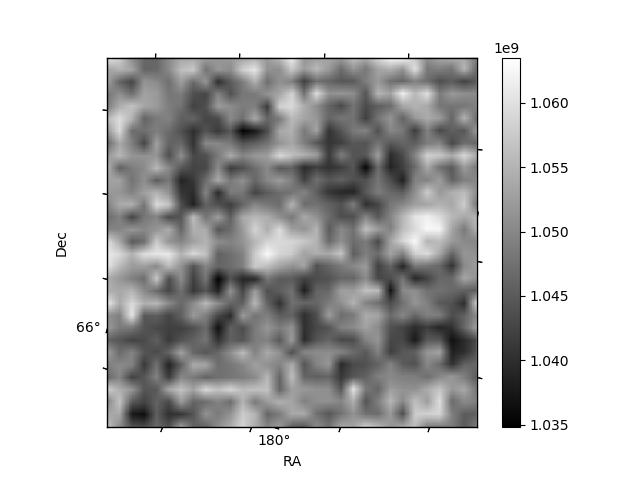
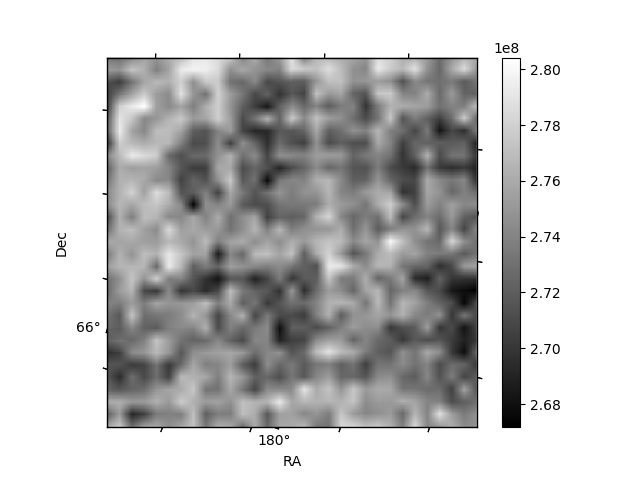
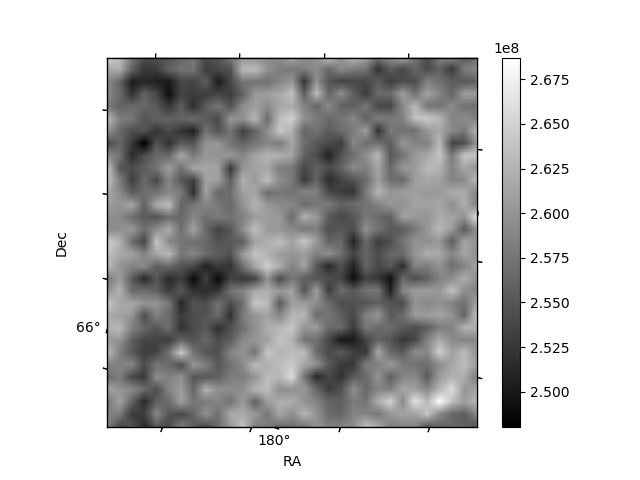
Histogram calculated using DETX and DETY for each event in the final _common_clean file
| Quadrant A | 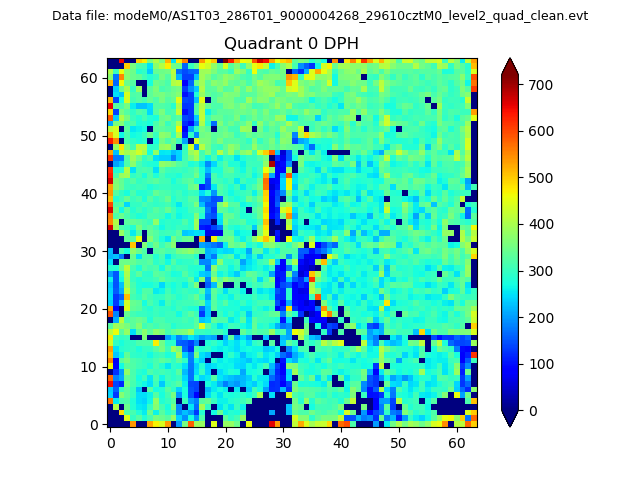 |
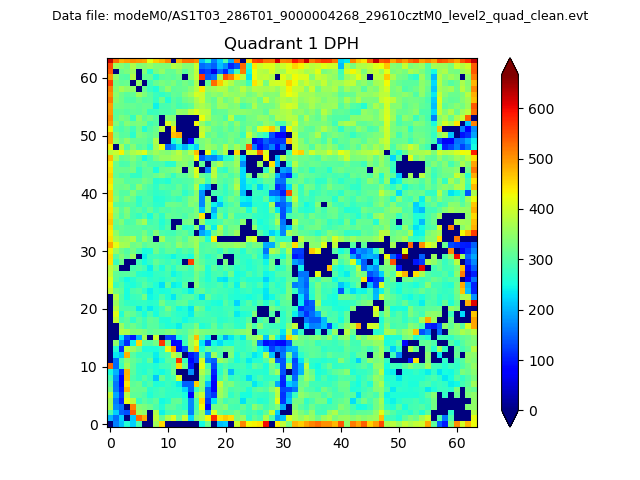 |
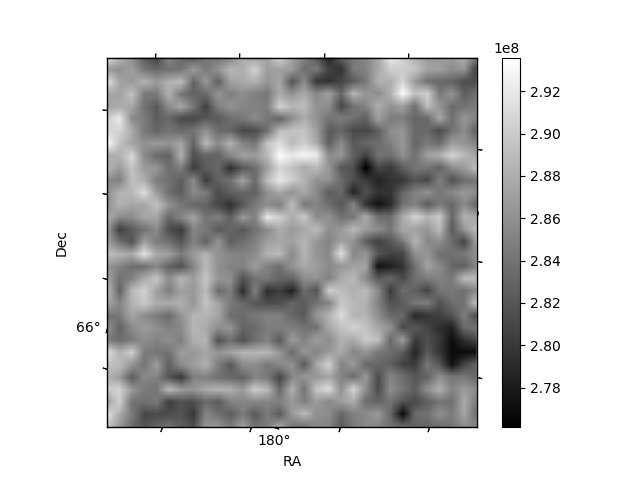
Quadrant B |
|---|---|---|---|
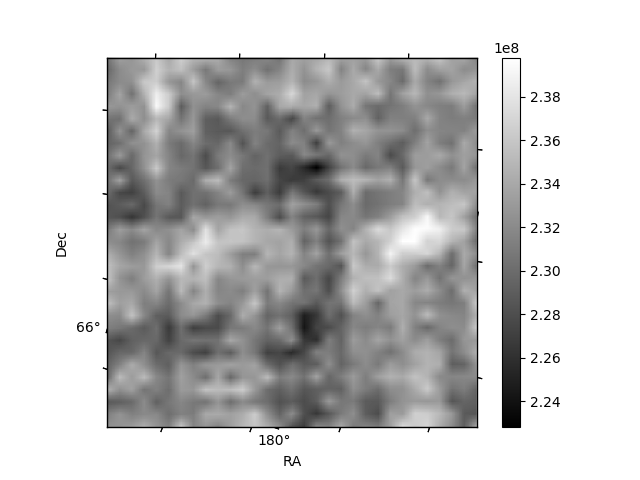
| Quadrant D | 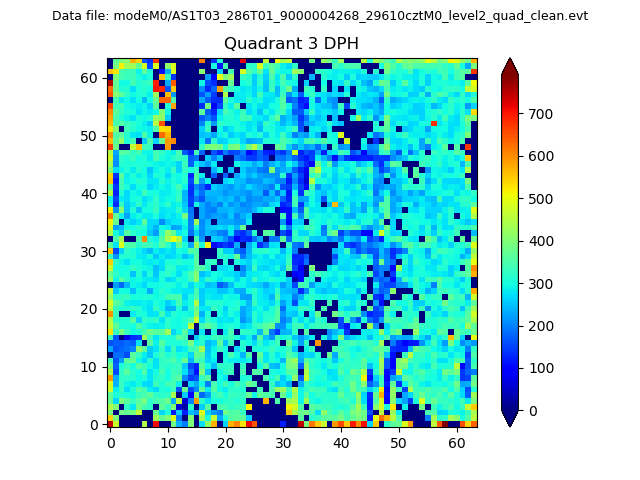 |
 |
Quadrant C |
| Plot type | Count rate plots | Images |
|---|---|---|
| Comparison with Poisson distribution Blue bars denote a histogram of data divided into 1 sec bins. Red curve is a Poisson curve with rate = median count rate of data. |
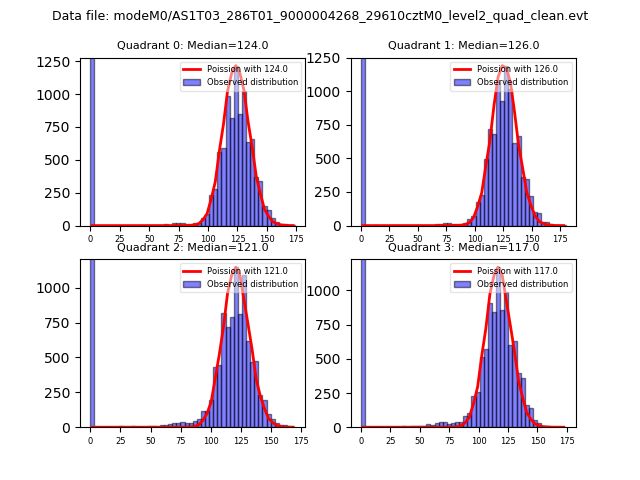 |
 |
| Quadrant-wise count rates Data is divided into 100 sec bins |
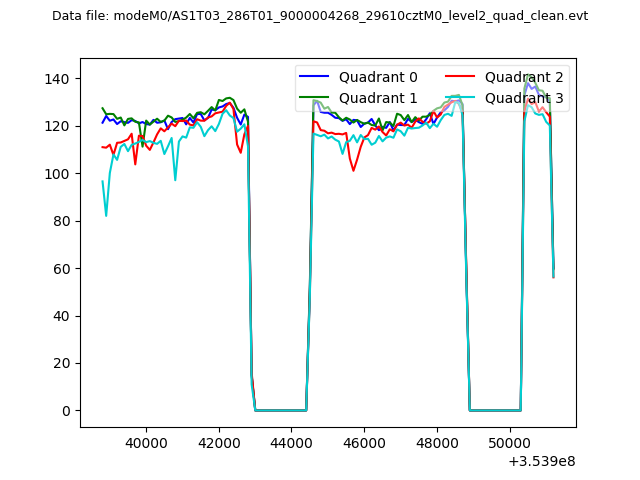 |
|
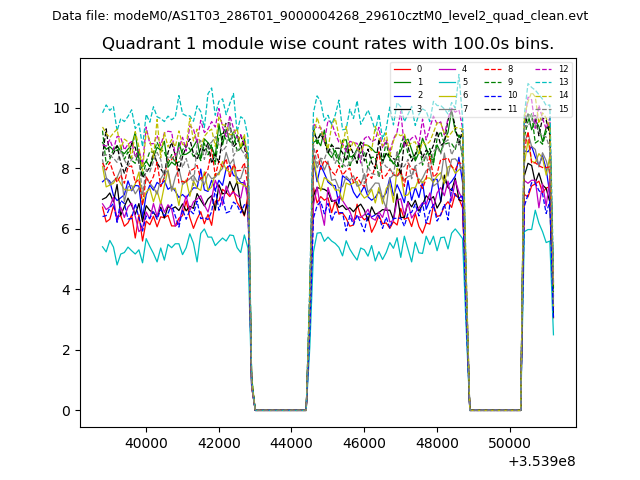
| Module-wise count rates for Quadrant A Data is divided into 100 sec bins |
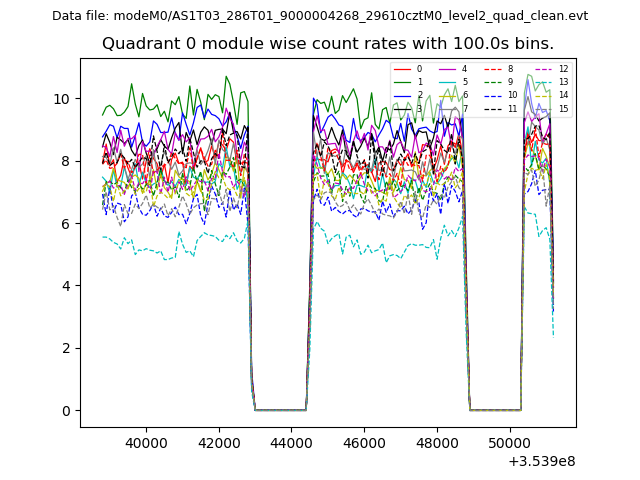 |
 |
| Module-wise count rates for Quadrant B Data is divided into 100 sec bins |
 |
 |
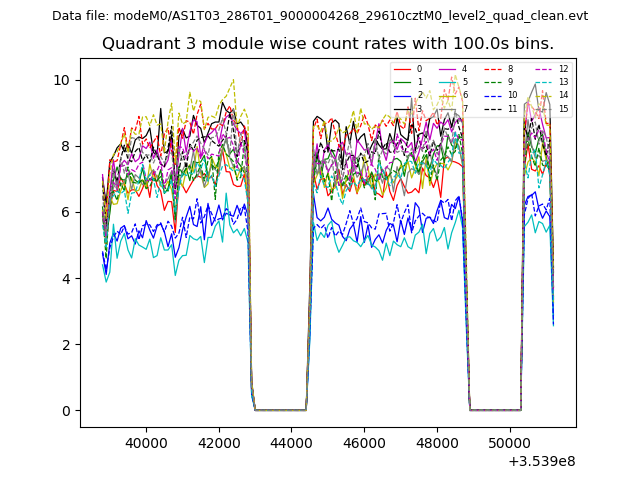
| Module-wise count rates for Quadrant C Data is divided into 100 sec bins |
 |
 |
| Module-wise count rates for Quadrant D Data is divided into 100 sec bins |
 |
 |
| Parameter | Plot |
|---|---|
| CZT HV Monitor | 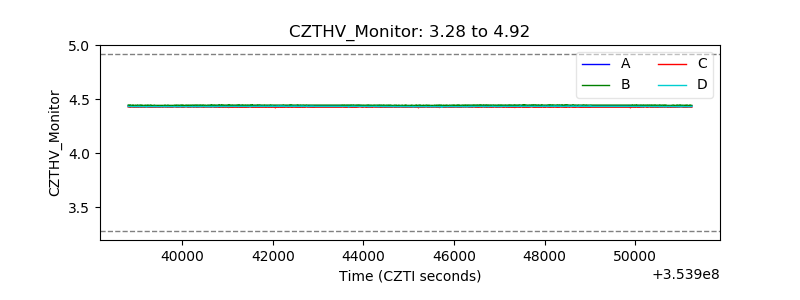 |
| D_VDD | 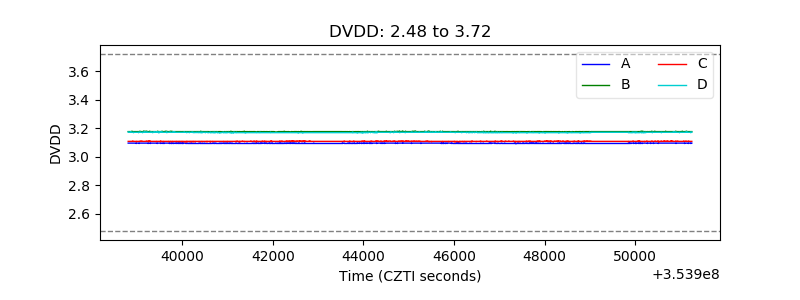 |
| Temperature 1 | 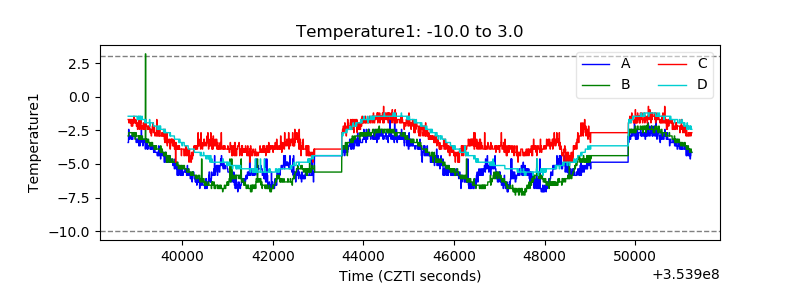 |
| Veto HV Monitor | 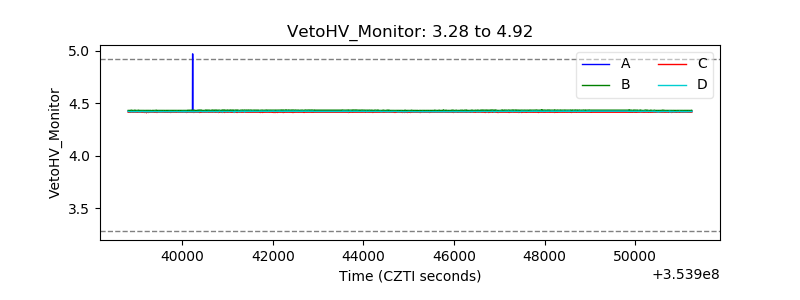 |
| Veto LLD | 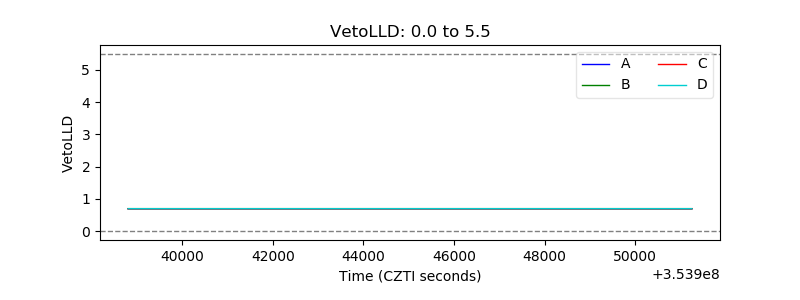 |
| Alpha Counter | 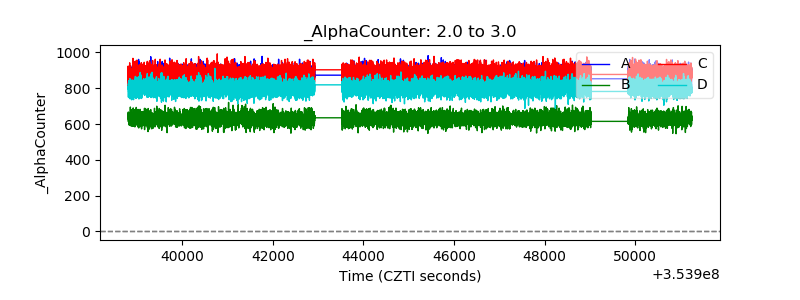 |
| _CPM_Rate | 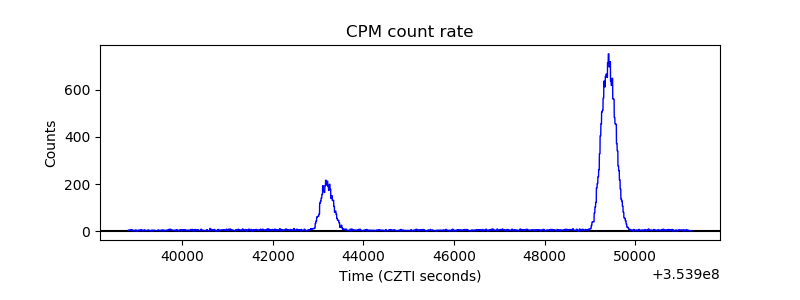 |
| CZT Counter | 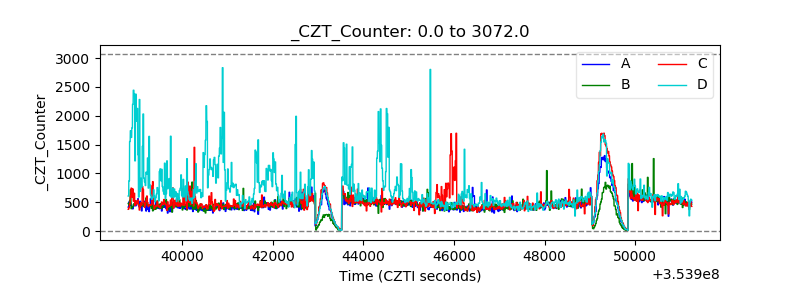 |
| +2.5 Volts monitor |  |
| +5 Volts monitor | 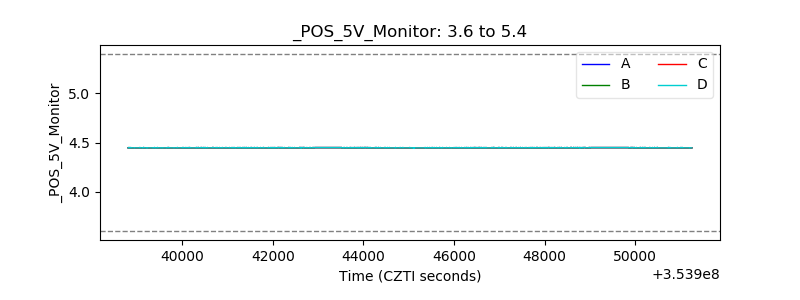 |
| _ROLL_ROT | 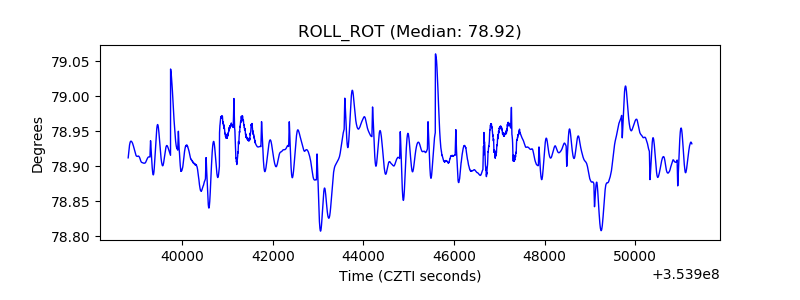 |
| _Roll_DEC | 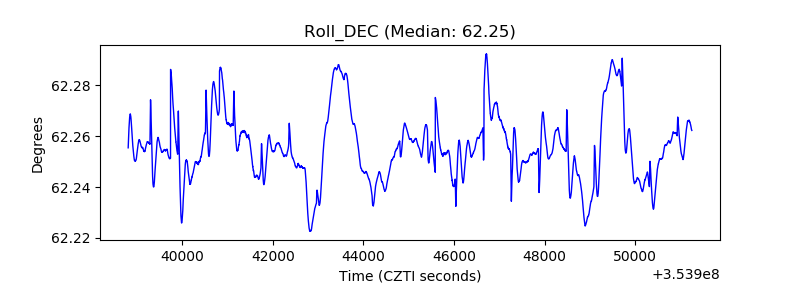 |
| _Roll_RA | 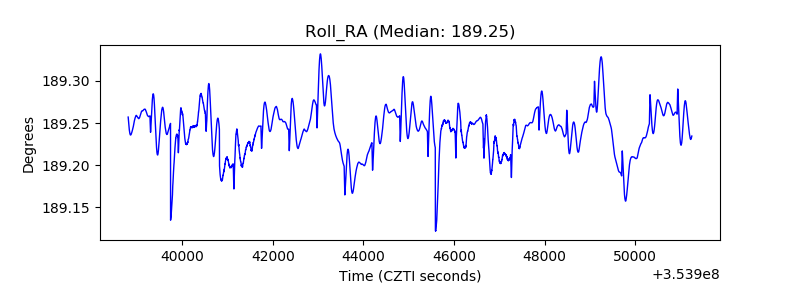 |
| Veto Counter | 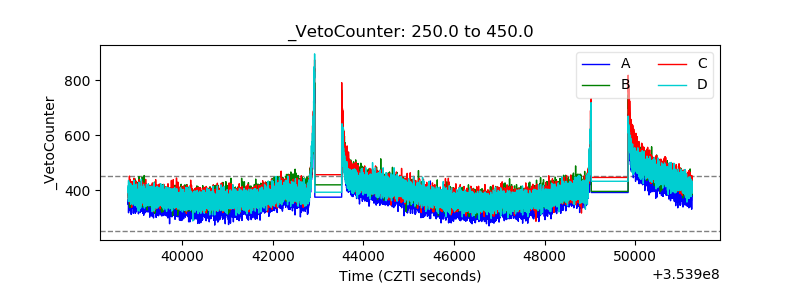 |