| Param | Original file | Final file |
|---|---|---|
| Filename | modeM0/AS1T03_286T01_9000004268_29611cztM0_level2.evt | modeM0/AS1T03_286T01_9000004268_29611cztM0_level2_quad_clean.evt |
| Size (bytes) | 483,451,200 | 109,218,240 |
| Size | 461.1 MB | 104.2 MB |
| Events in quadrant A | 3,147,306 | 723,653 |
| Events in quadrant B | 3,248,163 | 735,222 |
| Events in quadrant C | 3,271,365 | 706,448 |
| Events in quadrant D | 4,523,032 | 678,934 |
| Mode M9 | |||
|---|---|---|---|
| Quadrant | BADHDUFLAG | Total packets | Discarded packets |
| A | 0 | 16 | 0 |
| B | 0 | 17 | 0 |
| C | 0 | 17 | 0 |
| D | 0 | 17 | 0 |
| Mode SS | |||
|---|---|---|---|
| Quadrant | BADHDUFLAG | Total packets | Discarded packets |
| A | 0 | 136 | 0 |
| B | 0 | 136 | 0 |
| C | 0 | 136 | 0 |
| D | 0 | 136 | 0 |
| Mode M0 | |||
|---|---|---|---|
| Quadrant | BADHDUFLAG | Total packets | Discarded packets |
| A | 0 | 13894 | 2 |
| B | 0 | 14119 | 2 |
| C | 0 | 14060 | 2 |
| D | 0 | 17940 | 2 |
| Quadrant | Total seconds | Saturated seconds | Saturation percentage |
|---|---|---|---|
| A | 6646 | 40 | 0.601866% |
| B | 6646 | 64 | 0.962985% |
| C | 6646 | 111 | 1.670178% |
| D | 6646 | 251 | 3.776708% |
Noise dominated data is calculated using 1-second bins in cleaned event files. If a bin has >2000 counts, and if more than 50% of those come from <1% of pixels, then it is considered to be noise-dominated and hence unusable.
| Quadrant | # 1 sec bins | Bins with >0 counts | Bins with >2000 counts | High rate bins dominated by noise | Noise dominated (total time) | Noise dominated (detector-on time) | Marked lightcurve |
|---|---|---|---|---|---|---|---|
| A | 7656 | 6647 | 0 | 0 | 0.00% | 0.00% | 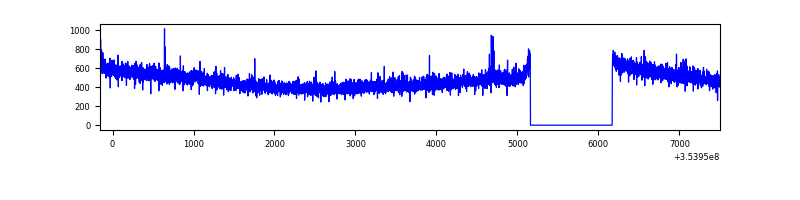 |
| B | 7656 | 6647 | 2 | 2 | 0.03% | 0.03% | 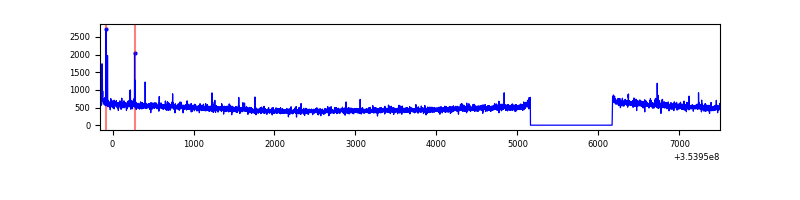 |
| C | 7656 | 6646 | 0 | 0 | 0.00% | 0.00% | 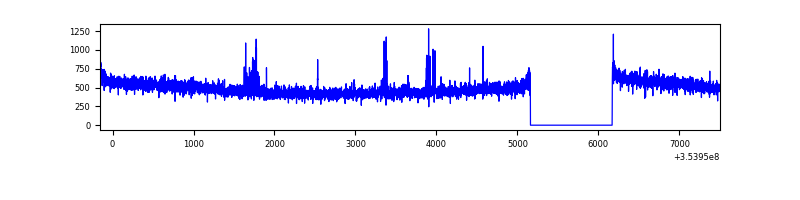 |
| D | 7656 | 6646 | 165 | 165 | 2.16% | 2.48% | 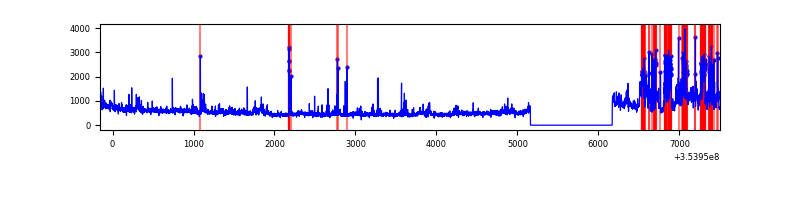 |
Top three noisy pixels from each quadrant. If the there are fewer than three noisy pixels in the level2.evt file, extra rows are filled as -1
| Pixel properties | Quadrant properties | ||||||
|---|---|---|---|---|---|---|---|
| Quadrant | DetID | PixID | Counts | Sigma | Mean | Median | Sigma |
| A | 13 | 254 | 11871 | 67.56 | 813 | 794 | 164.0 |
| A | 3 | 137 | 8188 | 45.1 | 813 | 794 | 164.0 |
| A | 0 | 226 | 6923 | 37.38 | 813 | 794 | 164.0 |
| B | 0 | 229 | 41965 | 268.79 | 807 | 786 | 153.2 |
| B | 0 | 189 | 24253 | 153.18 | 807 | 786 | 153.2 |
| B | 12 | 111 | 19040 | 119.15 | 807 | 786 | 153.2 |
| C | 14 | 238 | 142937 | 766.97 | 788 | 792 | 185.3 |
| C | 14 | 254 | 23401 | 121.99 | 788 | 792 | 185.3 |
| C | 10 | 22 | 16393 | 84.18 | 788 | 792 | 185.3 |
| D | 12 | 227 | 706376 | 3760.53 | 786 | 765 | 187.6 |
| D | 8 | 195 | 339172 | 1803.53 | 786 | 765 | 187.6 |
| D | 7 | 80 | 205055 | 1088.76 | 786 | 765 | 187.6 |
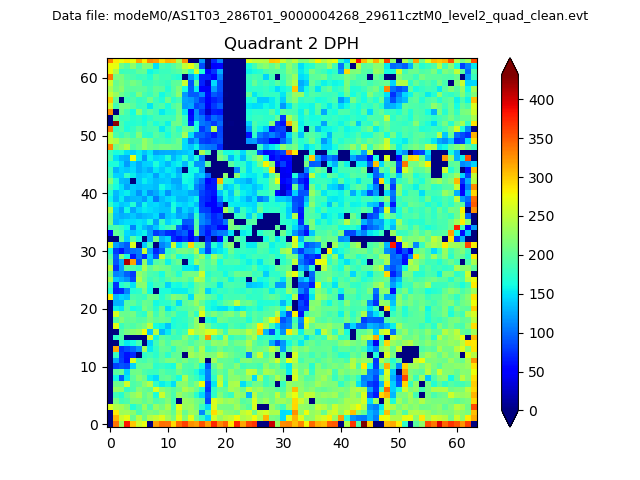
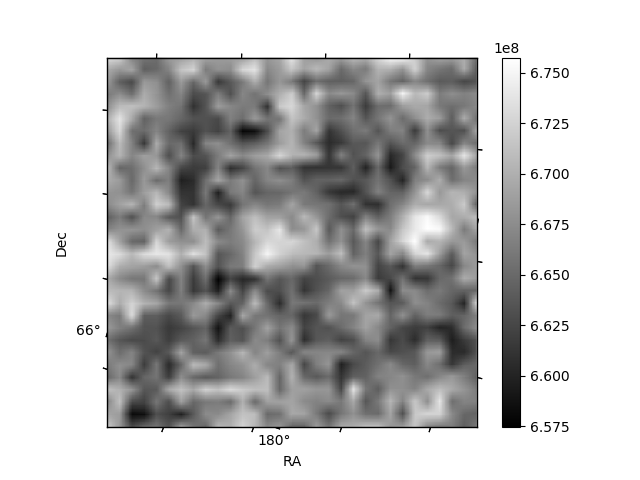
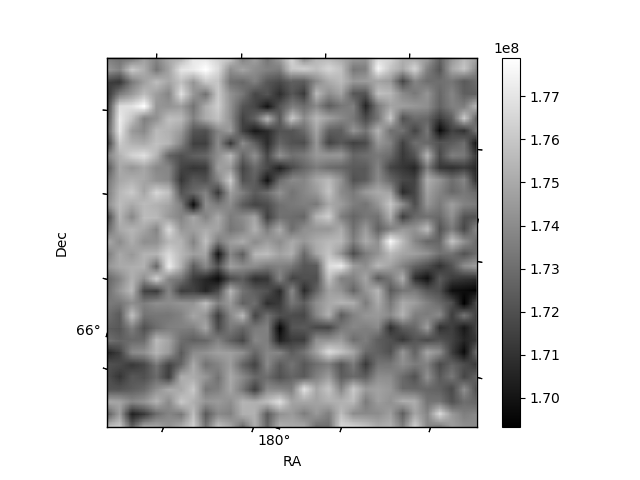
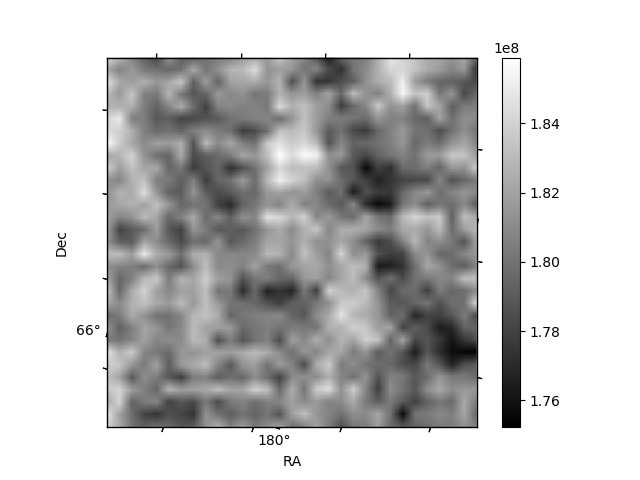
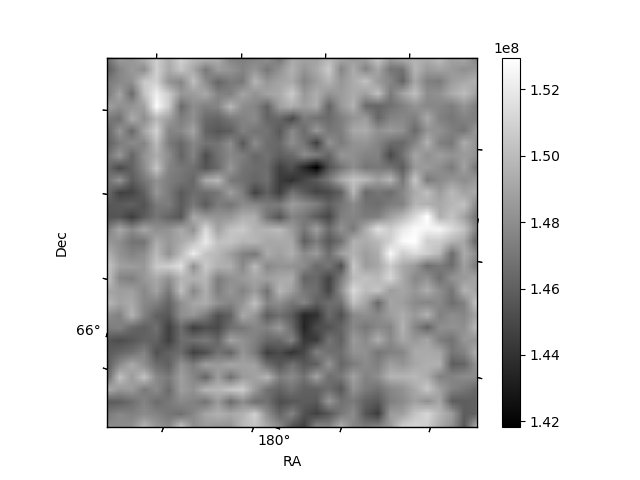
Histogram calculated using DETX and DETY for each event in the final _common_clean file
| Quadrant A | 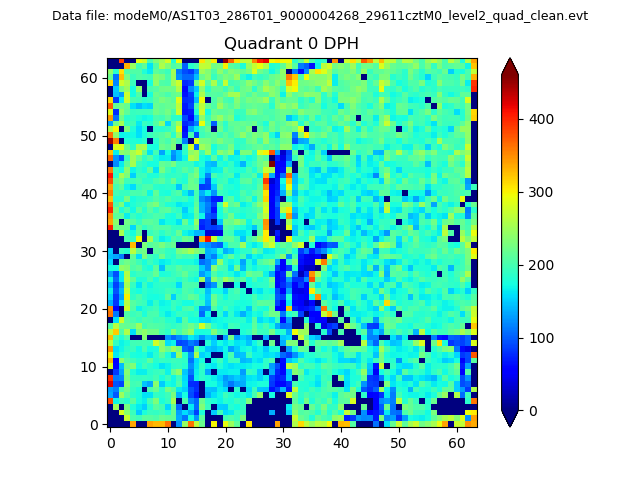 |
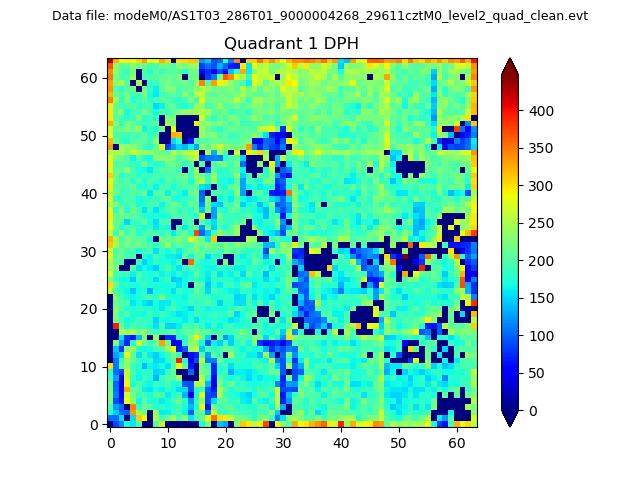 |
Quadrant B |
|---|---|---|---|
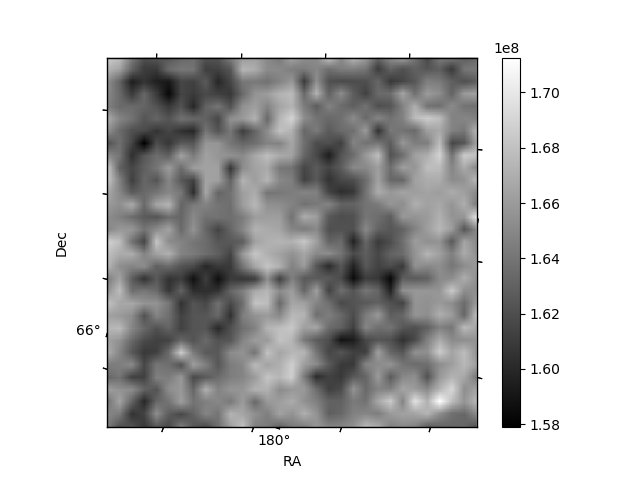
| Quadrant D | 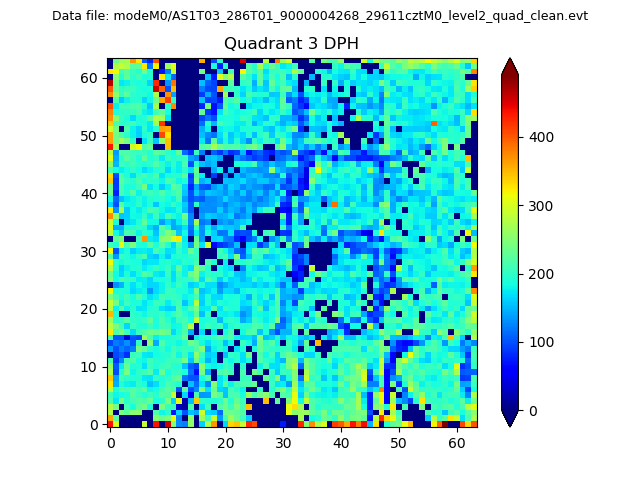 |
 |
Quadrant C |
| Plot type | Count rate plots | Images |
|---|---|---|
| Comparison with Poisson distribution Blue bars denote a histogram of data divided into 1 sec bins. Red curve is a Poisson curve with rate = median count rate of data. |
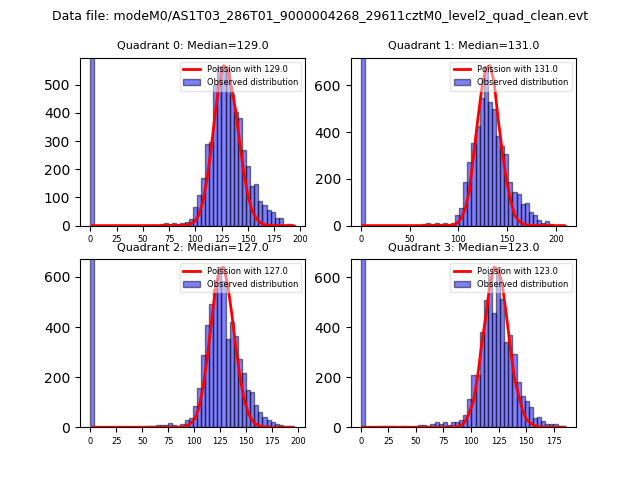 |
 |
| Quadrant-wise count rates Data is divided into 100 sec bins |
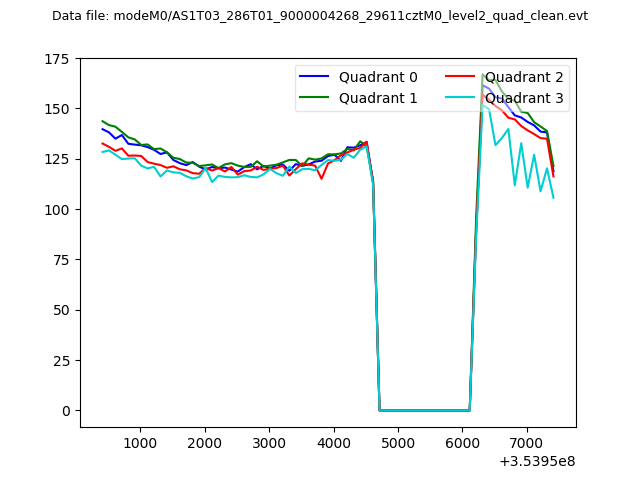 |
|
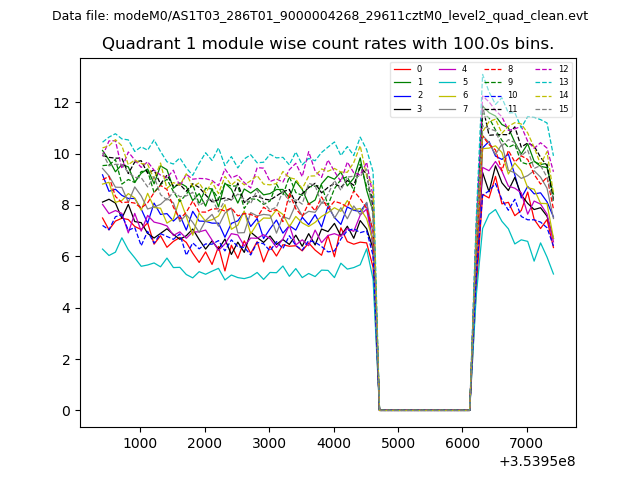
| Module-wise count rates for Quadrant A Data is divided into 100 sec bins |
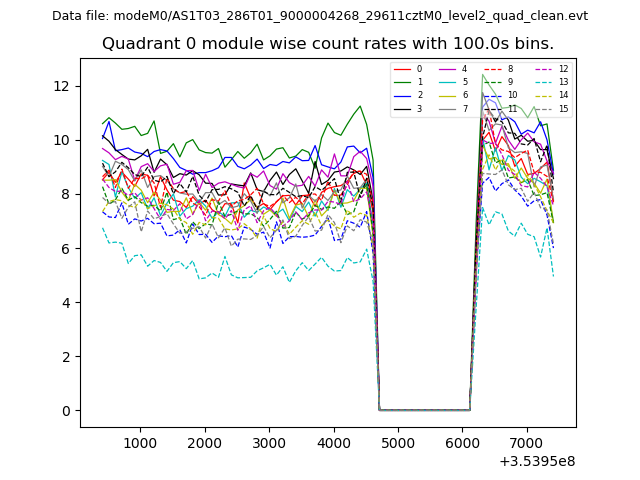 |
 |
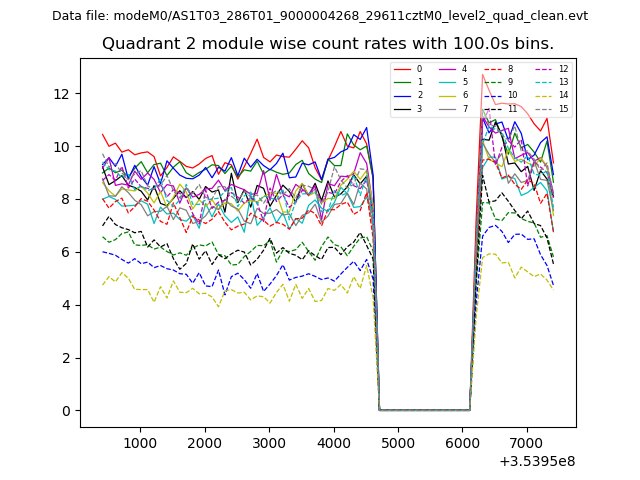
| Module-wise count rates for Quadrant B Data is divided into 100 sec bins |
 |
 |
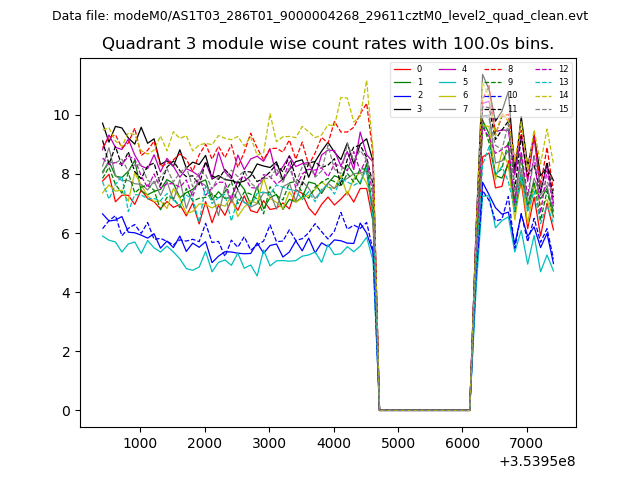
| Module-wise count rates for Quadrant C Data is divided into 100 sec bins |
 |
 |
| Module-wise count rates for Quadrant D Data is divided into 100 sec bins |
 |
 |
| Parameter | Plot |
|---|---|
| CZT HV Monitor | 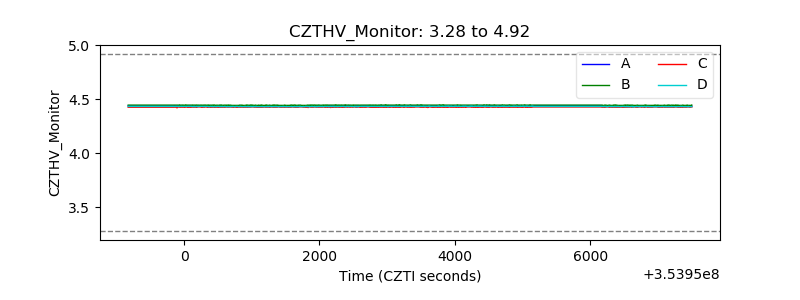 |
| D_VDD | 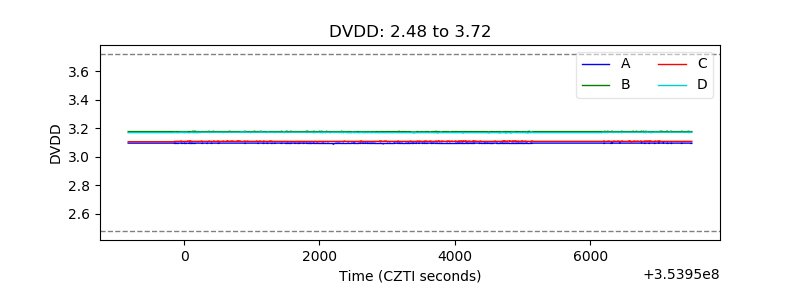 |
| Temperature 1 |  |
| Veto HV Monitor | 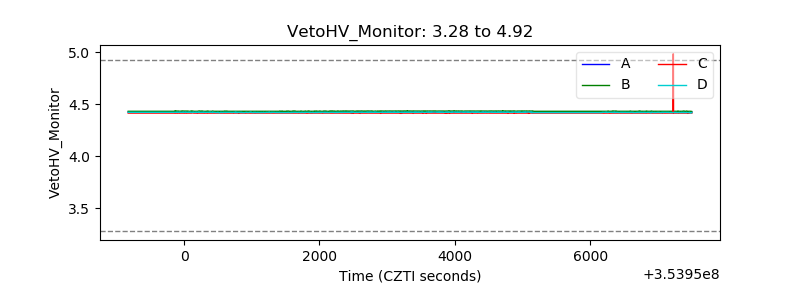 |
| Veto LLD | 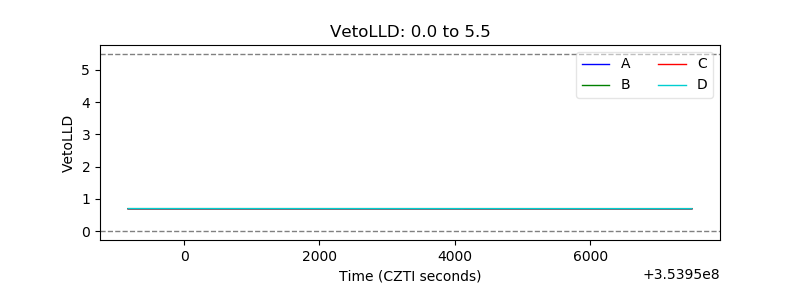 |
| Alpha Counter | 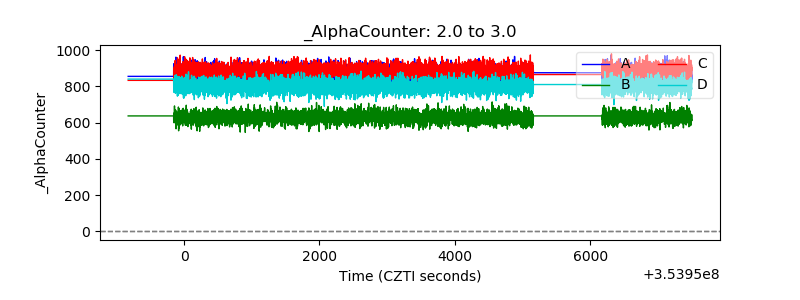 |
| _CPM_Rate | 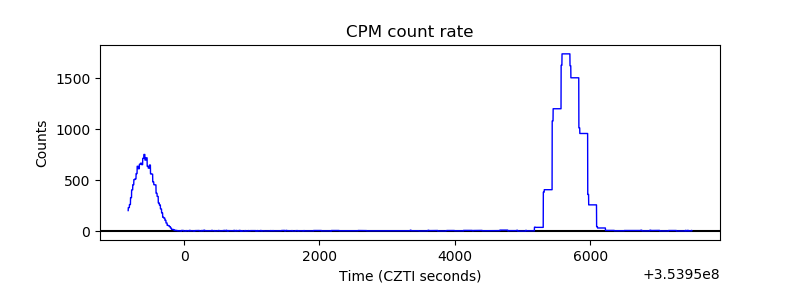 |
| CZT Counter | 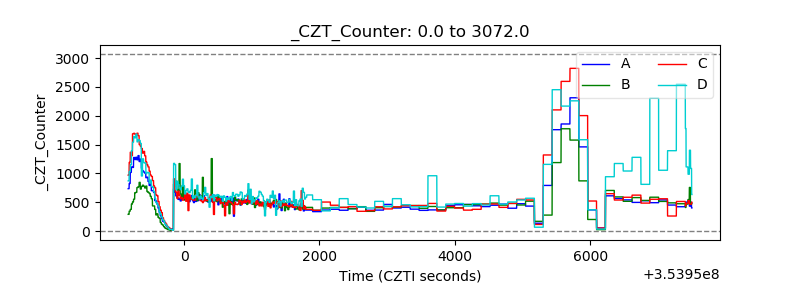 |
| +2.5 Volts monitor |  |
| +5 Volts monitor | 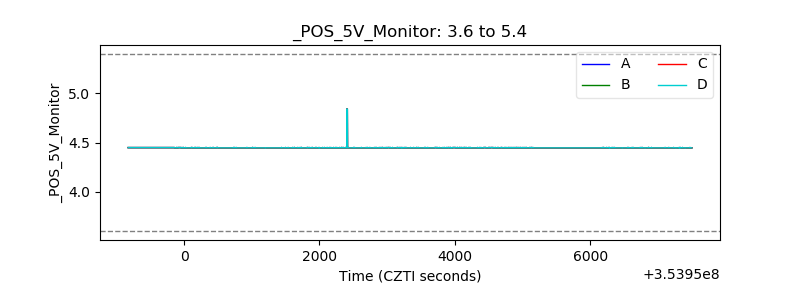 |
| _ROLL_ROT |  |
| _Roll_DEC |  |
| _Roll_RA | 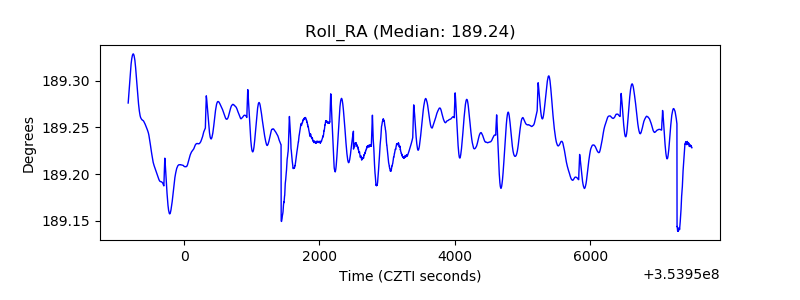 |
| Veto Counter | 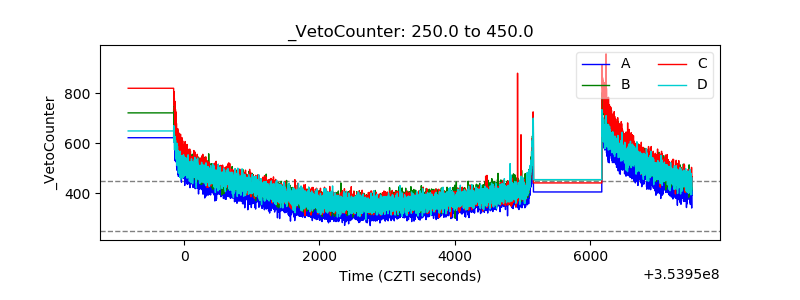 |