| Param | Original file | Final file |
|---|---|---|
| Filename | modeM0/AS1T03_286T01_9000004268_29616cztM0_level2.evt | modeM0/AS1T03_286T01_9000004268_29616cztM0_level2_quad_clean.evt |
| Size (bytes) | 463,314,240 | 104,742,720 |
| Size | 441.9 MB | 99.9 MB |
| Events in quadrant A | 2,973,547 | 684,711 |
| Events in quadrant B | 3,118,893 | 722,991 |
| Events in quadrant C | 3,153,625 | 693,342 |
| Events in quadrant D | 4,370,752 | 644,692 |
| Mode M9 | |||
|---|---|---|---|
| Quadrant | BADHDUFLAG | Total packets | Discarded packets |
| A | 0 | 24 | 0 |
| B | 0 | 25 | 0 |
| C | 0 | 25 | 0 |
| D | 0 | 25 | 0 |
| Mode SS | |||
|---|---|---|---|
| Quadrant | BADHDUFLAG | Total packets | Discarded packets |
| A | 0 | 124 | 0 |
| B | 0 | 124 | 0 |
| C | 0 | 124 | 0 |
| D | 0 | 124 | 0 |
| Mode M0 | |||
|---|---|---|---|
| Quadrant | BADHDUFLAG | Total packets | Discarded packets |
| A | 0 | 12767 | 3 |
| B | 0 | 13064 | 2 |
| C | 0 | 13168 | 2 |
| D | 0 | 17014 | 2 |
| Quadrant | Total seconds | Saturated seconds | Saturation percentage |
|---|---|---|---|
| A | 6109 | 18 | 0.294647% |
| B | 6109 | 27 | 0.441971% |
| C | 6109 | 77 | 1.260435% |
| D | 6109 | 145 | 2.373547% |
Noise dominated data is calculated using 1-second bins in cleaned event files. If a bin has >2000 counts, and if more than 50% of those come from <1% of pixels, then it is considered to be noise-dominated and hence unusable.
| Quadrant | # 1 sec bins | Bins with >0 counts | Bins with >2000 counts | High rate bins dominated by noise | Noise dominated (total time) | Noise dominated (detector-on time) | Marked lightcurve |
|---|---|---|---|---|---|---|---|
| A | 7484 | 6110 | 0 | 0 | 0.00% | 0.00% | 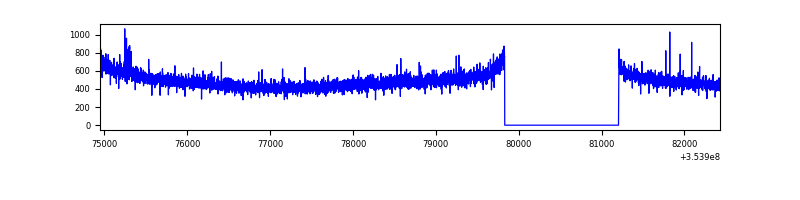 |
| B | 7484 | 6110 | 1 | 1 | 0.01% | 0.02% | 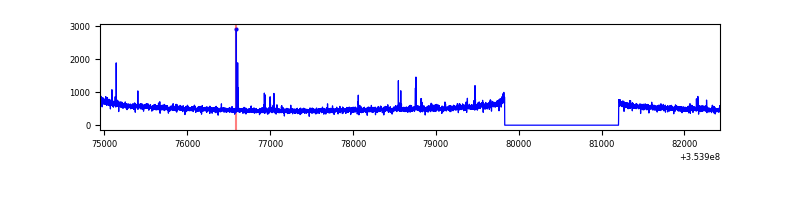 |
| C | 7484 | 6110 | 0 | 0 | 0.00% | 0.00% | 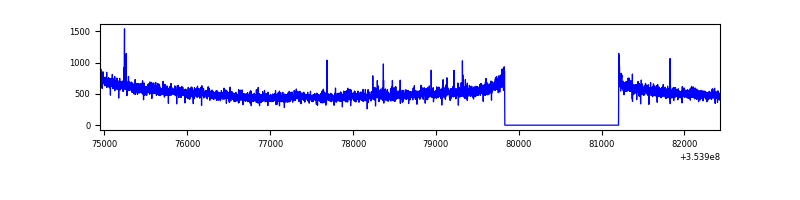 |
| D | 7484 | 6110 | 77 | 77 | 1.03% | 1.26% | 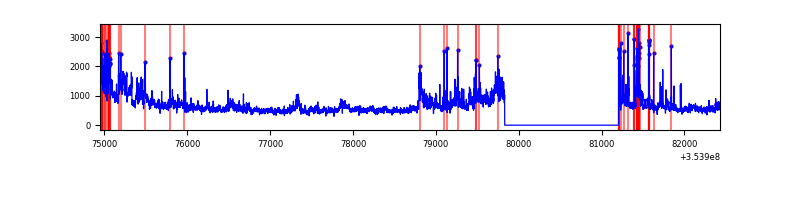 |
Top three noisy pixels from each quadrant. If the there are fewer than three noisy pixels in the level2.evt file, extra rows are filled as -1
| Pixel properties | Quadrant properties | ||||||
|---|---|---|---|---|---|---|---|
| Quadrant | DetID | PixID | Counts | Sigma | Mean | Median | Sigma |
| A | 0 | 13 | 13088 | 80.98 | 767 | 755 | 152.3 |
| A | 13 | 254 | 11030 | 67.47 | 767 | 755 | 152.3 |
| A | 3 | 137 | 7042 | 41.28 | 767 | 755 | 152.3 |
| B | 0 | 230 | 24340 | 162.71 | 783 | 765 | 144.9 |
| B | 12 | 111 | 16954 | 111.74 | 783 | 765 | 144.9 |
| B | 11 | 111 | 15374 | 100.83 | 783 | 765 | 144.9 |
| C | 14 | 238 | 124928 | 708.54 | 759 | 763 | 175.2 |
| C | 3 | 233 | 31785 | 177.02 | 759 | 763 | 175.2 |
| C | 10 | 22 | 18367 | 100.45 | 759 | 763 | 175.2 |
| D | 12 | 227 | 710704 | 4065.74 | 741 | 722 | 174.6 |
| D | 8 | 195 | 533689 | 3052.06 | 741 | 722 | 174.6 |
| D | 7 | 80 | 178841 | 1020.01 | 741 | 722 | 174.6 |
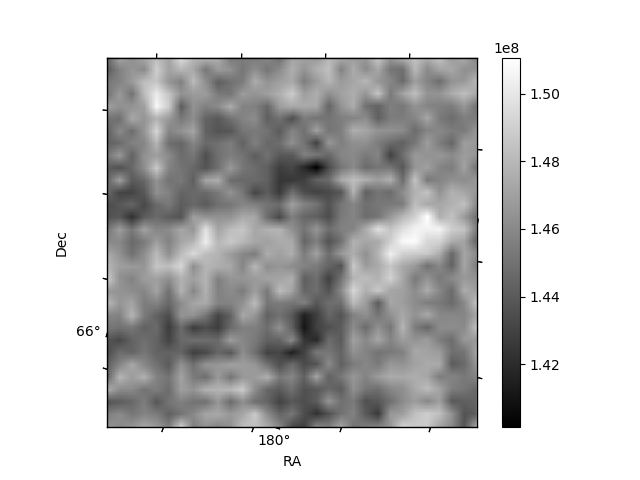
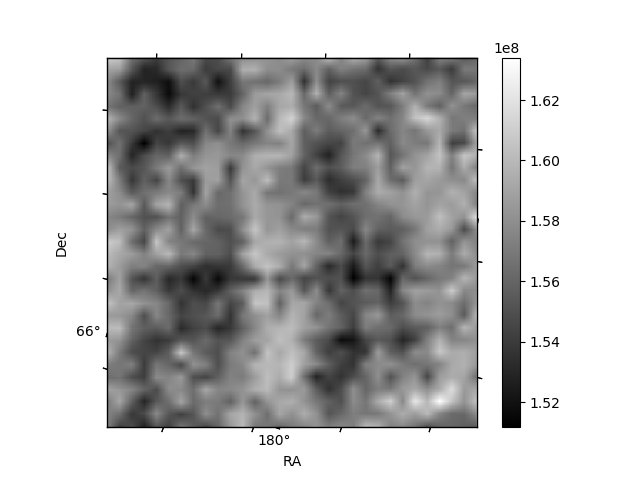
Histogram calculated using DETX and DETY for each event in the final _common_clean file
| Quadrant A |  |
 |
Quadrant B |
|---|---|---|---|
| Quadrant D |  |
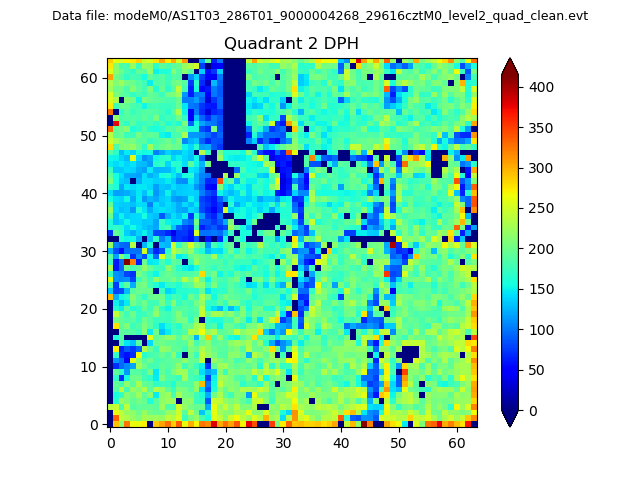 |
Quadrant C |
| Plot type | Count rate plots | Images |
|---|---|---|
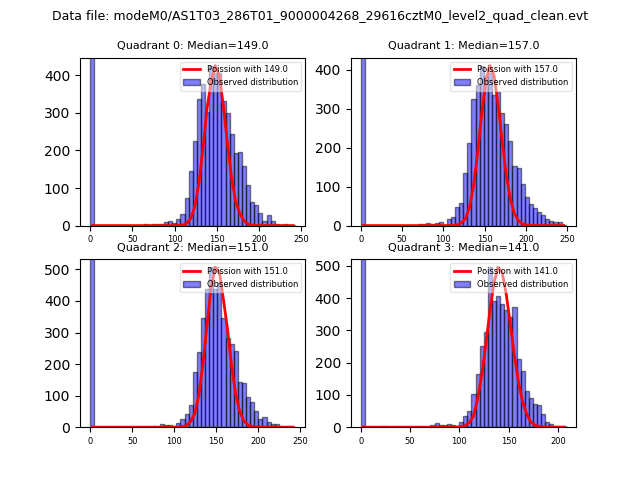
| Comparison with Poisson distribution Blue bars denote a histogram of data divided into 1 sec bins. Red curve is a Poisson curve with rate = median count rate of data. |
 |
 |
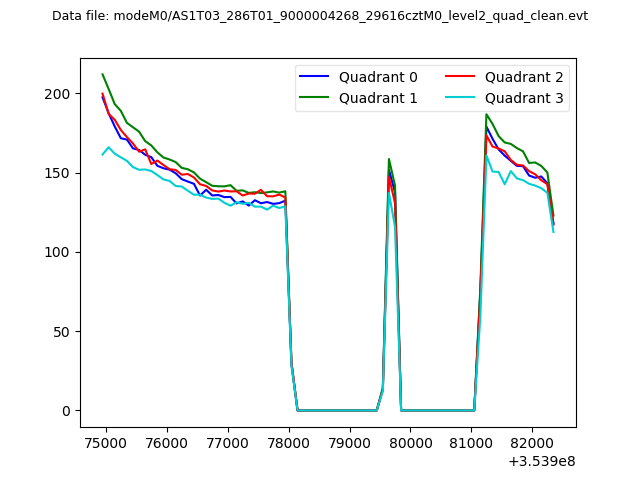
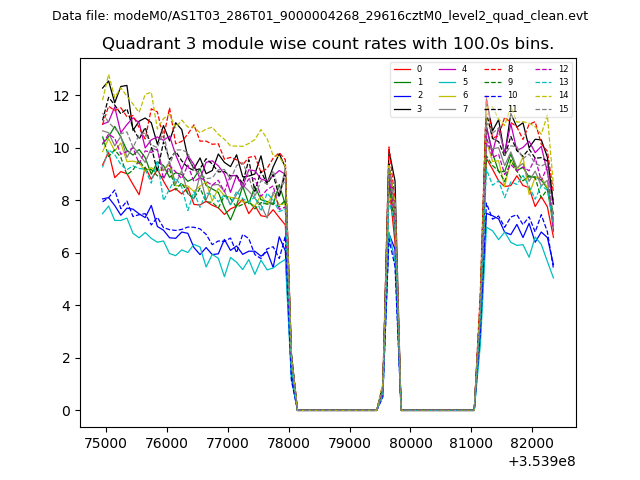
| Quadrant-wise count rates Data is divided into 100 sec bins |
 |
|
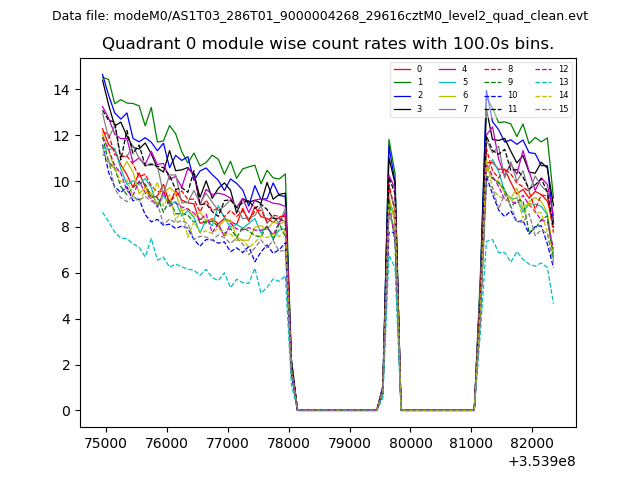
| Module-wise count rates for Quadrant A Data is divided into 100 sec bins |
 |
 |
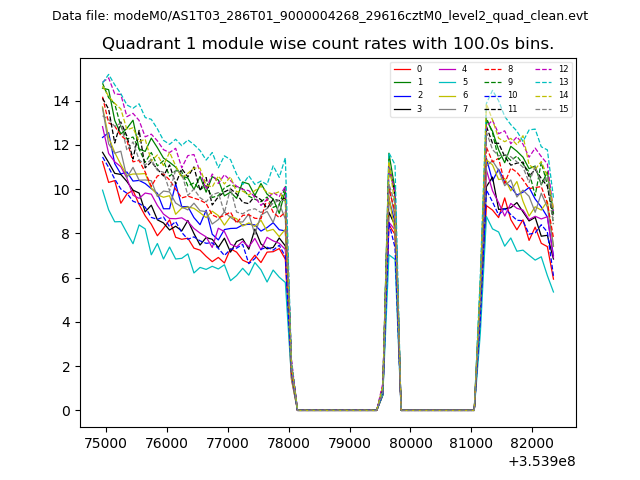
| Module-wise count rates for Quadrant B Data is divided into 100 sec bins |
 |
 |
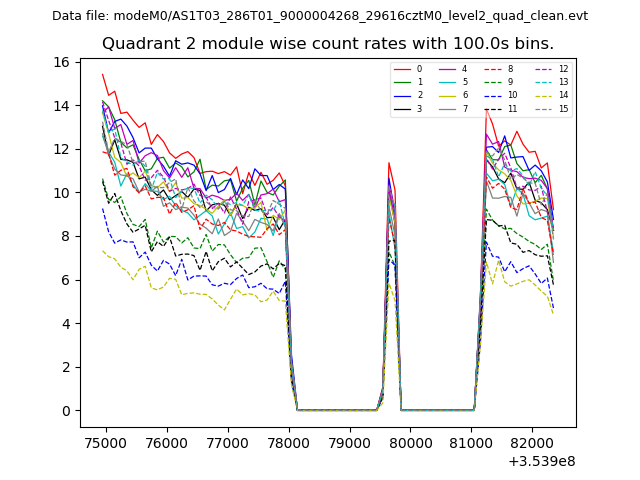
| Module-wise count rates for Quadrant C Data is divided into 100 sec bins |
 |
 |
| Module-wise count rates for Quadrant D Data is divided into 100 sec bins |
 |
 |
| Parameter | Plot |
|---|---|
| CZT HV Monitor | 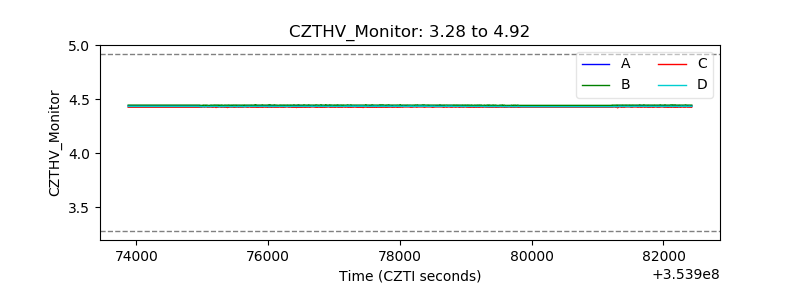 |
| D_VDD | 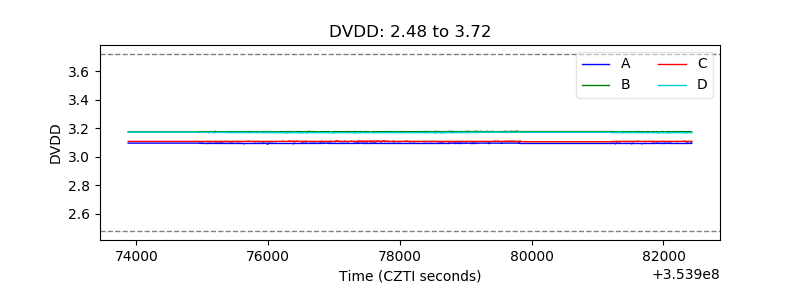 |
| Temperature 1 | 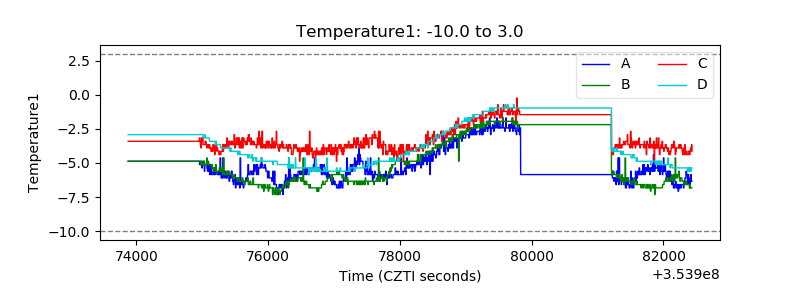 |
| Veto HV Monitor | 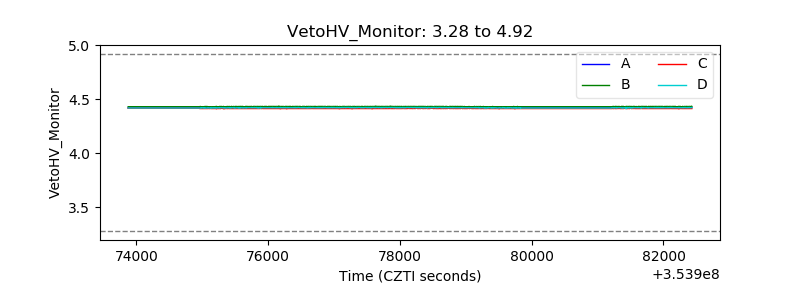 |
| Veto LLD | 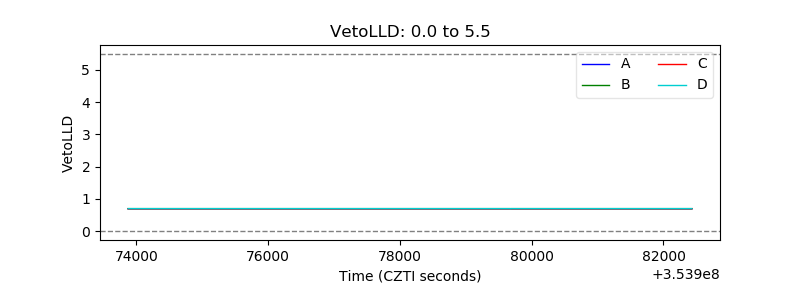 |
| Alpha Counter | 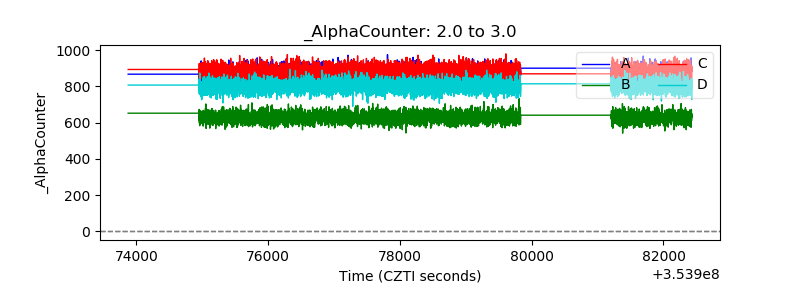 |
| _CPM_Rate | 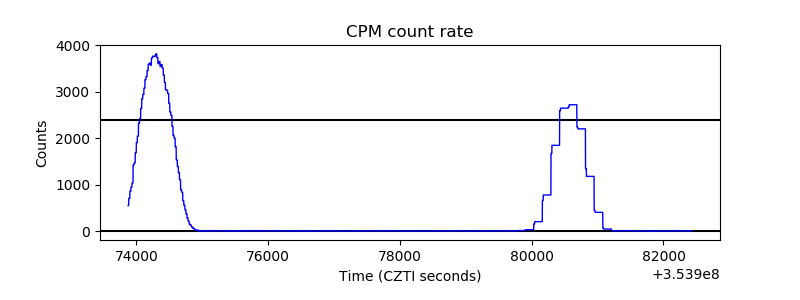 |
| CZT Counter |  |
| +2.5 Volts monitor | 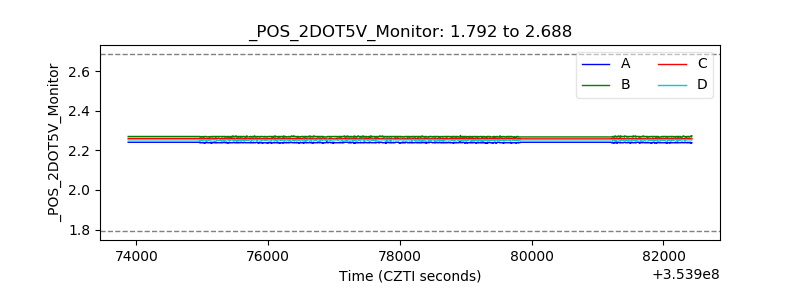 |
| +5 Volts monitor |  |
| _ROLL_ROT | 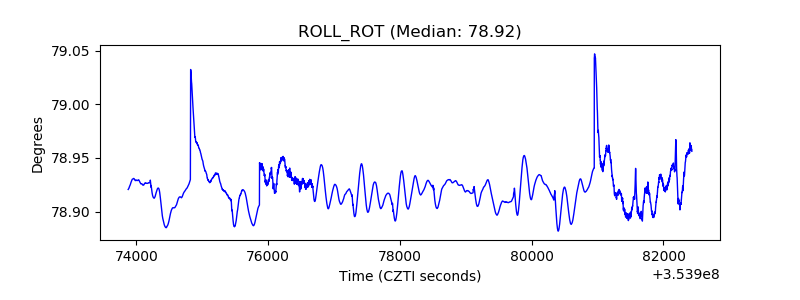 |
| _Roll_DEC | 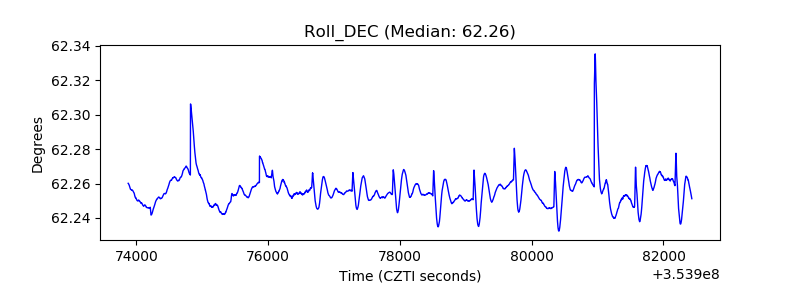 |
| _Roll_RA |  |
| Veto Counter | 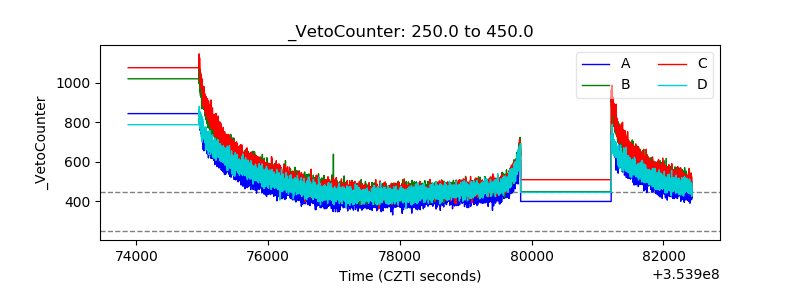 |