| Param | Original file | Final file |
|---|---|---|
| Filename | modeM0/AS1T03_286T01_9000004268_29618cztM0_level2.evt | modeM0/AS1T03_286T01_9000004268_29618cztM0_level2_quad_clean.evt |
| Size (bytes) | 743,650,560 | 162,711,360 |
| Size | 709.2 MB | 155.2 MB |
| Events in quadrant A | 5,042,828 | 1,049,608 |
| Events in quadrant B | 5,290,585 | 1,086,903 |
| Events in quadrant C | 5,325,601 | 1,039,833 |
| Events in quadrant D | 6,128,696 | 1,002,044 |
| Mode M9 | |||
|---|---|---|---|
| Quadrant | BADHDUFLAG | Total packets | Discarded packets |
| A | 0 | 23 | 0 |
| B | 0 | 23 | 0 |
| C | 0 | 23 | 0 |
| D | 0 | 23 | 0 |
| Mode SS | |||
|---|---|---|---|
| Quadrant | BADHDUFLAG | Total packets | Discarded packets |
| A | 0 | 220 | 0 |
| B | 0 | 220 | 0 |
| C | 0 | 220 | 0 |
| D | 0 | 220 | 0 |
| Mode M0 | |||
|---|---|---|---|
| Quadrant | BADHDUFLAG | Total packets | Discarded packets |
| A | 0 | 22238 | 2 |
| B | 0 | 22691 | 2 |
| C | 0 | 22766 | 2 |
| D | 0 | 25451 | 2 |
| Quadrant | Total seconds | Saturated seconds | Saturation percentage |
|---|---|---|---|
| A | 10831 | 65 | 0.600129% |
| B | 10832 | 141 | 1.301699% |
| C | 10832 | 179 | 1.652511% |
| D | 10832 | 89 | 0.821640% |
Noise dominated data is calculated using 1-second bins in cleaned event files. If a bin has >2000 counts, and if more than 50% of those come from <1% of pixels, then it is considered to be noise-dominated and hence unusable.
| Quadrant | # 1 sec bins | Bins with >0 counts | Bins with >2000 counts | High rate bins dominated by noise | Noise dominated (total time) | Noise dominated (detector-on time) | Marked lightcurve |
|---|---|---|---|---|---|---|---|
| A | 13041 | 10833 | 0 | 0 | 0.00% | 0.00% | 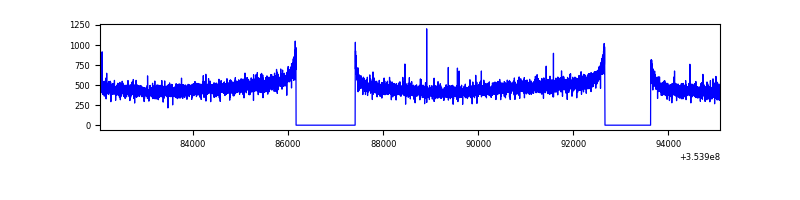 |
| B | 13042 | 10833 | 8 | 8 | 0.06% | 0.07% | 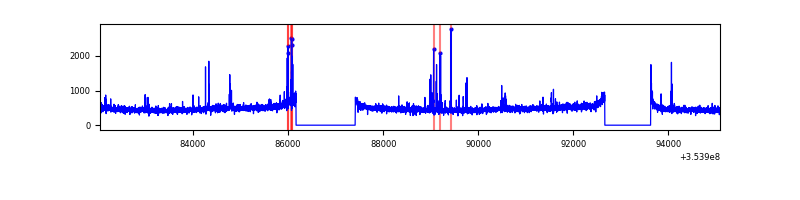 |
| C | 13042 | 10834 | 2 | 2 | 0.02% | 0.02% | 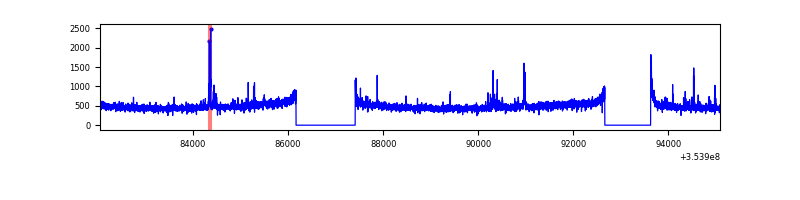 |
| D | 13042 | 10834 | 34 | 34 | 0.26% | 0.31% | 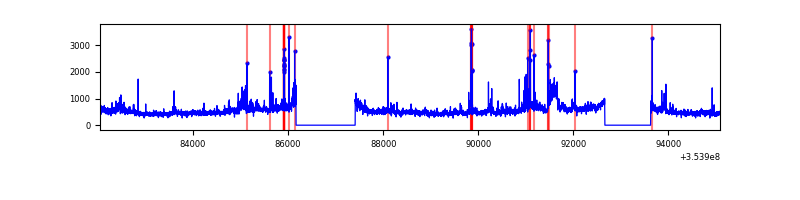 |
Top three noisy pixels from each quadrant. If the there are fewer than three noisy pixels in the level2.evt file, extra rows are filled as -1
| Pixel properties | Quadrant properties | ||||||
|---|---|---|---|---|---|---|---|
| Quadrant | DetID | PixID | Counts | Sigma | Mean | Median | Sigma |
| A | 13 | 254 | 18993 | 68.11 | 1304 | 1279 | 260.1 |
| A | 3 | 137 | 12753 | 44.12 | 1304 | 1279 | 260.1 |
| A | 1 | 113 | 10948 | 37.18 | 1304 | 1279 | 260.1 |
| B | 15 | 33 | 73512 | 293.35 | 1309 | 1275 | 246.3 |
| B | 0 | 229 | 51788 | 205.13 | 1309 | 1275 | 246.3 |
| B | 12 | 111 | 30302 | 117.88 | 1309 | 1275 | 246.3 |
| C | 14 | 238 | 210944 | 722.55 | 1260 | 1266 | 290.2 |
| C | 10 | 22 | 68165 | 230.53 | 1260 | 1266 | 290.2 |
| C | 3 | 233 | 63169 | 213.32 | 1260 | 1266 | 290.2 |
| D | 8 | 195 | 882859 | 3051.22 | 1250 | 1221 | 288.9 |
| D | 13 | 104 | 135167 | 463.57 | 1250 | 1221 | 288.9 |
| D | 12 | 227 | 111022 | 380.01 | 1250 | 1221 | 288.9 |
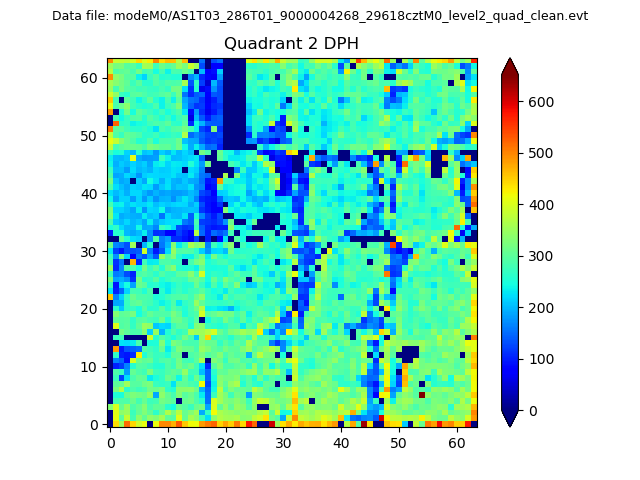
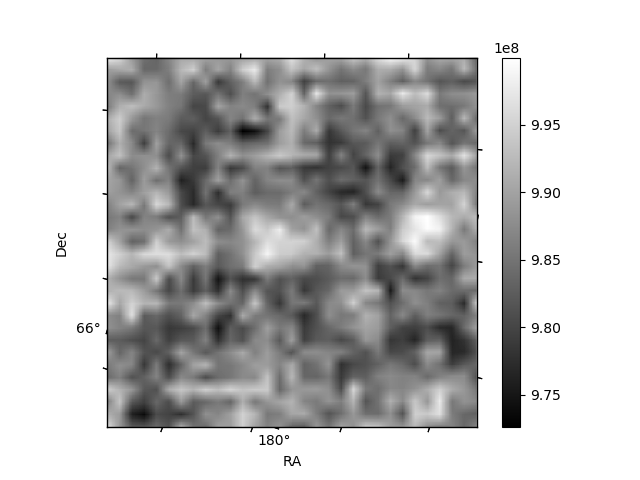
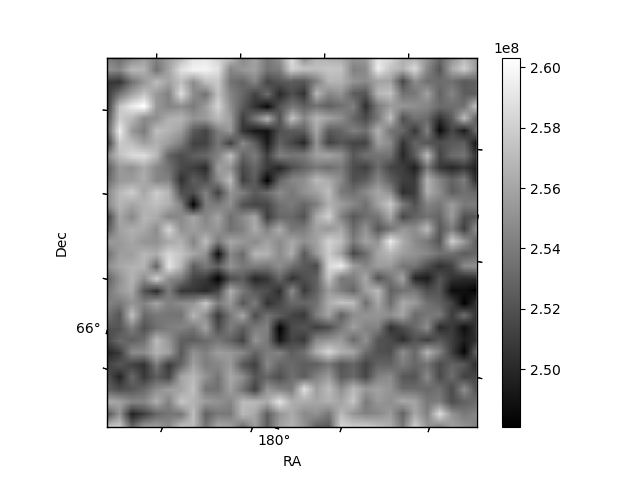
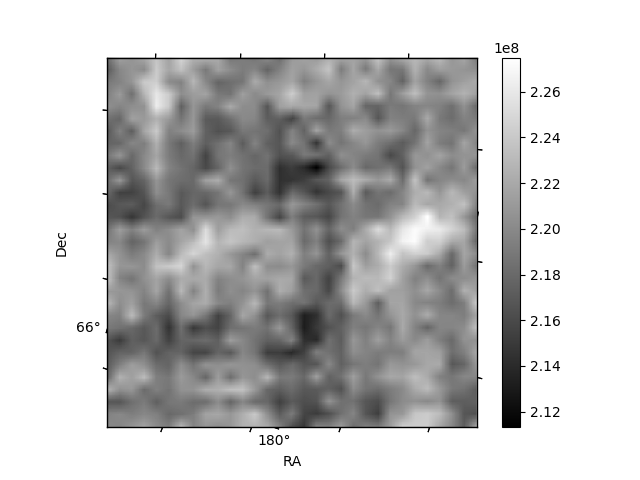
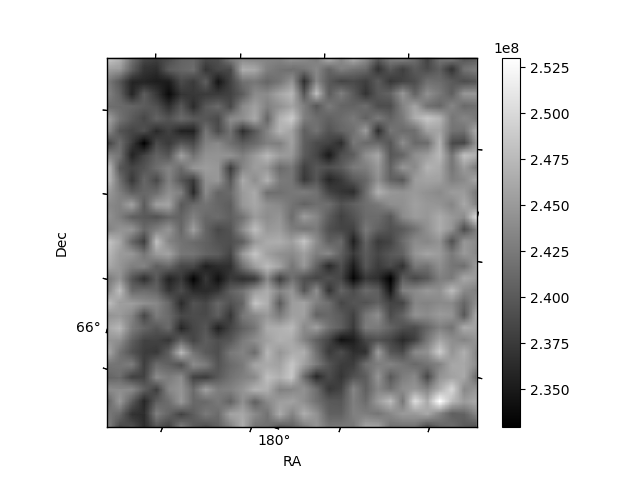
Histogram calculated using DETX and DETY for each event in the final _common_clean file
| Quadrant A | 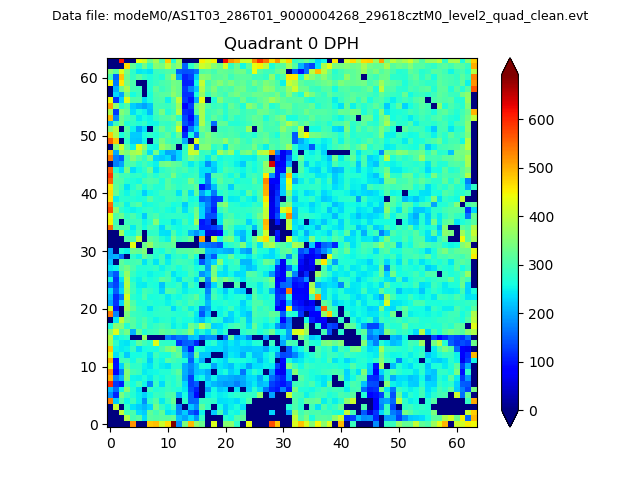 |
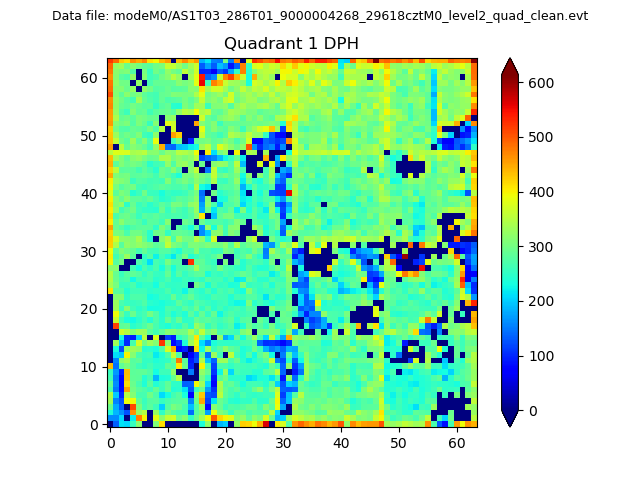 |
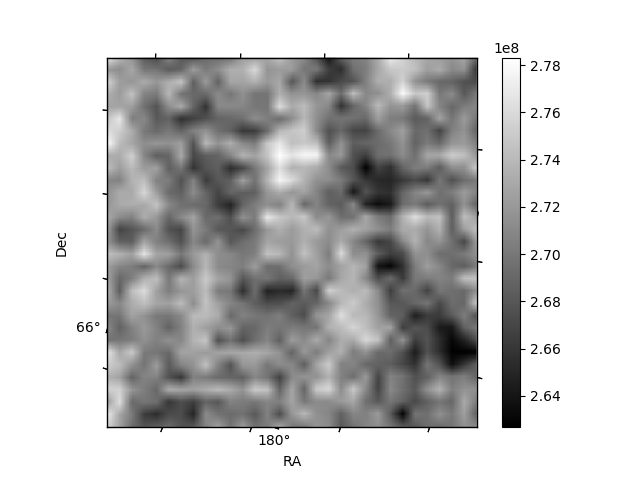
Quadrant B |
|---|---|---|---|
| Quadrant D | 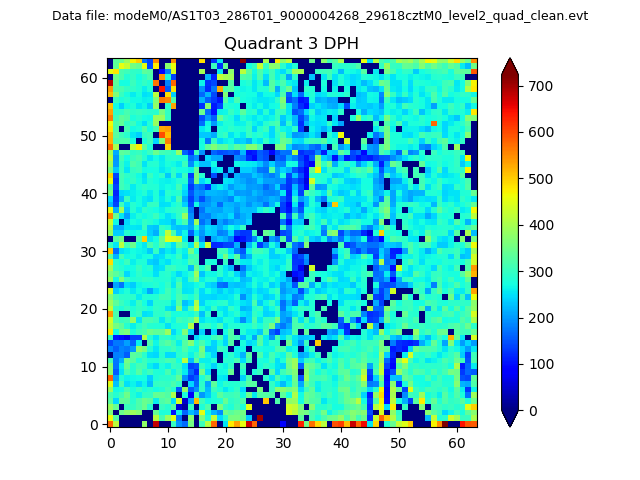 |
 |
Quadrant C |
| Plot type | Count rate plots | Images |
|---|---|---|
| Comparison with Poisson distribution Blue bars denote a histogram of data divided into 1 sec bins. Red curve is a Poisson curve with rate = median count rate of data. |
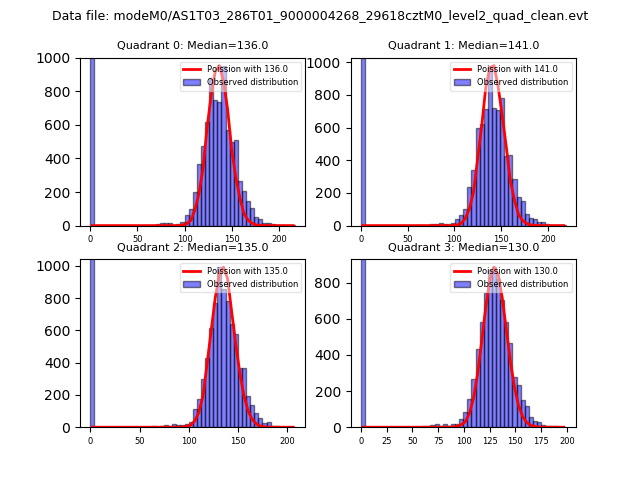 |
 |
| Quadrant-wise count rates Data is divided into 100 sec bins |
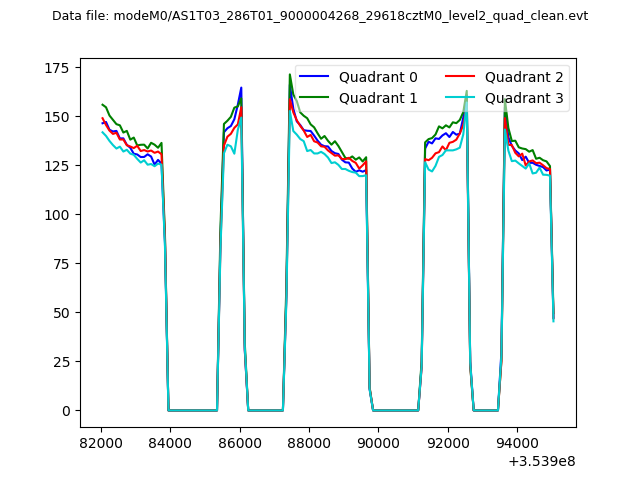 |
|
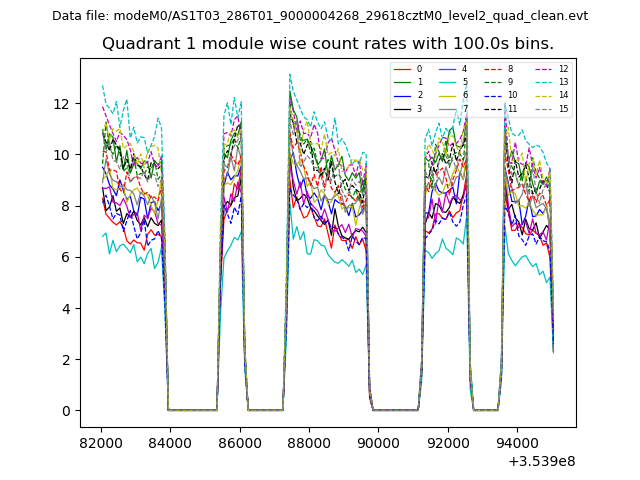
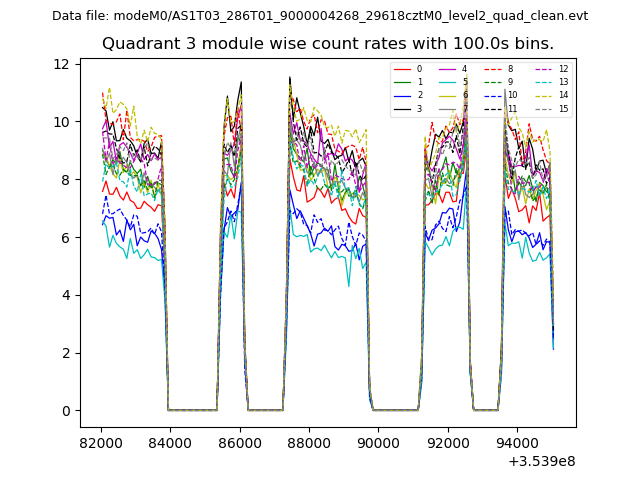
| Module-wise count rates for Quadrant A Data is divided into 100 sec bins |
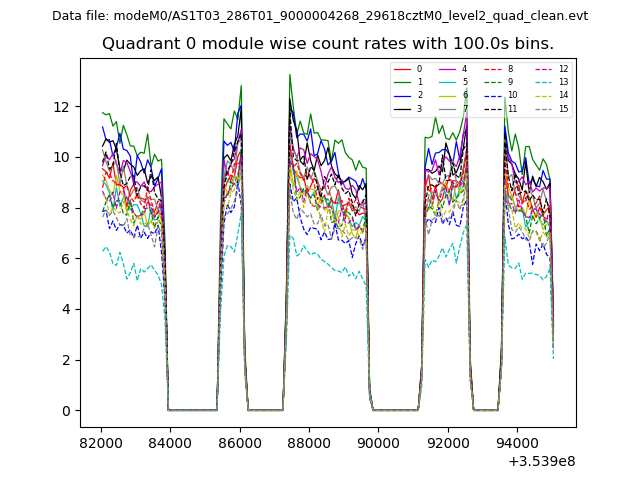 |
 |
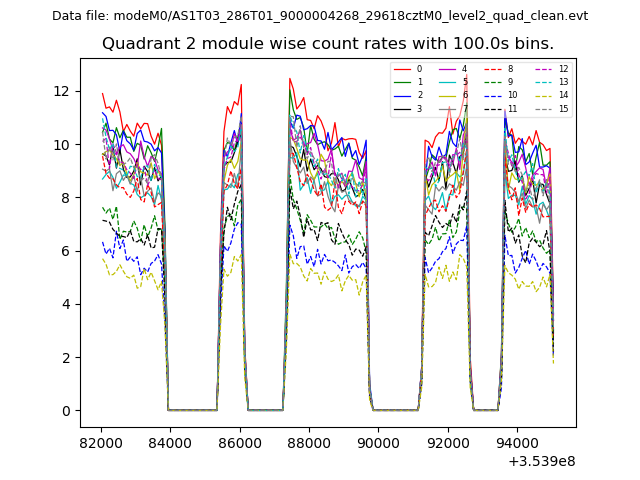
| Module-wise count rates for Quadrant B Data is divided into 100 sec bins |
 |
 |
| Module-wise count rates for Quadrant C Data is divided into 100 sec bins |
 |
 |
| Module-wise count rates for Quadrant D Data is divided into 100 sec bins |
 |
 |
| Parameter | Plot |
|---|---|
| CZT HV Monitor | 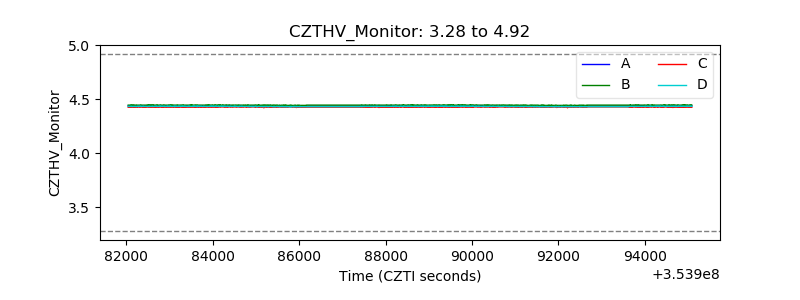 |
| D_VDD |  |
| Temperature 1 | 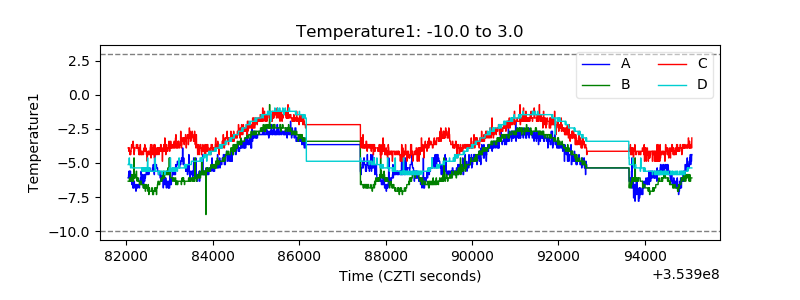 |
| Veto HV Monitor | 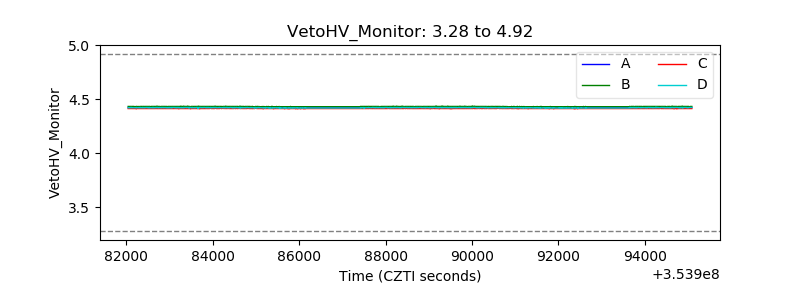 |
| Veto LLD |  |
| Alpha Counter | 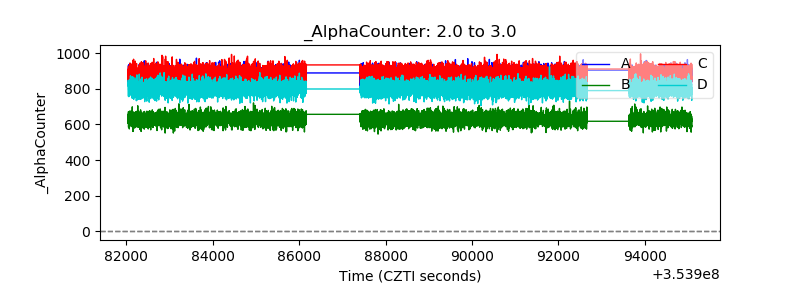 |
| _CPM_Rate | 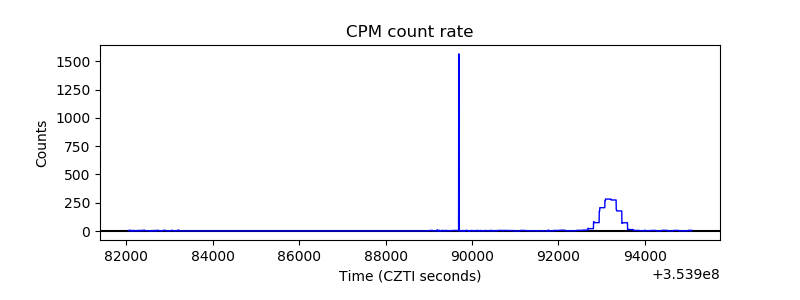 |
| CZT Counter | 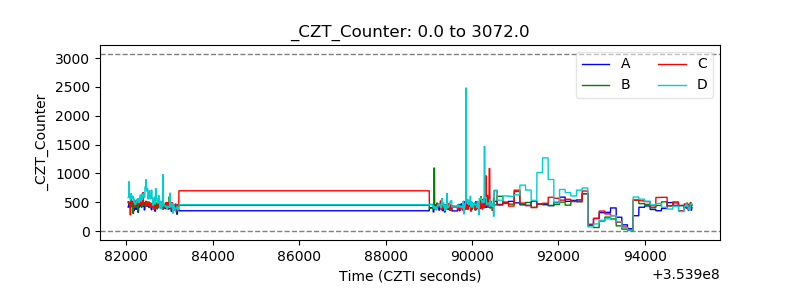 |
| +2.5 Volts monitor | 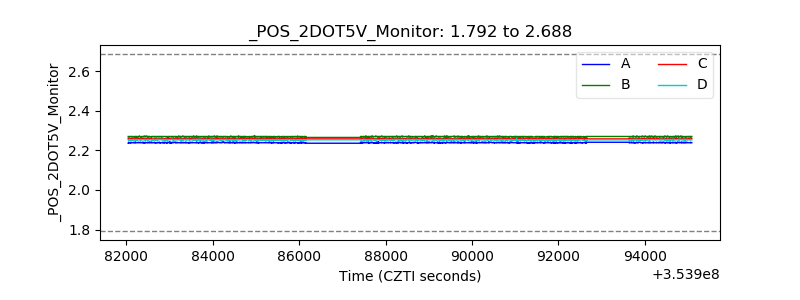 |
| +5 Volts monitor |  |
| _ROLL_ROT |  |
| _Roll_DEC | 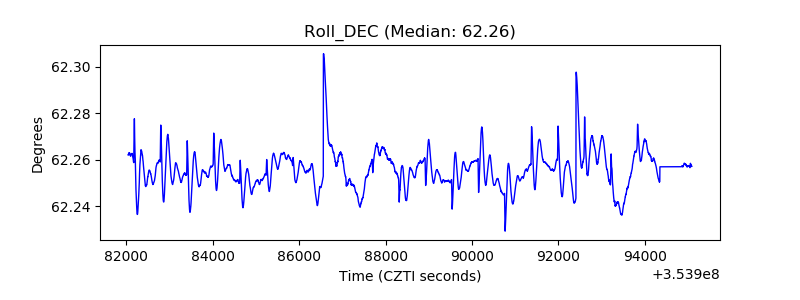 |
| _Roll_RA | 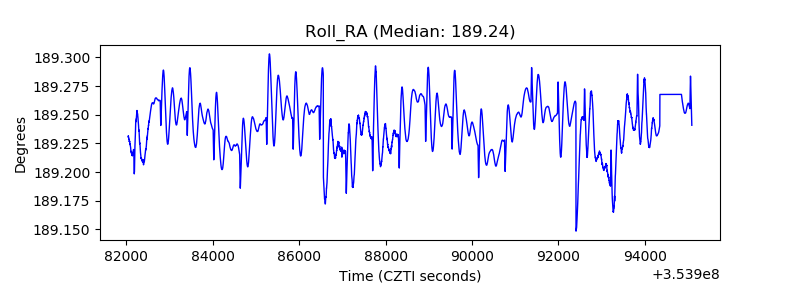 |
| Veto Counter | 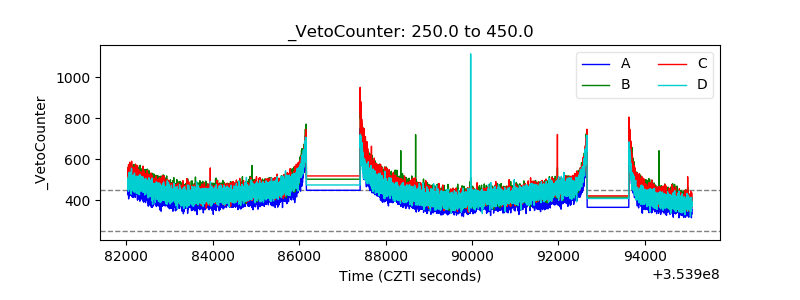 |