| Param | Original file | Final file |
|---|---|---|
| Filename | modeM0/AS1T03_286T01_9000004268_29619cztM0_level2.evt | modeM0/AS1T03_286T01_9000004268_29619cztM0_level2_quad_clean.evt |
| Size (bytes) | 478,365,120 | 112,605,120 |
| Size | 456.2 MB | 107.4 MB |
| Events in quadrant A | 3,322,747 | 729,588 |
| Events in quadrant B | 3,408,754 | 750,155 |
| Events in quadrant C | 3,486,927 | 720,658 |
| Events in quadrant D | 3,772,253 | 701,538 |
| Mode M9 | |||
|---|---|---|---|
| Quadrant | BADHDUFLAG | Total packets | Discarded packets |
| A | 0 | 9 | 0 |
| B | 0 | 10 | 0 |
| C | 0 | 10 | 0 |
| D | 0 | 10 | 0 |
| Mode SS | |||
|---|---|---|---|
| Quadrant | BADHDUFLAG | Total packets | Discarded packets |
| A | 0 | 148 | 0 |
| B | 0 | 148 | 0 |
| C | 0 | 148 | 0 |
| D | 0 | 148 | 0 |
| Mode M0 | |||
|---|---|---|---|
| Quadrant | BADHDUFLAG | Total packets | Discarded packets |
| A | 0 | 14918 | 2 |
| B | 0 | 14982 | 2 |
| C | 0 | 15203 | 2 |
| D | 0 | 16129 | 2 |
| Quadrant | Total seconds | Saturated seconds | Saturation percentage |
|---|---|---|---|
| A | 7306 | 67 | 0.917054% |
| B | 7306 | 110 | 1.505612% |
| C | 7306 | 117 | 1.601423% |
| D | 7306 | 36 | 0.492746% |
Noise dominated data is calculated using 1-second bins in cleaned event files. If a bin has >2000 counts, and if more than 50% of those come from <1% of pixels, then it is considered to be noise-dominated and hence unusable.
| Quadrant | # 1 sec bins | Bins with >0 counts | Bins with >2000 counts | High rate bins dominated by noise | Noise dominated (total time) | Noise dominated (detector-on time) | Marked lightcurve |
|---|---|---|---|---|---|---|---|
| A | 7906 | 7308 | 0 | 0 | 0.00% | 0.00% | 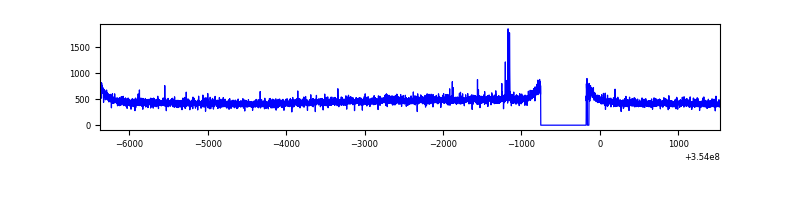 |
| B | 7906 | 7308 | 0 | 0 | 0.00% | 0.00% | 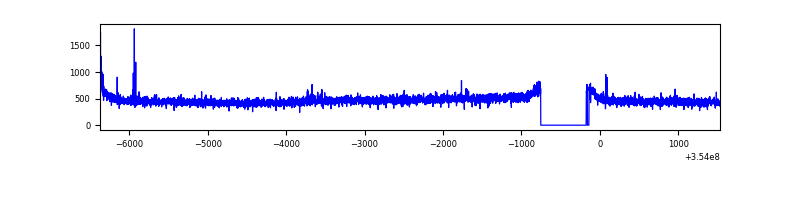 |
| C | 7906 | 7307 | 6 | 6 | 0.08% | 0.08% | 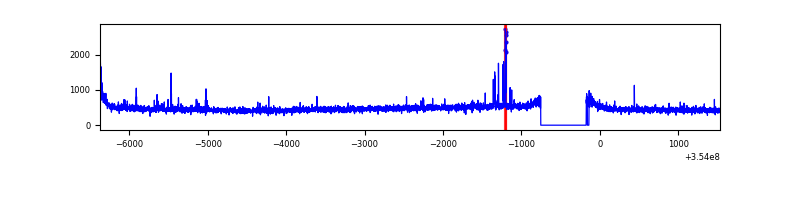 |
| D | 7906 | 7308 | 8 | 8 | 0.10% | 0.11% | 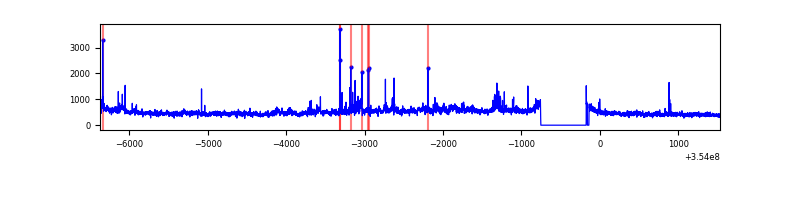 |
Top three noisy pixels from each quadrant. If the there are fewer than three noisy pixels in the level2.evt file, extra rows are filled as -1
| Pixel properties | Quadrant properties | ||||||
|---|---|---|---|---|---|---|---|
| Quadrant | DetID | PixID | Counts | Sigma | Mean | Median | Sigma |
| A | 0 | 13 | 21592 | 120.3 | 855 | 835 | 172.5 |
| A | 13 | 254 | 12579 | 68.07 | 855 | 835 | 172.5 |
| A | 3 | 137 | 8718 | 45.69 | 855 | 835 | 172.5 |
| B | 15 | 33 | 22163 | 131.33 | 858 | 835 | 162.4 |
| B | 12 | 111 | 20965 | 123.95 | 858 | 835 | 162.4 |
| B | 11 | 111 | 18535 | 108.99 | 858 | 835 | 162.4 |
| C | 14 | 238 | 143083 | 741.96 | 827 | 832 | 191.7 |
| C | 10 | 22 | 41319 | 211.17 | 827 | 832 | 191.7 |
| C | 3 | 233 | 31094 | 157.84 | 827 | 832 | 191.7 |
| D | 8 | 195 | 407155 | 2061.85 | 827 | 806 | 197.1 |
| D | 12 | 227 | 96676 | 486.45 | 827 | 806 | 197.1 |
| D | 2 | 250 | 69957 | 350.88 | 827 | 806 | 197.1 |
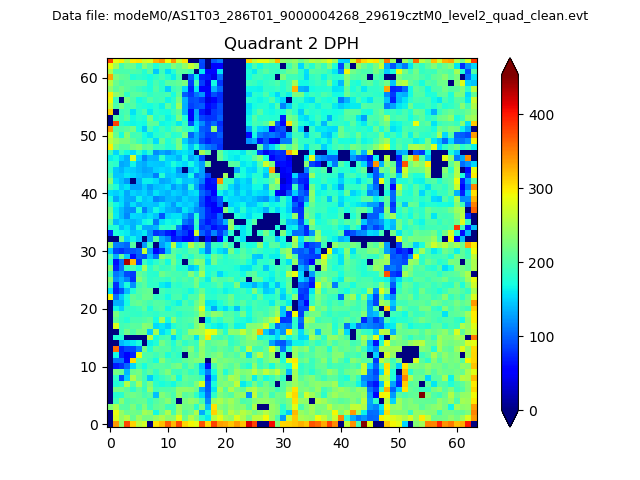
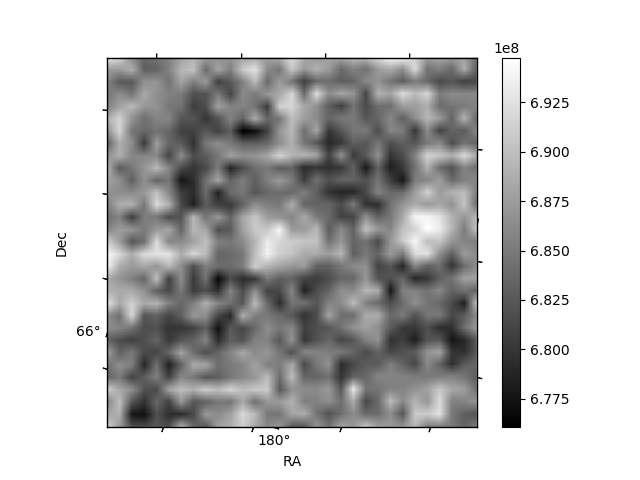
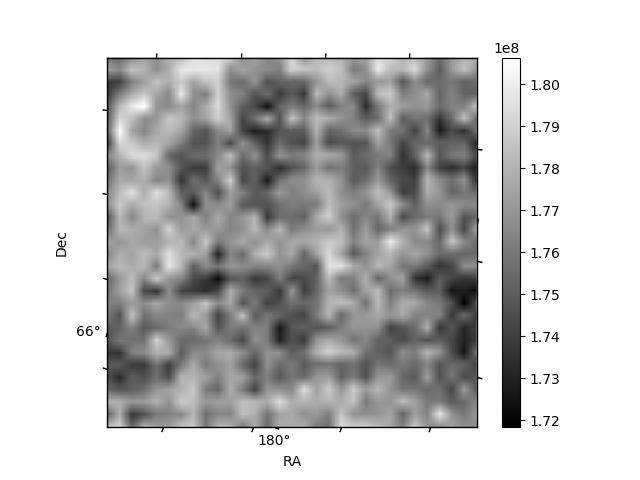
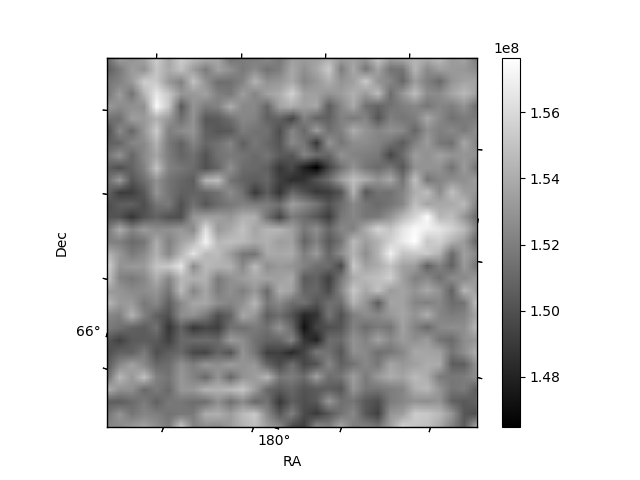
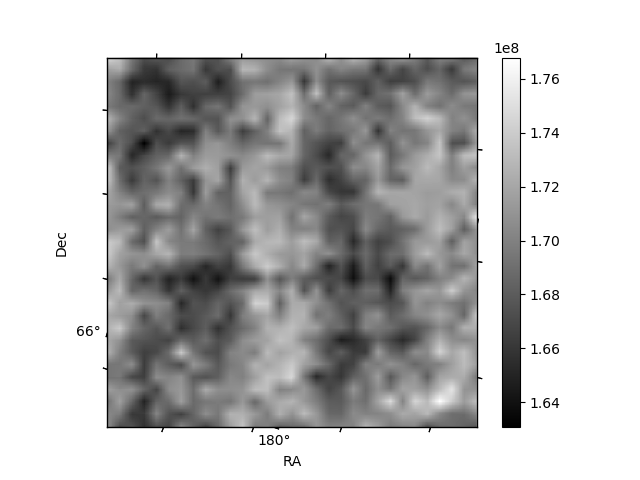
Histogram calculated using DETX and DETY for each event in the final _common_clean file
| Quadrant A | 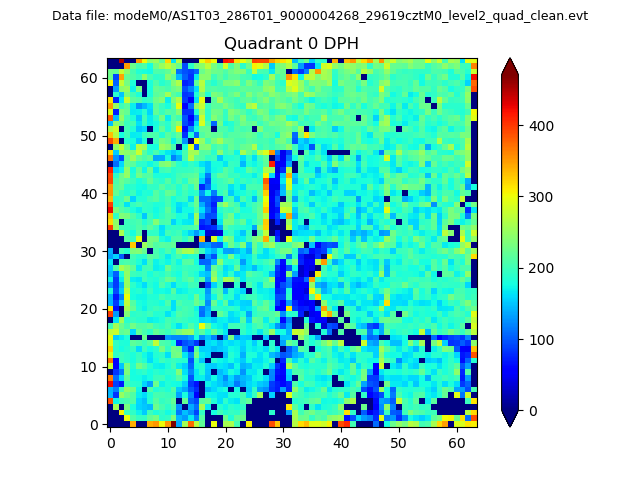 |
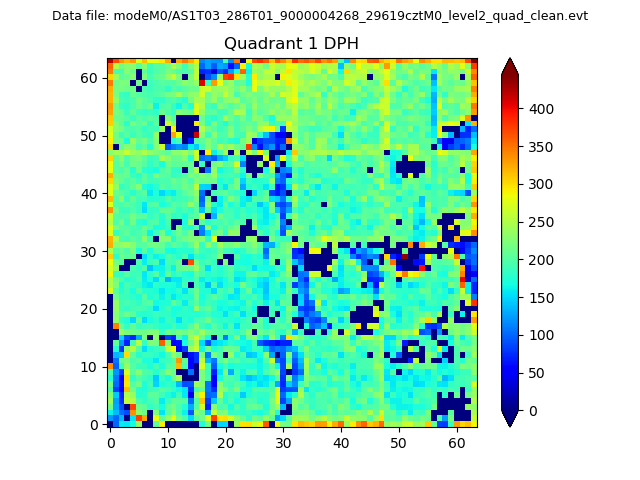 |
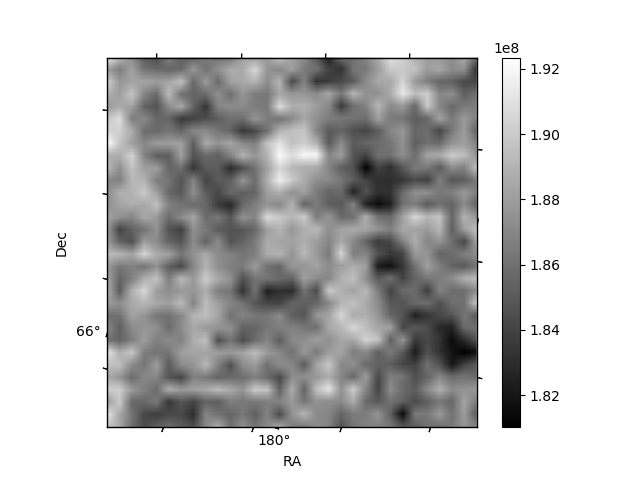
Quadrant B |
|---|---|---|---|
| Quadrant D | 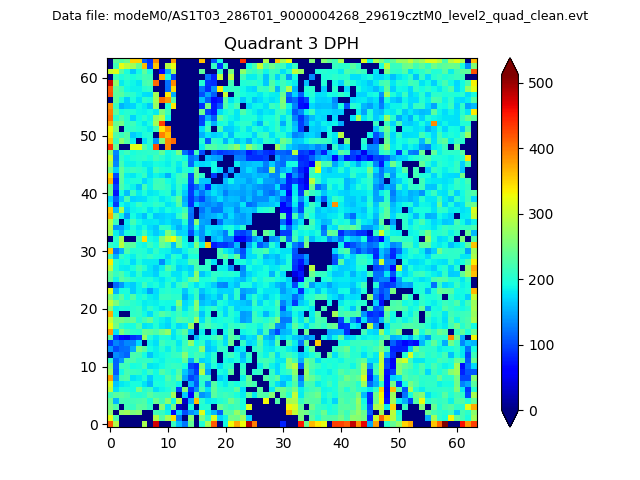 |
 |
Quadrant C |
| Plot type | Count rate plots | Images |
|---|---|---|
| Comparison with Poisson distribution Blue bars denote a histogram of data divided into 1 sec bins. Red curve is a Poisson curve with rate = median count rate of data. |
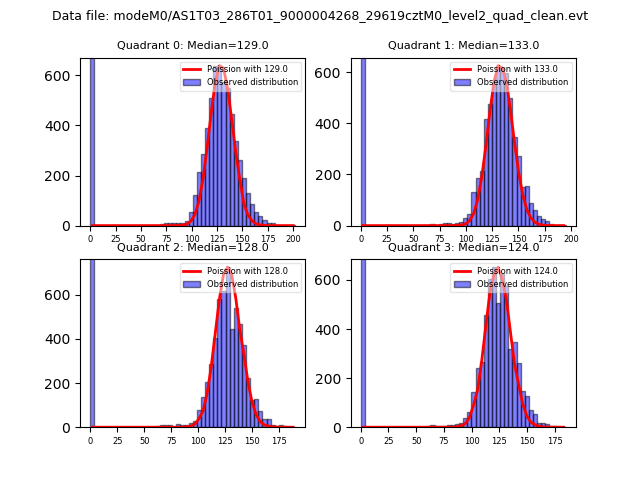 |
 |
| Quadrant-wise count rates Data is divided into 100 sec bins |
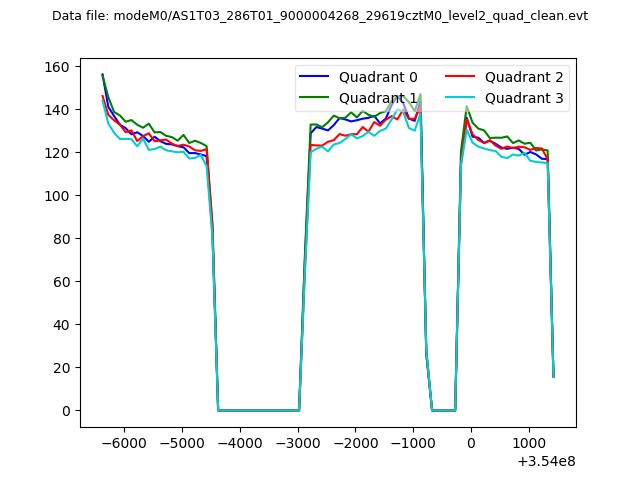 |
|
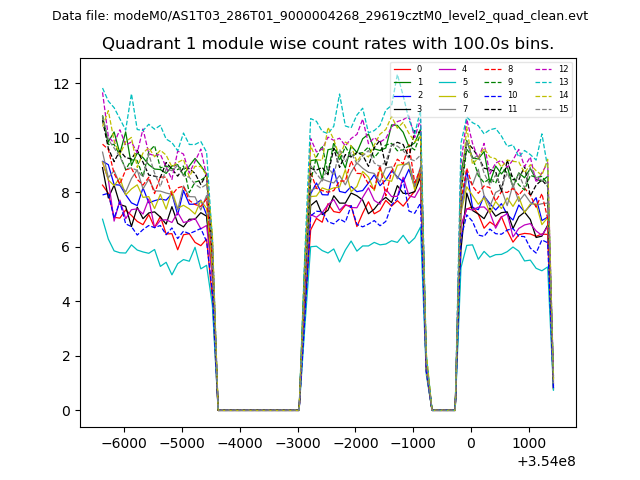
| Module-wise count rates for Quadrant A Data is divided into 100 sec bins |
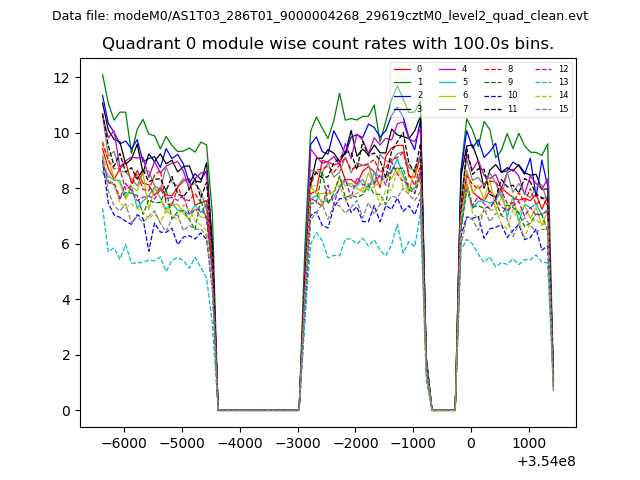 |
 |
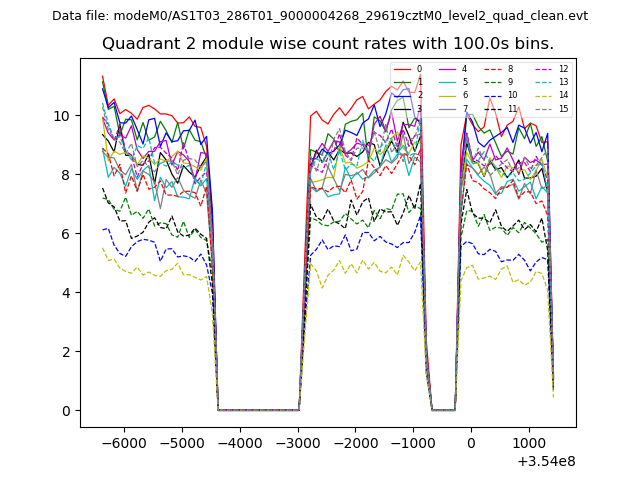
| Module-wise count rates for Quadrant B Data is divided into 100 sec bins |
 |
 |
| Module-wise count rates for Quadrant C Data is divided into 100 sec bins |
 |
 |
| Module-wise count rates for Quadrant D Data is divided into 100 sec bins |
 |
 |
| Parameter | Plot |
|---|---|
| CZT HV Monitor | 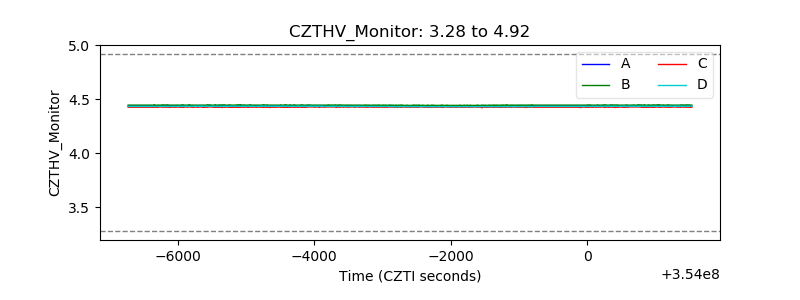 |
| D_VDD | 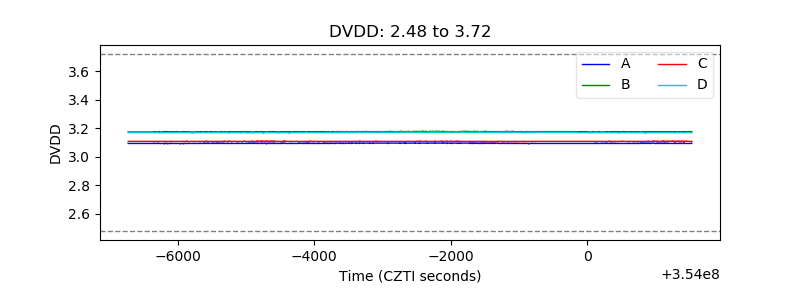 |
| Temperature 1 | 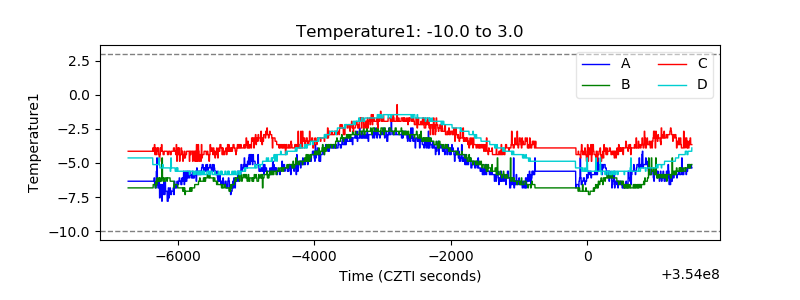 |
| Veto HV Monitor | 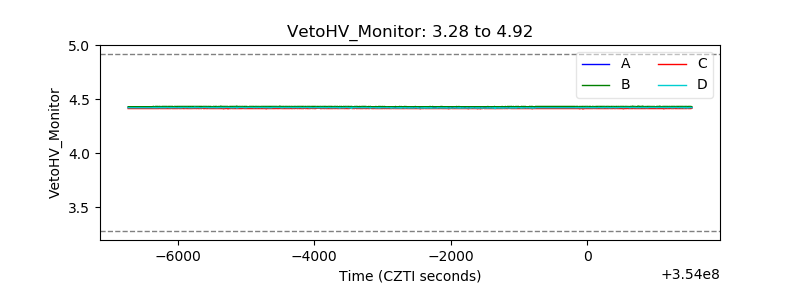 |
| Veto LLD |  |
| Alpha Counter | 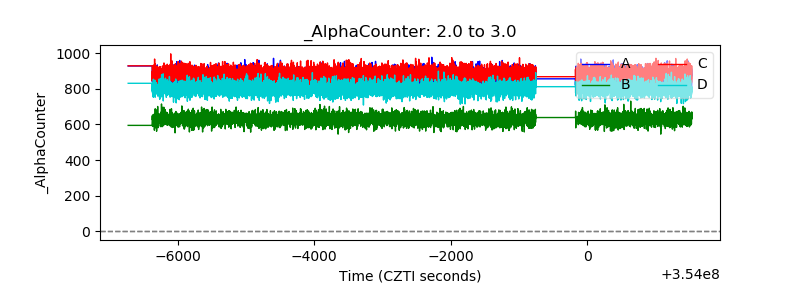 |
| _CPM_Rate | 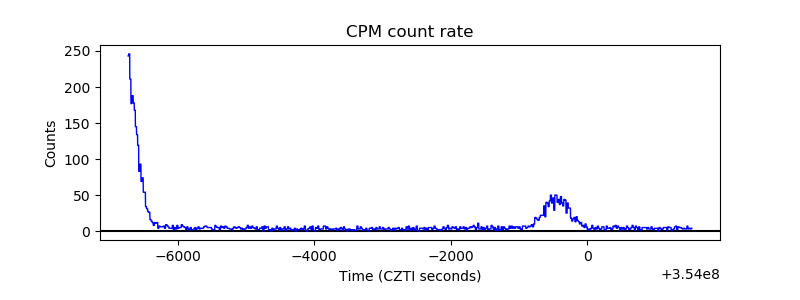 |
| CZT Counter | 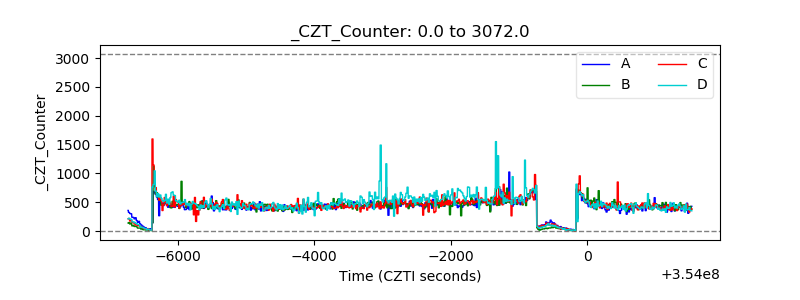 |
| +2.5 Volts monitor |  |
| +5 Volts monitor |  |
| _ROLL_ROT | 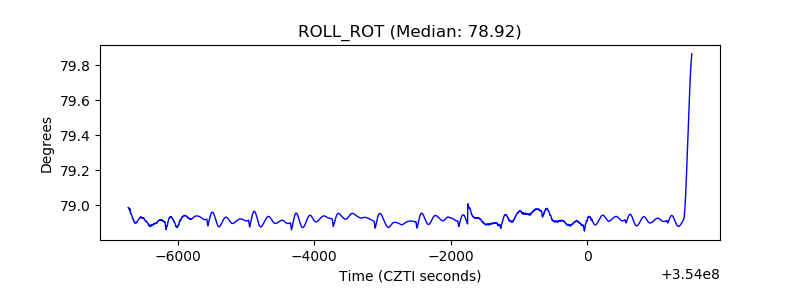 |
| _Roll_DEC | 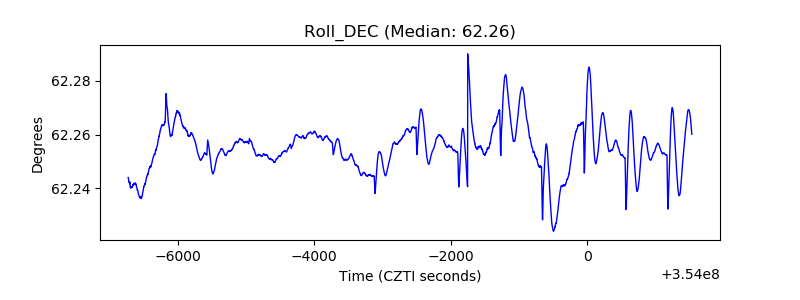 |
| _Roll_RA | 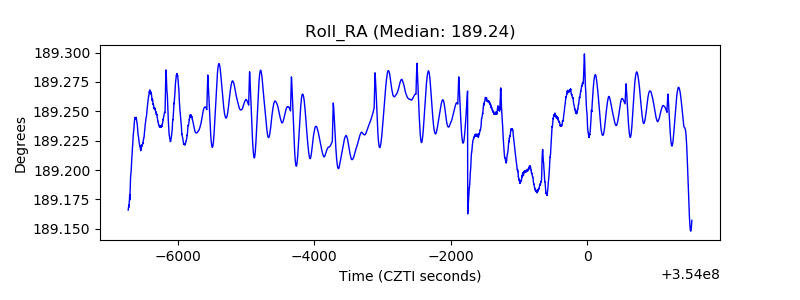 |
| Veto Counter |  |