| Param | Original file | Final file |
|---|---|---|
| Filename | modeM0/AS1T03_286T01_9000004268_29620cztM0_level2.evt | modeM0/AS1T03_286T01_9000004268_29620cztM0_level2_quad_clean.evt |
| Size (bytes) | 458,282,880 | 100,149,120 |
| Size | 437.1 MB | 95.5 MB |
| Events in quadrant A | 3,231,346 | 638,539 |
| Events in quadrant B | 3,321,931 | 652,684 |
| Events in quadrant C | 3,343,555 | 630,095 |
| Events in quadrant D | 3,497,716 | 615,525 |
| Mode M9 | |||
|---|---|---|---|
| Quadrant | BADHDUFLAG | Total packets | Discarded packets |
| A | 0 | 2 | 0 |
| B | 0 | 2 | 0 |
| C | 0 | 2 | 0 |
| D | 0 | 2 | 0 |
| Mode SS | |||
|---|---|---|---|
| Quadrant | BADHDUFLAG | Total packets | Discarded packets |
| A | 0 | 144 | 0 |
| B | 0 | 144 | 0 |
| C | 0 | 144 | 0 |
| D | 0 | 144 | 0 |
| Mode M0 | |||
|---|---|---|---|
| Quadrant | BADHDUFLAG | Total packets | Discarded packets |
| A | 0 | 14562 | 1 |
| B | 0 | 14651 | 2 |
| C | 0 | 14728 | 1 |
| D | 0 | 15234 | 1 |
| Quadrant | Total seconds | Saturated seconds | Saturation percentage |
|---|---|---|---|
| A | 7124 | 163 | 2.288040% |
| B | 7124 | 199 | 2.793375% |
| C | 7124 | 205 | 2.877597% |
| D | 7124 | 116 | 1.628299% |
Noise dominated data is calculated using 1-second bins in cleaned event files. If a bin has >2000 counts, and if more than 50% of those come from <1% of pixels, then it is considered to be noise-dominated and hence unusable.
| Quadrant | # 1 sec bins | Bins with >0 counts | Bins with >2000 counts | High rate bins dominated by noise | Noise dominated (total time) | Noise dominated (detector-on time) | Marked lightcurve |
|---|---|---|---|---|---|---|---|
| A | 7279 | 7125 | 0 | 0 | 0.00% | 0.00% | 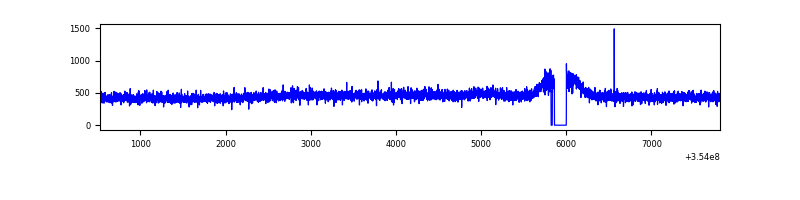 |
| B | 7279 | 7125 | 0 | 0 | 0.00% | 0.00% | 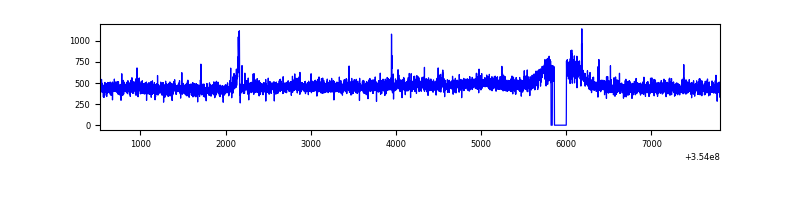 |
| C | 7279 | 7126 | 7 | 7 | 0.10% | 0.10% | 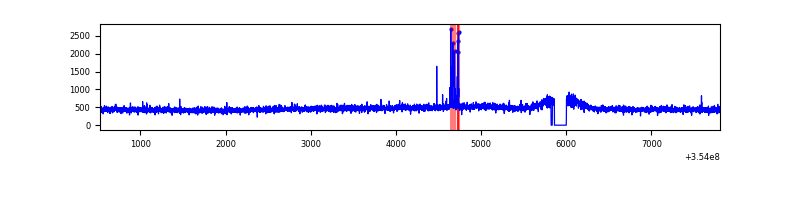 |
| D | 7279 | 7126 | 16 | 16 | 0.22% | 0.22% | 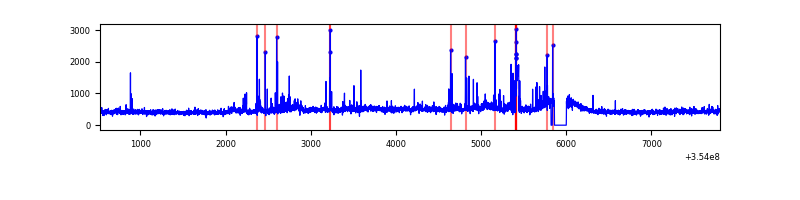 |
Top three noisy pixels from each quadrant. If the there are fewer than three noisy pixels in the level2.evt file, extra rows are filled as -1
| Pixel properties | Quadrant properties | ||||||
|---|---|---|---|---|---|---|---|
| Quadrant | DetID | PixID | Counts | Sigma | Mean | Median | Sigma |
| A | 13 | 254 | 11114 | 60.57 | 836 | 815 | 170.0 |
| A | 3 | 137 | 8792 | 46.91 | 836 | 815 | 170.0 |
| A | 0 | 226 | 6973 | 36.22 | 836 | 815 | 170.0 |
| B | 0 | 190 | 23423 | 140.27 | 836 | 810 | 161.2 |
| B | 12 | 111 | 20375 | 121.36 | 836 | 810 | 161.2 |
| B | 11 | 111 | 18511 | 109.8 | 836 | 810 | 161.2 |
| C | 14 | 238 | 130697 | 689.79 | 806 | 808 | 188.3 |
| C | 10 | 22 | 50743 | 265.18 | 806 | 808 | 188.3 |
| C | 2 | 114 | 16225 | 81.87 | 806 | 808 | 188.3 |
| D | 8 | 195 | 216562 | 1104.48 | 811 | 787 | 195.4 |
| D | 2 | 250 | 117398 | 596.89 | 811 | 787 | 195.4 |
| D | 13 | 153 | 63156 | 319.25 | 811 | 787 | 195.4 |
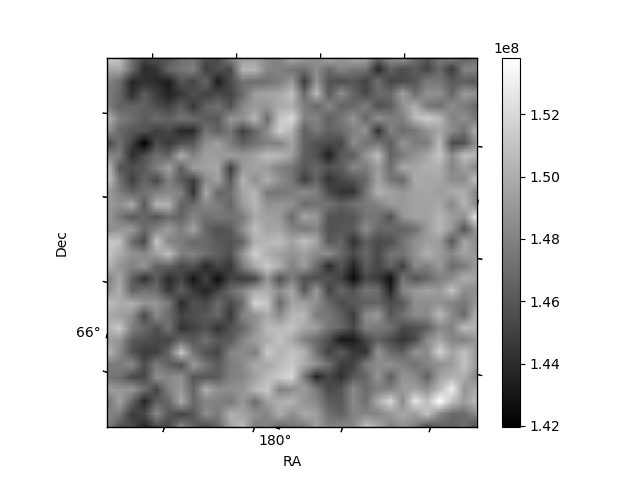
Histogram calculated using DETX and DETY for each event in the final _common_clean file
| Quadrant A |  |
 |
Quadrant B |
|---|---|---|---|
| Quadrant D |  |
 |
Quadrant C |
| Plot type | Count rate plots | Images |
|---|---|---|
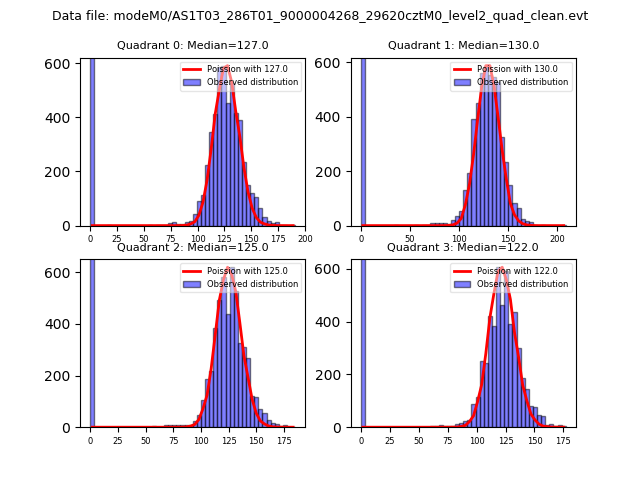
| Comparison with Poisson distribution Blue bars denote a histogram of data divided into 1 sec bins. Red curve is a Poisson curve with rate = median count rate of data. |
 |
 |
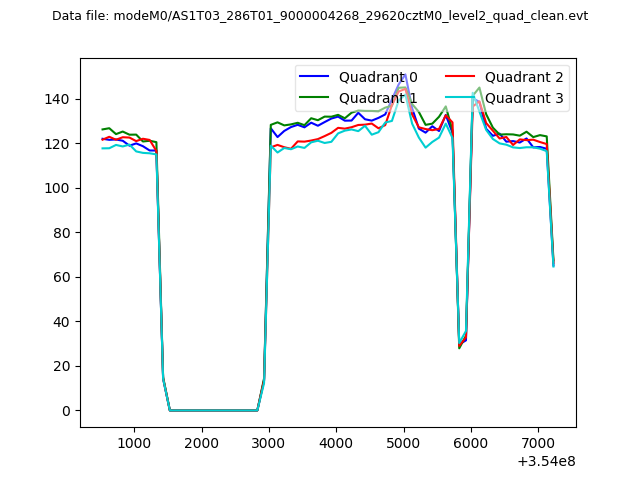
| Quadrant-wise count rates Data is divided into 100 sec bins |
 |
|
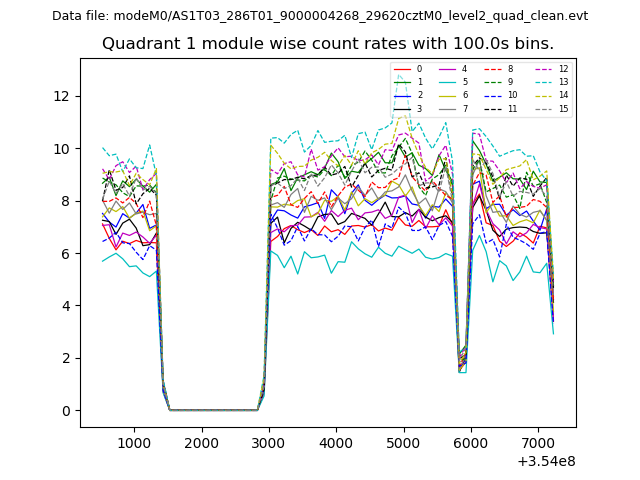
| Module-wise count rates for Quadrant A Data is divided into 100 sec bins |
 |
 |
| Module-wise count rates for Quadrant B Data is divided into 100 sec bins |
 |
 |
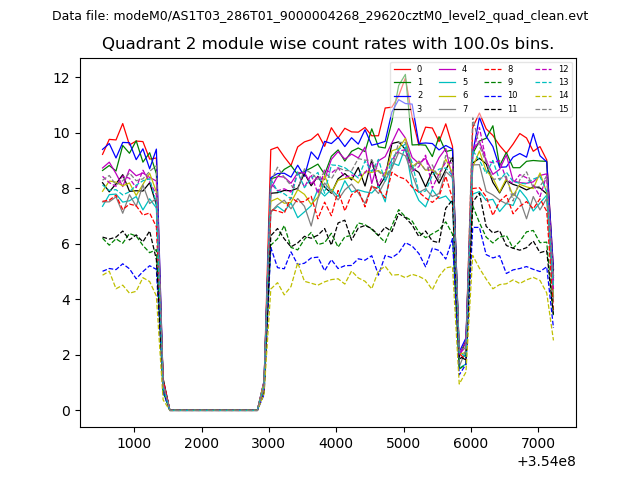
| Module-wise count rates for Quadrant C Data is divided into 100 sec bins |
 |
 |
| Module-wise count rates for Quadrant D Data is divided into 100 sec bins |
 |
 |
| Parameter | Plot |
|---|---|
| CZT HV Monitor | 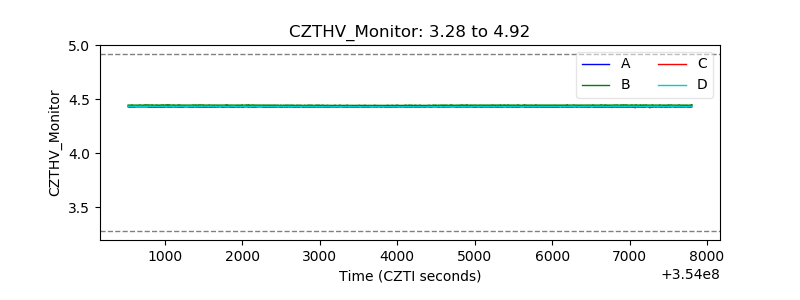 |
| D_VDD |  |
| Temperature 1 |  |
| Veto HV Monitor |  |
| Veto LLD |  |
| Alpha Counter | 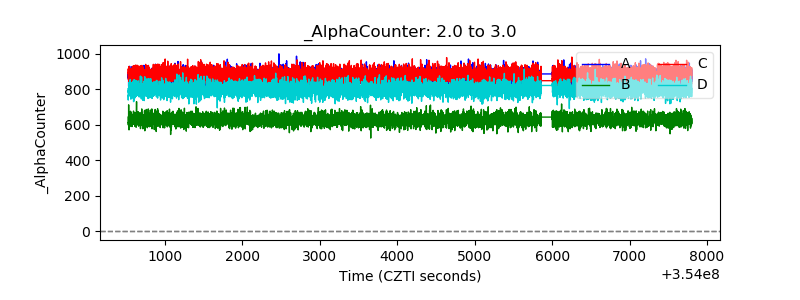 |
| _CPM_Rate | 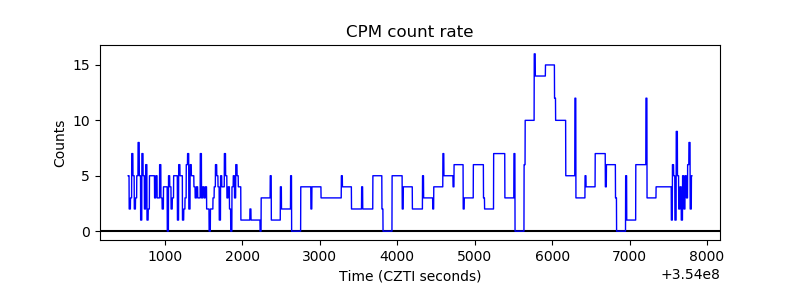 |
| CZT Counter |  |
| +2.5 Volts monitor |  |
| +5 Volts monitor |  |
| _ROLL_ROT |  |
| _Roll_DEC |  |
| _Roll_RA |  |
| Veto Counter |  |