| Param | Original file | Final file |
|---|---|---|
| Filename | modeM0/AS1T03_286T01_9000004268_29624cztM0_level2.evt | modeM0/AS1T03_286T01_9000004268_29624cztM0_level2_quad_clean.evt |
| Size (bytes) | 1,428,114,240 | 258,353,280 |
| Size | 1.3 GB | 246.4 MB |
| Events in quadrant A | 8,699,957 | 1,669,700 |
| Events in quadrant B | 8,953,140 | 1,704,032 |
| Events in quadrant C | 9,593,827 | 1,624,589 |
| Events in quadrant D | 14,719,364 | 1,516,913 |
| Mode M9 | |||
|---|---|---|---|
| Quadrant | BADHDUFLAG | Total packets | Discarded packets |
| A | 0 | 17 | 0 |
| B | 0 | 17 | 0 |
| C | 0 | 17 | 0 |
| D | 0 | 17 | 0 |
| Mode SS | |||
|---|---|---|---|
| Quadrant | BADHDUFLAG | Total packets | Discarded packets |
| A | 0 | 390 | 0 |
| B | 0 | 390 | 0 |
| C | 0 | 390 | 0 |
| D | 0 | 390 | 0 |
| Mode M0 | |||
|---|---|---|---|
| Quadrant | BADHDUFLAG | Total packets | Discarded packets |
| A | 0 | 38752 | 4 |
| B | 0 | 38999 | 4 |
| C | 0 | 40845 | 4 |
| D | 0 | 56223 | 4 |
| Quadrant | Total seconds | Saturated seconds | Saturation percentage |
|---|---|---|---|
| A | 18989 | 384 | 2.022223% |
| B | 18990 | 467 | 2.459189% |
| C | 18990 | 781 | 4.112691% |
| D | 18990 | 1724 | 9.078462% |
Noise dominated data is calculated using 1-second bins in cleaned event files. If a bin has >2000 counts, and if more than 50% of those come from <1% of pixels, then it is considered to be noise-dominated and hence unusable.
| Quadrant | # 1 sec bins | Bins with >0 counts | Bins with >2000 counts | High rate bins dominated by noise | Noise dominated (total time) | Noise dominated (detector-on time) | Marked lightcurve |
|---|---|---|---|---|---|---|---|
| A | 20764 | 18989 | 2 | 2 | 0.01% | 0.01% | 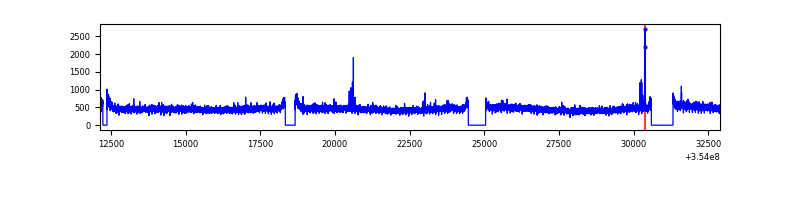 |
| B | 20765 | 18990 | 19 | 19 | 0.09% | 0.10% | 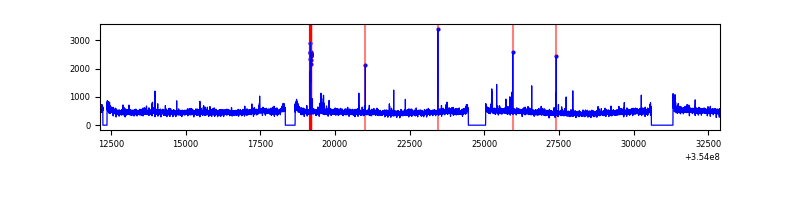 |
| C | 20765 | 18991 | 131 | 131 | 0.63% | 0.69% | 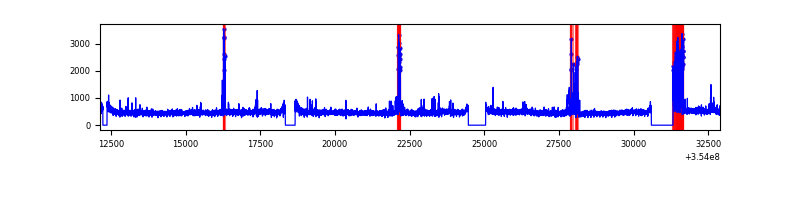 |
| D | 20765 | 18990 | 1165 | 1165 | 5.61% | 6.13% | 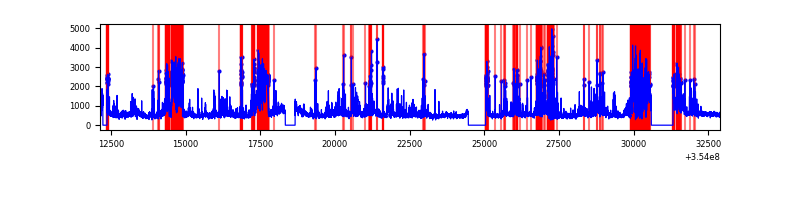 |
Top three noisy pixels from each quadrant. If the there are fewer than three noisy pixels in the level2.evt file, extra rows are filled as -1
| Pixel properties | Quadrant properties | ||||||
|---|---|---|---|---|---|---|---|
| Quadrant | DetID | PixID | Counts | Sigma | Mean | Median | Sigma |
| A | 13 | 254 | 32842 | 67.26 | 2244 | 2192 | 455.7 |
| A | 12 | 96 | 26817 | 54.04 | 2244 | 2192 | 455.7 |
| A | 3 | 137 | 23035 | 45.74 | 2244 | 2192 | 455.7 |
| B | 0 | 230 | 69677 | 158.93 | 2230 | 2170 | 424.8 |
| B | 12 | 111 | 54744 | 123.78 | 2230 | 2170 | 424.8 |
| B | 11 | 111 | 49691 | 111.88 | 2230 | 2170 | 424.8 |
| C | 10 | 22 | 616970 | 1230.11 | 2142 | 2149 | 499.8 |
| C | 14 | 238 | 381259 | 758.51 | 2142 | 2149 | 499.8 |
| C | 3 | 233 | 131646 | 259.09 | 2142 | 2149 | 499.8 |
| D | 7 | 238 | 4371215 | 8893.02 | 2090 | 2033 | 491.3 |
| D | 8 | 195 | 963450 | 1956.86 | 2090 | 2033 | 491.3 |
| D | 12 | 227 | 776852 | 1577.06 | 2090 | 2033 | 491.3 |
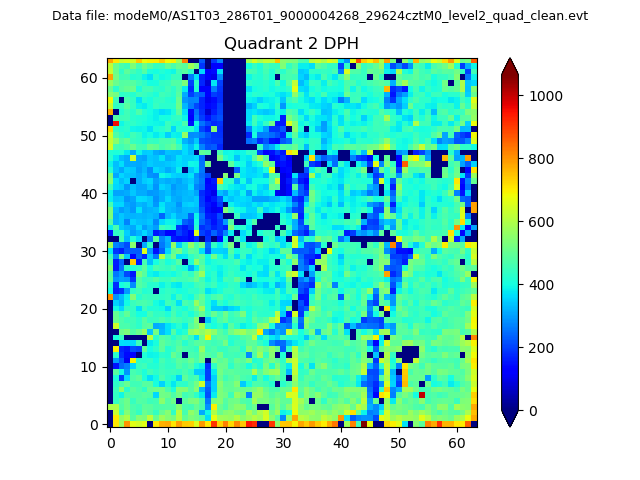
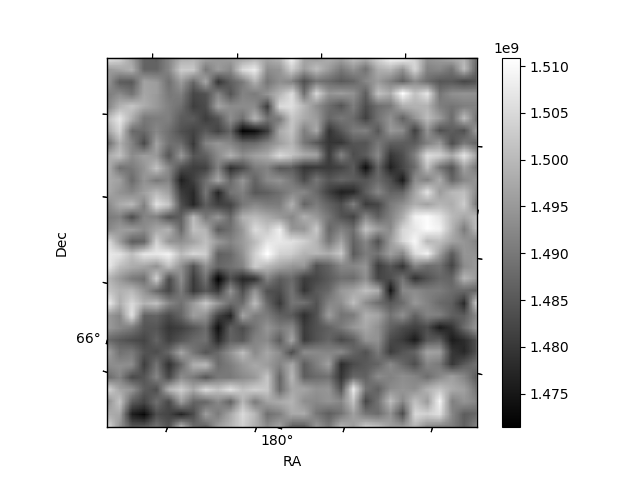
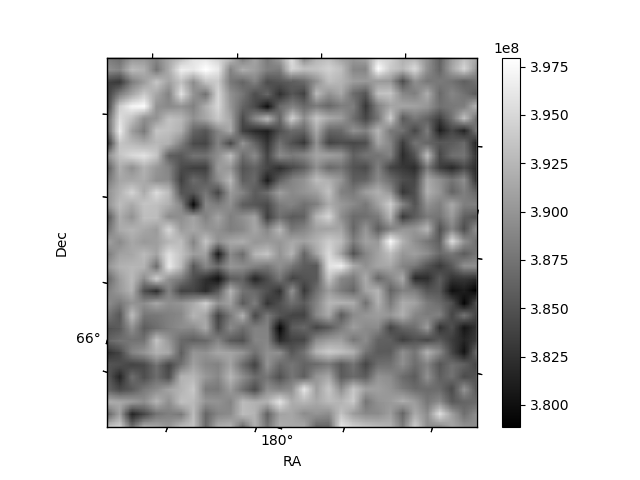
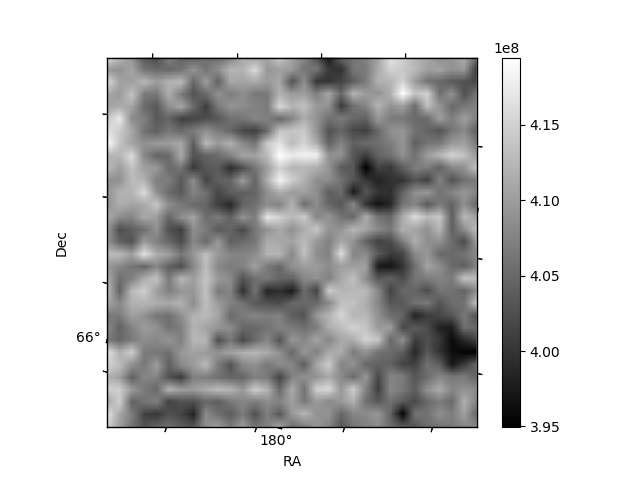
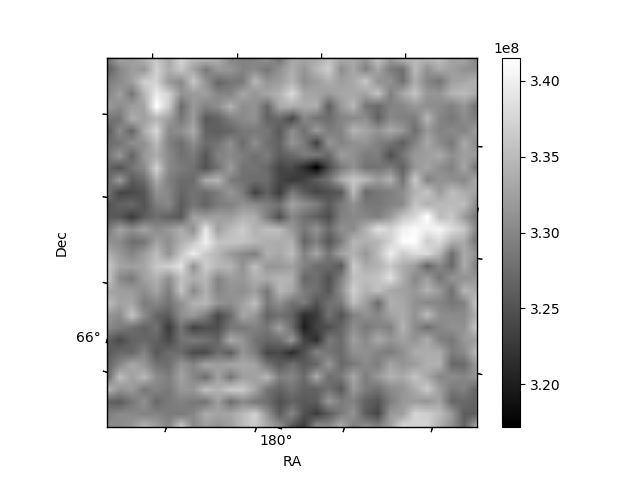
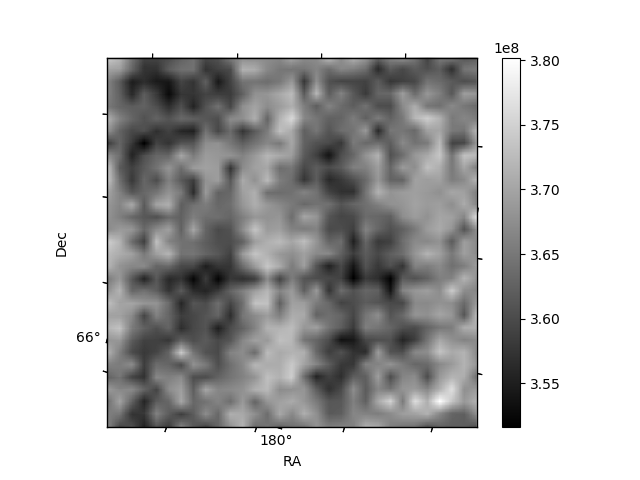
Histogram calculated using DETX and DETY for each event in the final _common_clean file
| Quadrant A | 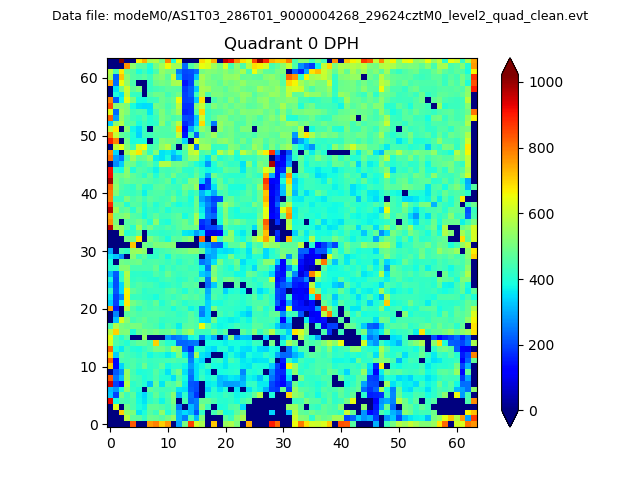 |
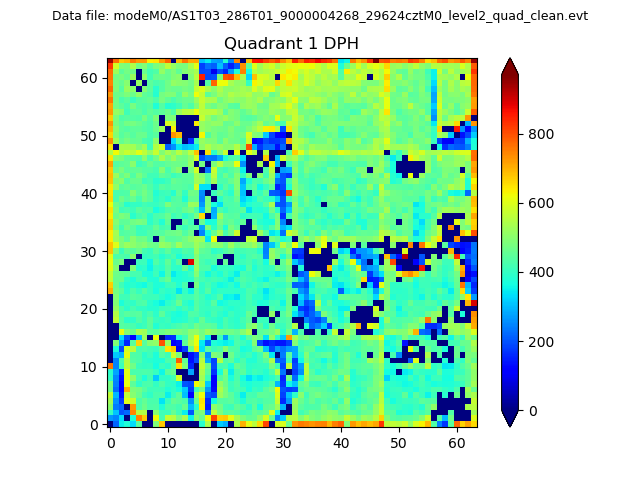 |
Quadrant B |
|---|---|---|---|
| Quadrant D | 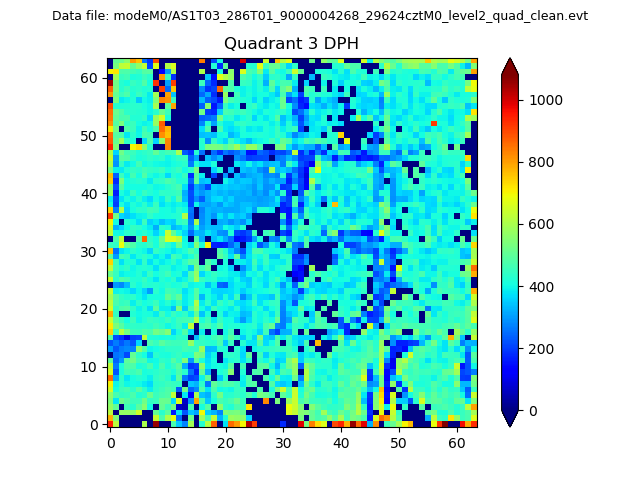 |
 |
Quadrant C |
| Plot type | Count rate plots | Images |
|---|---|---|
| Comparison with Poisson distribution Blue bars denote a histogram of data divided into 1 sec bins. Red curve is a Poisson curve with rate = median count rate of data. |
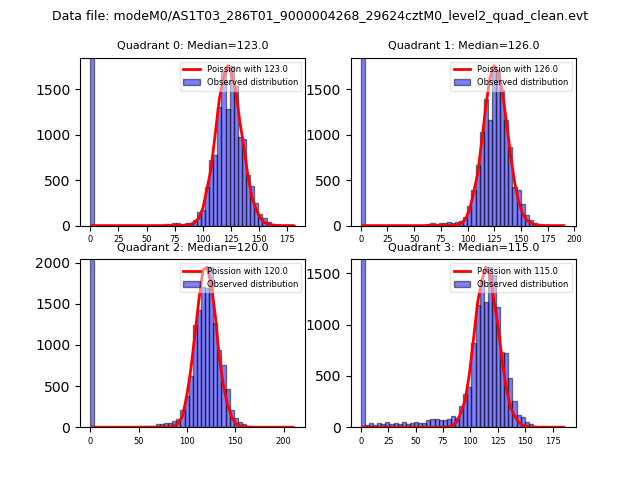 |
 |
| Quadrant-wise count rates Data is divided into 100 sec bins |
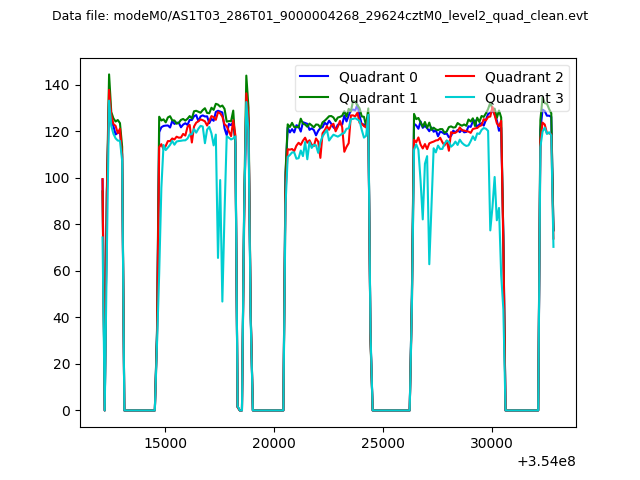 |
|
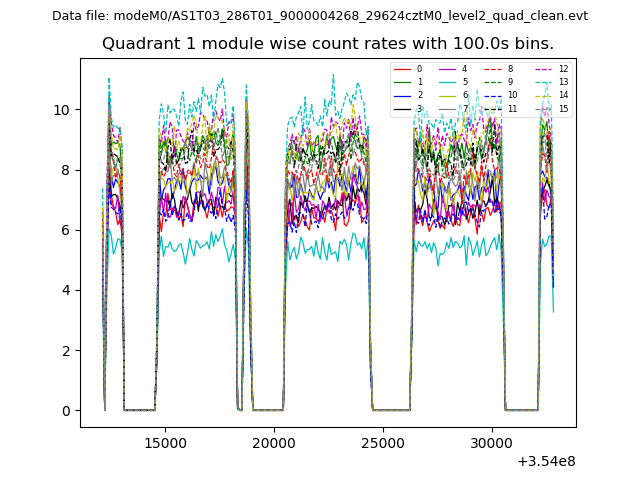
| Module-wise count rates for Quadrant A Data is divided into 100 sec bins |
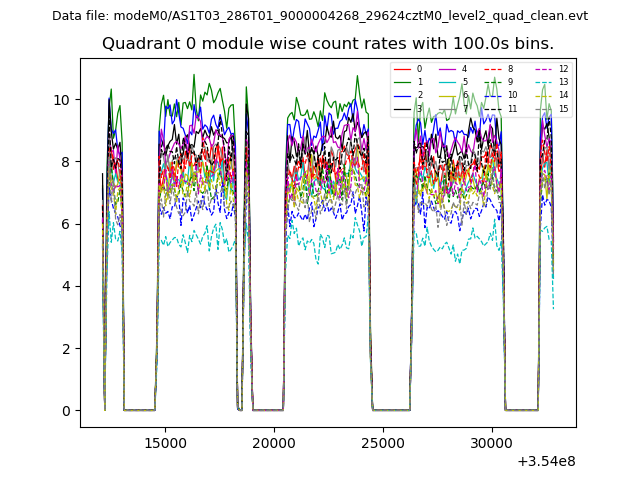 |
 |
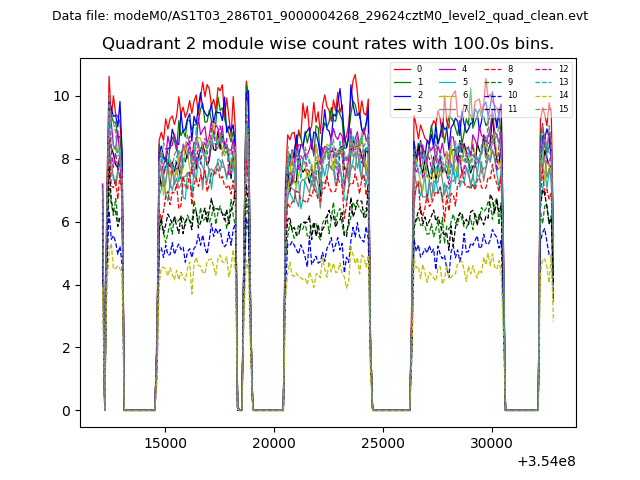
| Module-wise count rates for Quadrant B Data is divided into 100 sec bins |
 |
 |
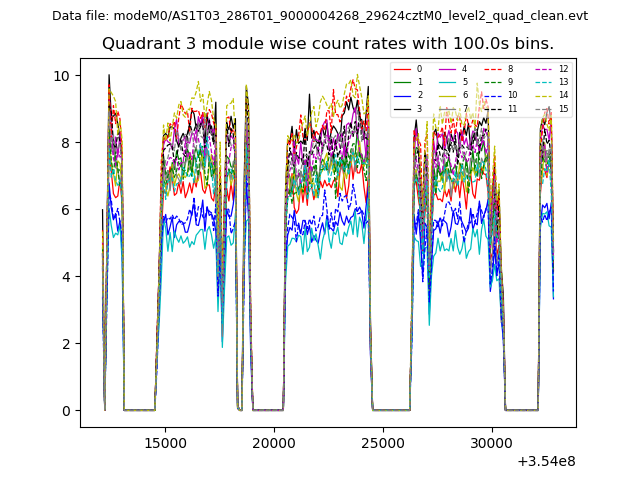
| Module-wise count rates for Quadrant C Data is divided into 100 sec bins |
 |
 |
| Module-wise count rates for Quadrant D Data is divided into 100 sec bins |
 |
 |
| Parameter | Plot |
|---|---|
| CZT HV Monitor | 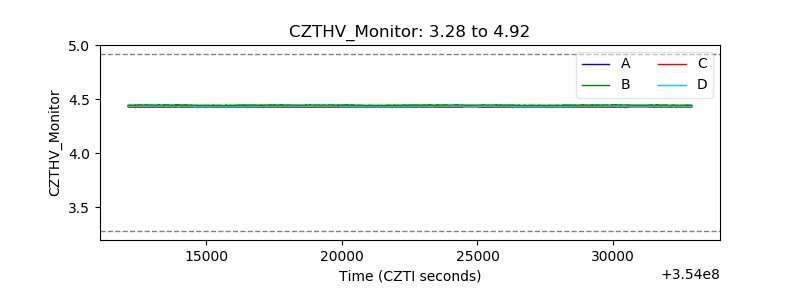 |
| D_VDD | 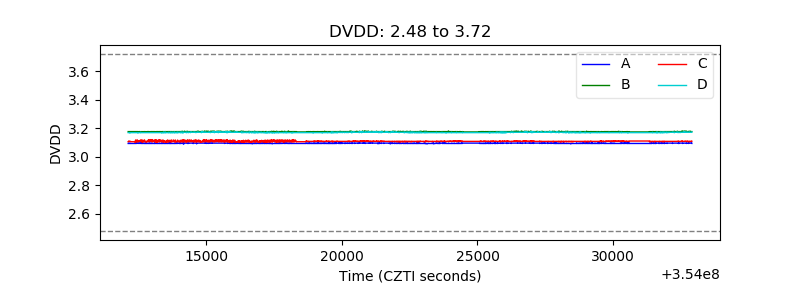 |
| Temperature 1 | 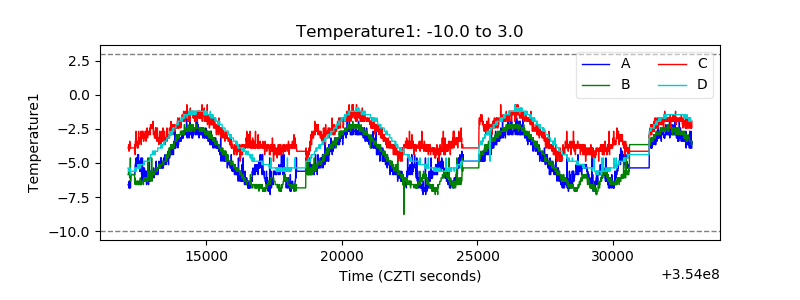 |
| Veto HV Monitor | 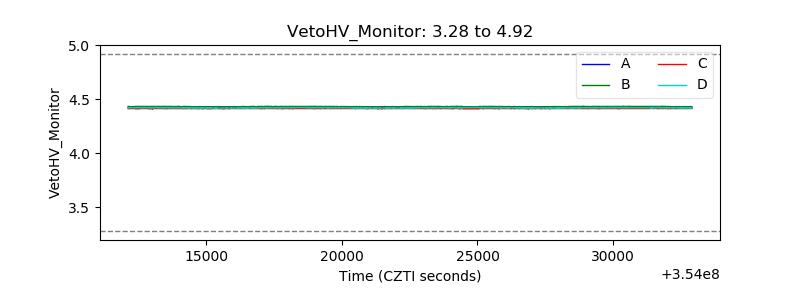 |
| Veto LLD | 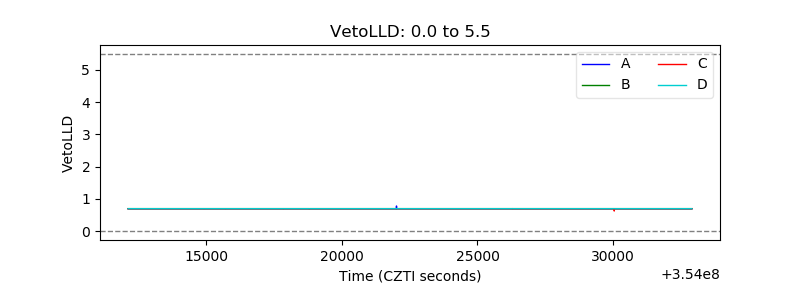 |
| Alpha Counter | 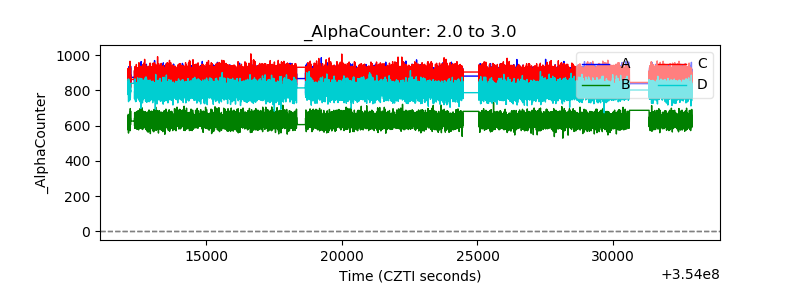 |
| _CPM_Rate | 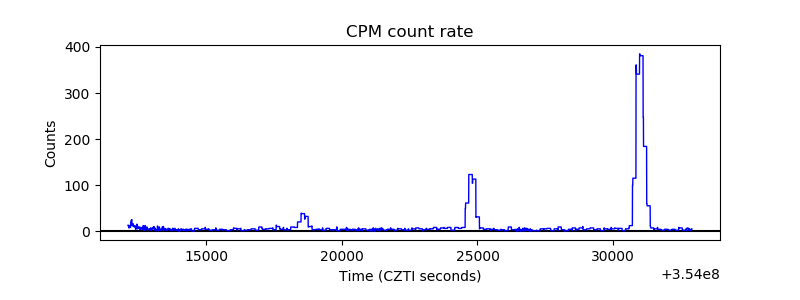 |
| CZT Counter | 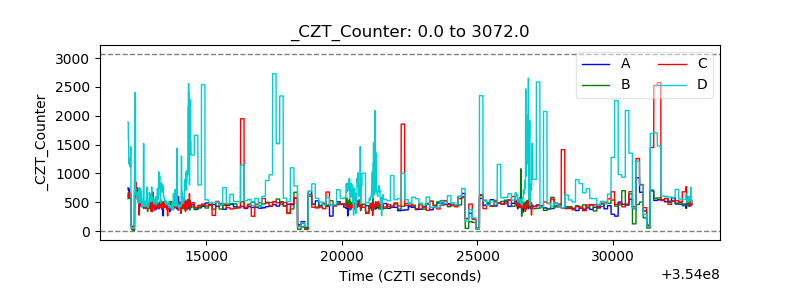 |
| +2.5 Volts monitor |  |
| +5 Volts monitor | 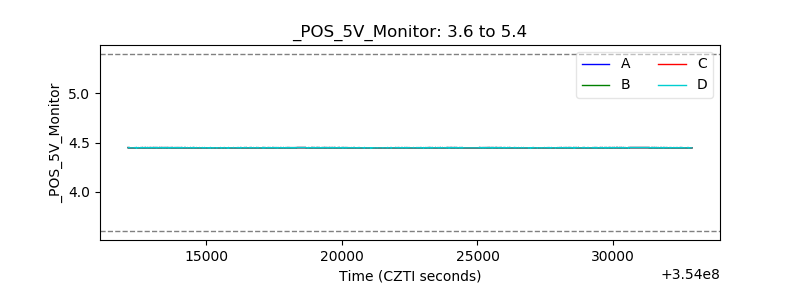 |
| _ROLL_ROT | 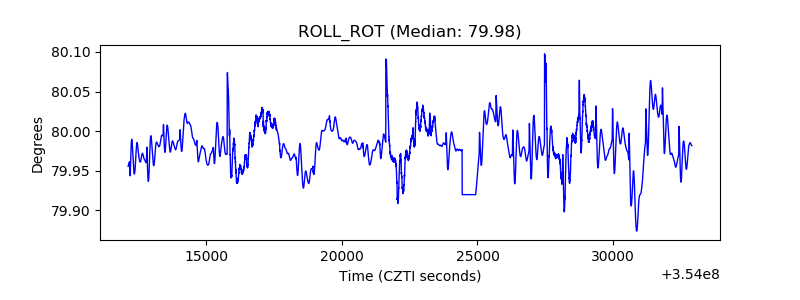 |
| _Roll_DEC |  |
| _Roll_RA | 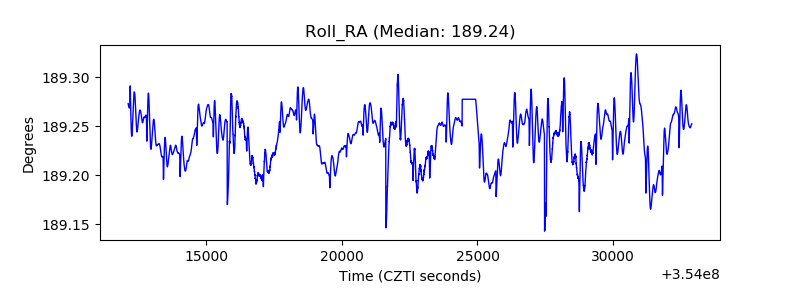 |
| Veto Counter | 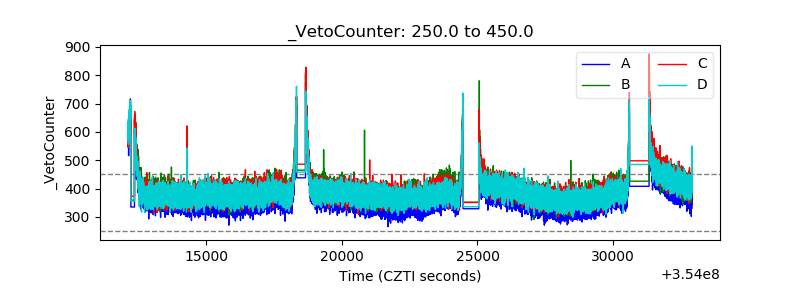 |