| Param | Original file | Final file |
|---|---|---|
| Filename | modeM0/AS1T03_286T01_9000004268_29625cztM0_level2.evt | modeM0/AS1T03_286T01_9000004268_29625cztM0_level2_quad_clean.evt |
| Size (bytes) | 475,813,440 | 97,266,240 |
| Size | 453.8 MB | 92.8 MB |
| Events in quadrant A | 2,772,901 | 645,783 |
| Events in quadrant B | 2,865,089 | 659,550 |
| Events in quadrant C | 3,032,039 | 631,057 |
| Events in quadrant D | 5,332,625 | 590,124 |
| Mode M9 | |||
|---|---|---|---|
| Quadrant | BADHDUFLAG | Total packets | Discarded packets |
| A | 0 | 9 | 0 |
| B | 0 | 9 | 0 |
| C | 0 | 9 | 0 |
| D | 0 | 9 | 0 |
| Mode SS | |||
|---|---|---|---|
| Quadrant | BADHDUFLAG | Total packets | Discarded packets |
| A | 0 | 122 | 0 |
| B | 0 | 122 | 0 |
| C | 0 | 122 | 0 |
| D | 0 | 122 | 0 |
| Mode M0 | |||
|---|---|---|---|
| Quadrant | BADHDUFLAG | Total packets | Discarded packets |
| A | 0 | 12328 | 1 |
| B | 0 | 12569 | 1 |
| C | 0 | 12895 | 1 |
| D | 0 | 19756 | 5 |
| Quadrant | Total seconds | Saturated seconds | Saturation percentage |
|---|---|---|---|
| A | 5998 | 44 | 0.733578% |
| B | 5999 | 54 | 0.900150% |
| C | 5999 | 119 | 1.983664% |
| D | 5998 | 665 | 11.087029% |
Noise dominated data is calculated using 1-second bins in cleaned event files. If a bin has >2000 counts, and if more than 50% of those come from <1% of pixels, then it is considered to be noise-dominated and hence unusable.
| Quadrant | # 1 sec bins | Bins with >0 counts | Bins with >2000 counts | High rate bins dominated by noise | Noise dominated (total time) | Noise dominated (detector-on time) | Marked lightcurve |
|---|---|---|---|---|---|---|---|
| A | 6898 | 5998 | 0 | 0 | 0.00% | 0.00% | 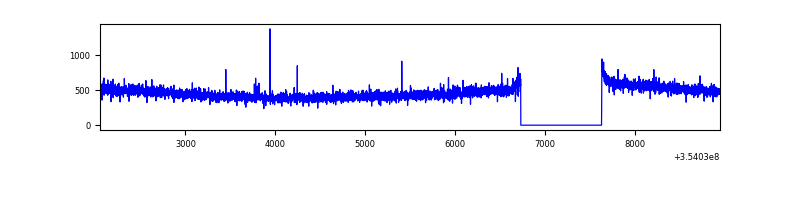 |
| B | 6899 | 5999 | 0 | 0 | 0.00% | 0.00% | 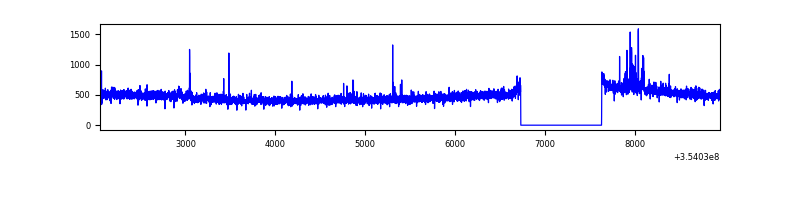 |
| C | 6899 | 5999 | 13 | 13 | 0.19% | 0.22% | 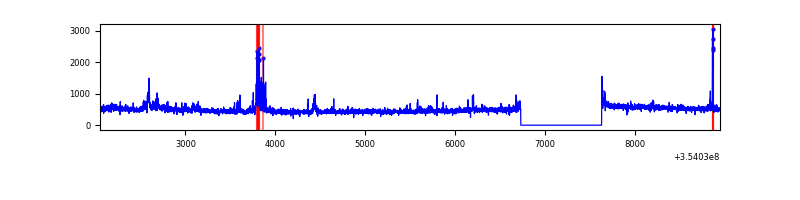 |
| D | 6897 | 5997 | 542 | 542 | 7.86% | 9.04% | 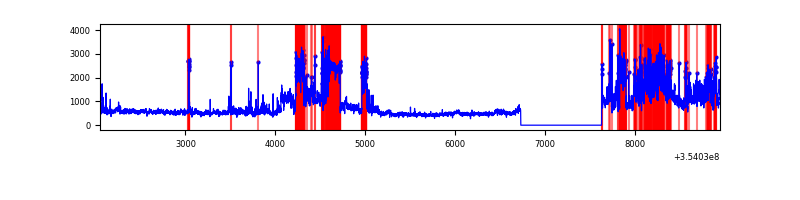 |
Top three noisy pixels from each quadrant. If the there are fewer than three noisy pixels in the level2.evt file, extra rows are filled as -1
| Pixel properties | Quadrant properties | ||||||
|---|---|---|---|---|---|---|---|
| Quadrant | DetID | PixID | Counts | Sigma | Mean | Median | Sigma |
| A | 13 | 254 | 10095 | 65.63 | 716 | 701 | 143.1 |
| A | 3 | 137 | 7246 | 45.73 | 716 | 701 | 143.1 |
| A | 0 | 226 | 5985 | 36.92 | 716 | 701 | 143.1 |
| B | 0 | 229 | 36507 | 260.28 | 713 | 695 | 137.6 |
| B | 0 | 190 | 20851 | 146.49 | 713 | 695 | 137.6 |
| B | 12 | 111 | 16777 | 116.88 | 713 | 695 | 137.6 |
| C | 14 | 238 | 125561 | 768.5 | 693 | 698 | 162.5 |
| C | 3 | 233 | 77650 | 473.62 | 693 | 698 | 162.5 |
| C | 10 | 22 | 72830 | 443.95 | 693 | 698 | 162.5 |
| D | 7 | 80 | 1218909 | 7625.96 | 671 | 653 | 159.8 |
| D | 7 | 238 | 817706 | 5114.53 | 671 | 653 | 159.8 |
| D | 8 | 195 | 488053 | 3050.99 | 671 | 653 | 159.8 |
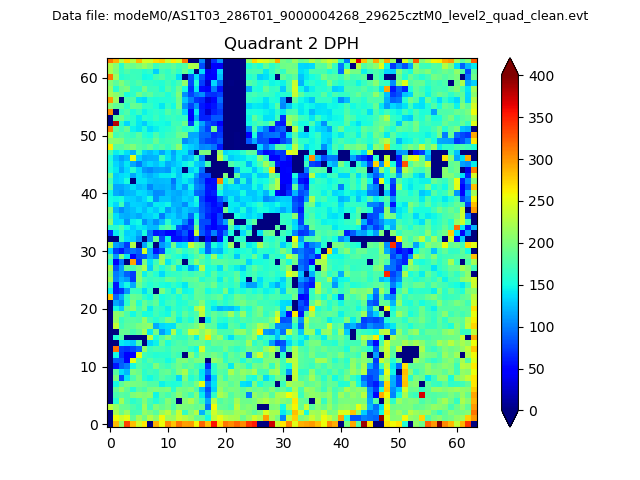
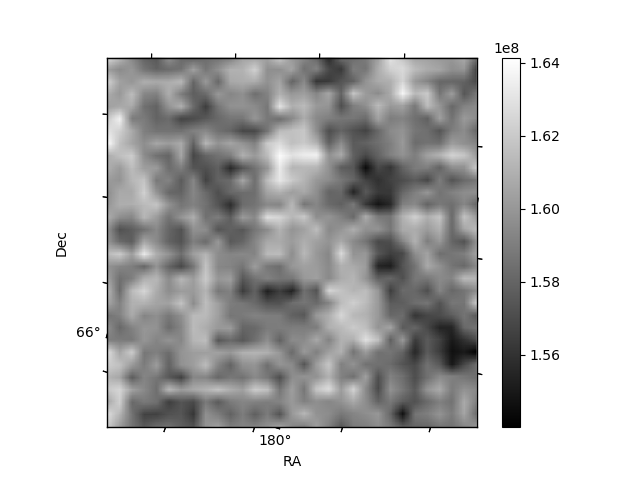
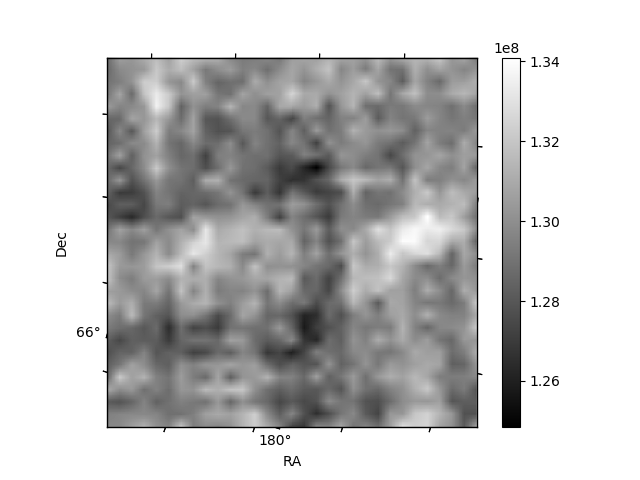
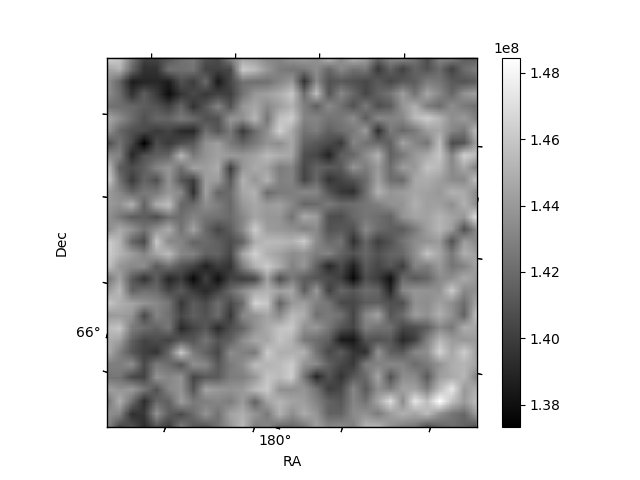
Histogram calculated using DETX and DETY for each event in the final _common_clean file
| Quadrant A | 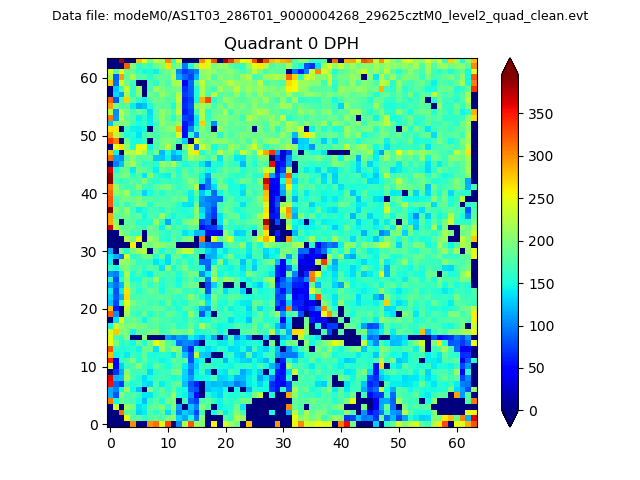 |
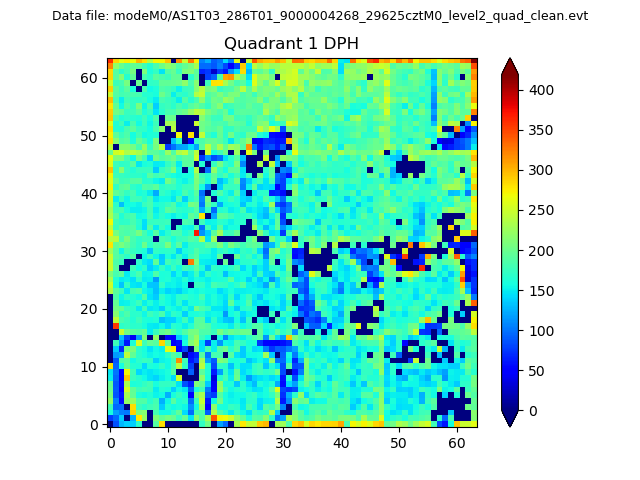 |
Quadrant B |
|---|---|---|---|
| Quadrant D | 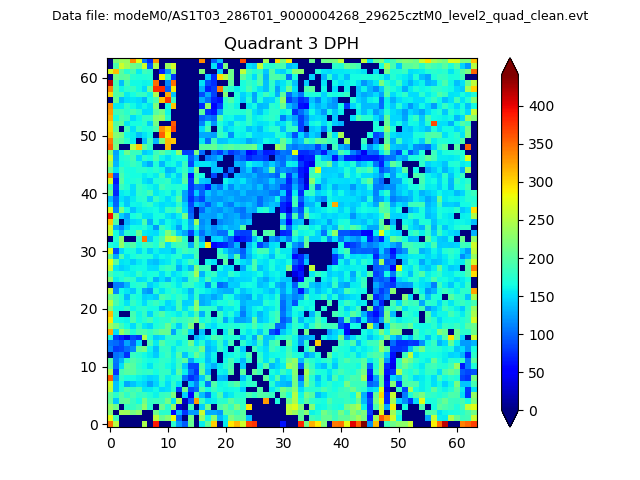 |
 |
Quadrant C |
| Plot type | Count rate plots | Images |
|---|---|---|
| Comparison with Poisson distribution Blue bars denote a histogram of data divided into 1 sec bins. Red curve is a Poisson curve with rate = median count rate of data. |
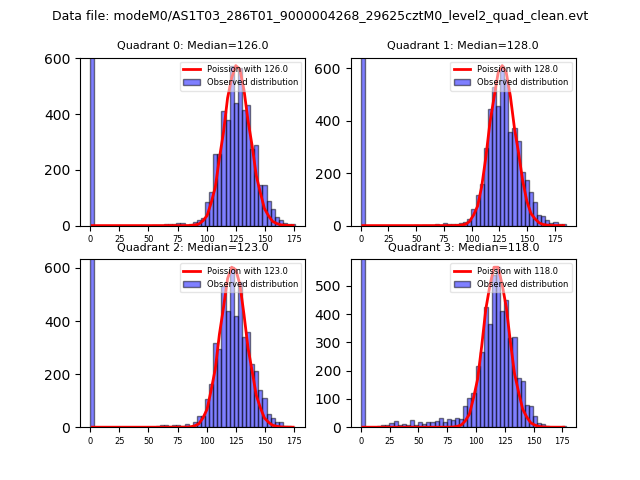 |
 |
| Quadrant-wise count rates Data is divided into 100 sec bins |
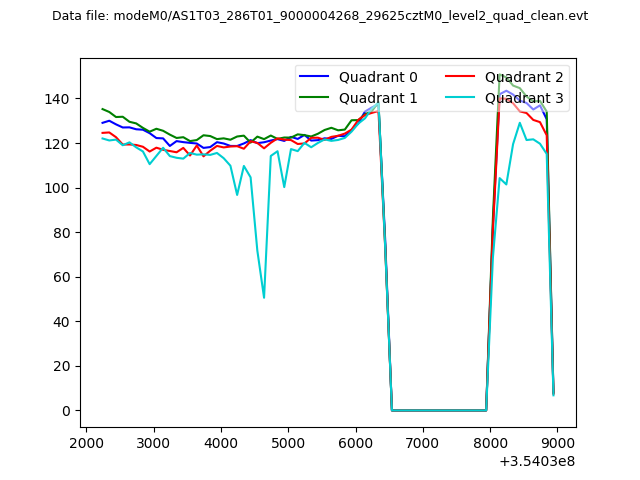 |
|
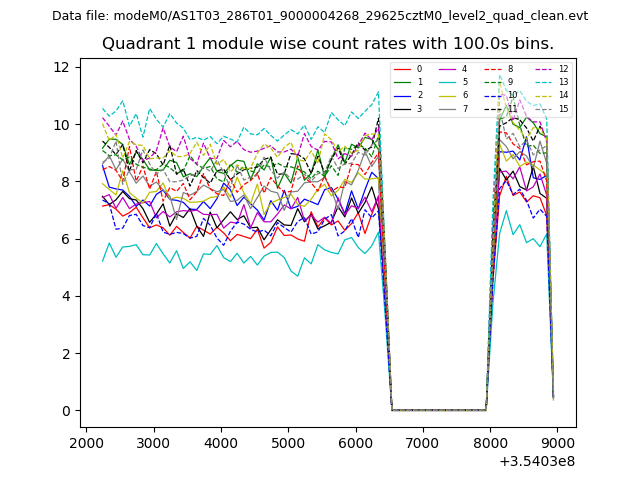
| Module-wise count rates for Quadrant A Data is divided into 100 sec bins |
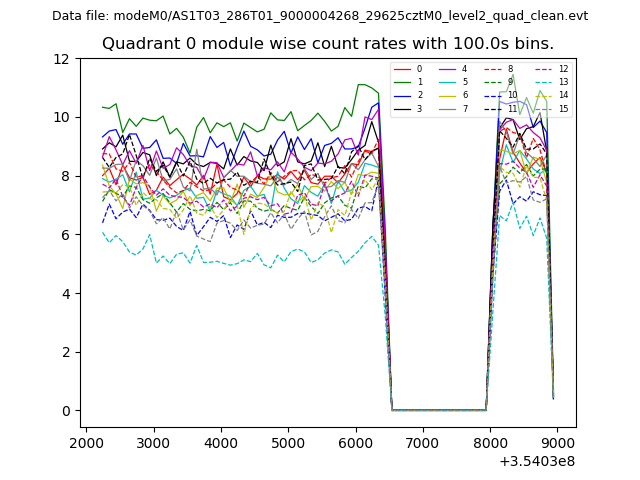 |
 |
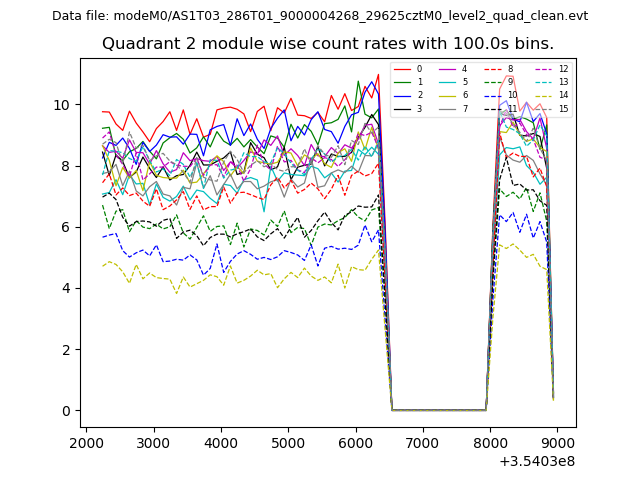
| Module-wise count rates for Quadrant B Data is divided into 100 sec bins |
 |
 |
| Module-wise count rates for Quadrant C Data is divided into 100 sec bins |
 |
 |
| Module-wise count rates for Quadrant D Data is divided into 100 sec bins |
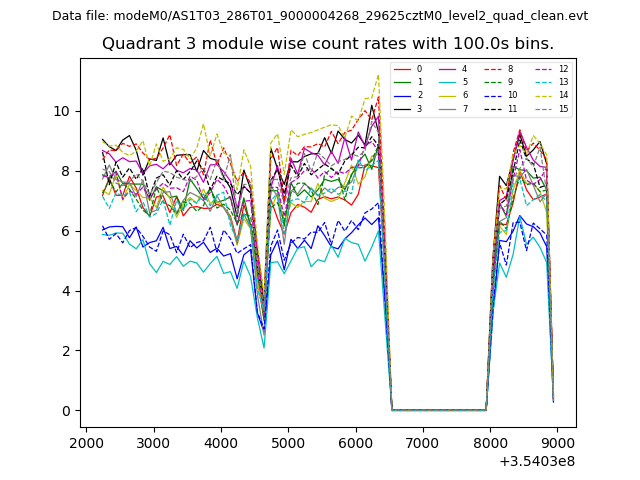 |
 |
| Parameter | Plot |
|---|---|
| CZT HV Monitor | 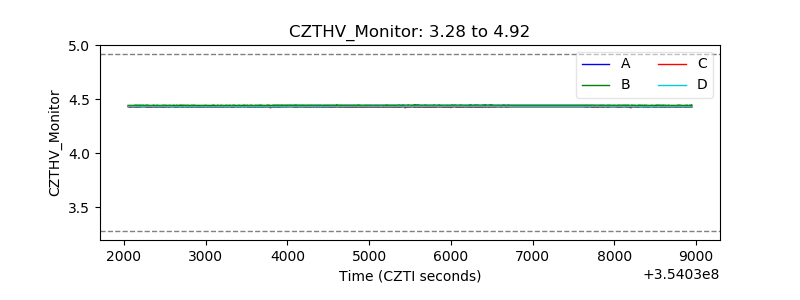 |
| D_VDD | 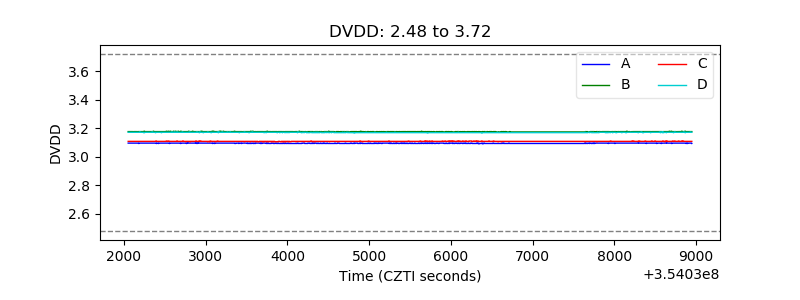 |
| Temperature 1 | 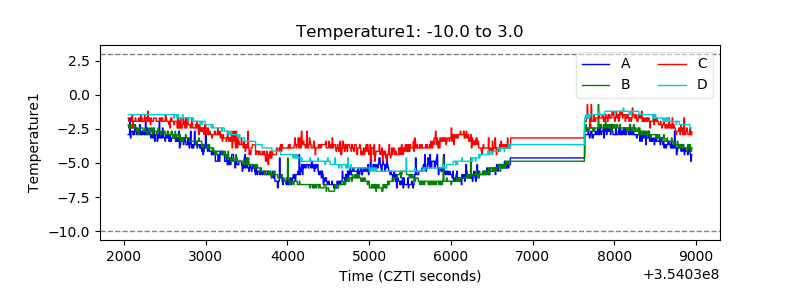 |
| Veto HV Monitor | 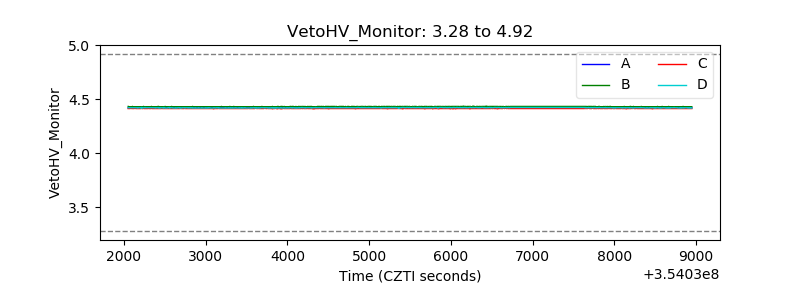 |
| Veto LLD | 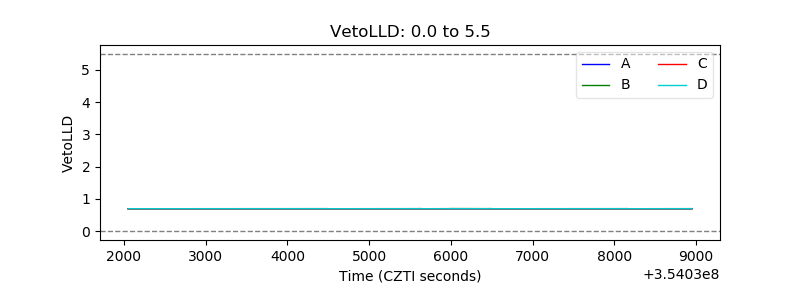 |
| Alpha Counter | 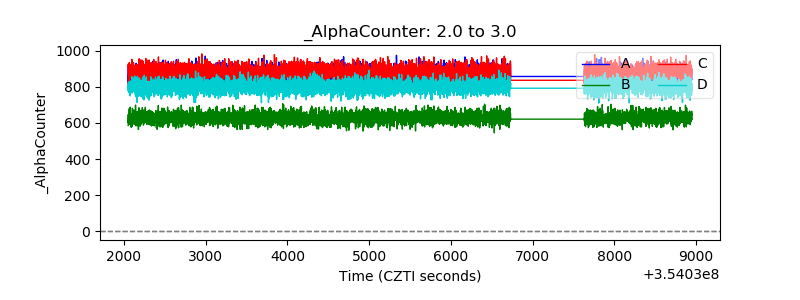 |
| _CPM_Rate | 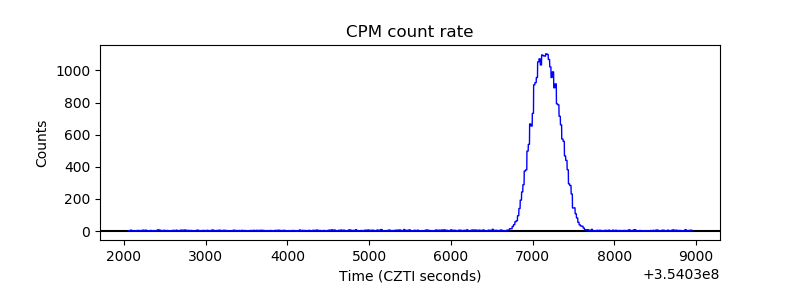 |
| CZT Counter | 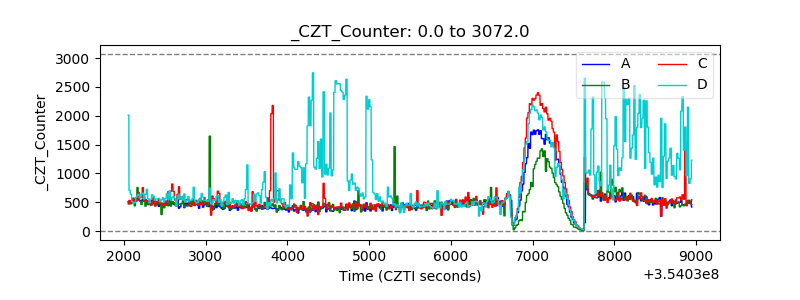 |
| +2.5 Volts monitor |  |
| +5 Volts monitor |  |
| _ROLL_ROT | 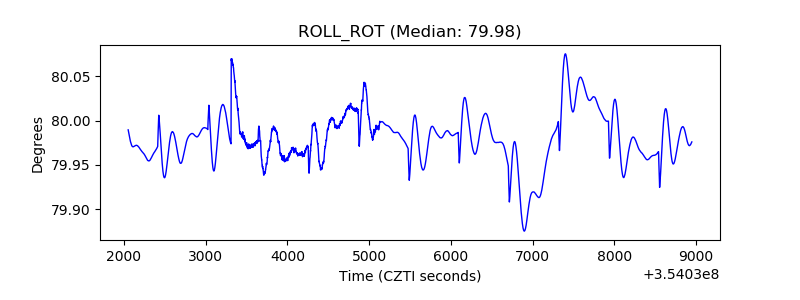 |
| _Roll_DEC | 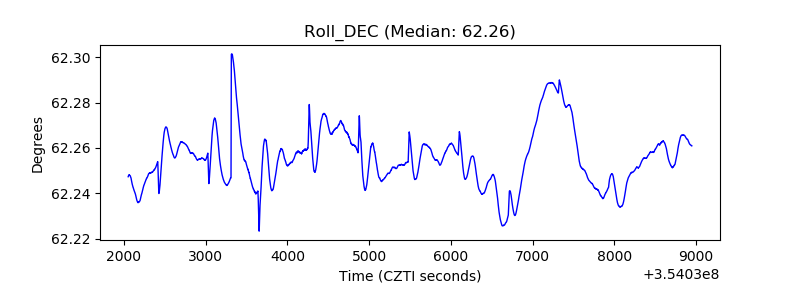 |
| _Roll_RA |  |
| Veto Counter | 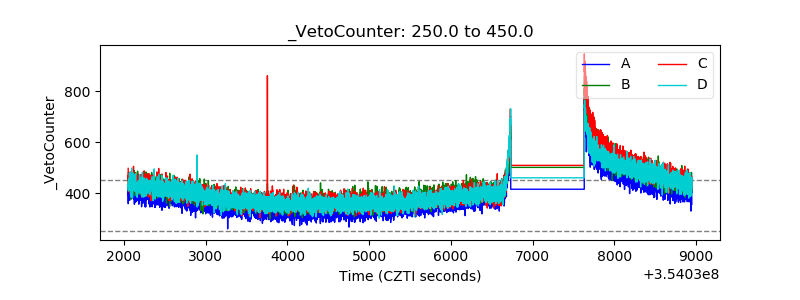 |