| Param | Original file | Final file |
|---|---|---|
| Filename | modeM0/AS1T03_286T01_9000004268_29628cztM0_level2.evt | modeM0/AS1T03_286T01_9000004268_29628cztM0_level2_quad_clean.evt |
| Size (bytes) | 468,066,240 | 115,738,560 |
| Size | 446.4 MB | 110.4 MB |
| Events in quadrant A | 3,009,160 | 772,092 |
| Events in quadrant B | 3,123,638 | 799,508 |
| Events in quadrant C | 3,333,893 | 770,976 |
| Events in quadrant D | 4,285,864 | 728,095 |
| Mode M9 | |||
|---|---|---|---|
| Quadrant | BADHDUFLAG | Total packets | Discarded packets |
| A | 0 | 12 | 0 |
| B | 0 | 12 | 0 |
| C | 0 | 12 | 0 |
| D | 0 | 12 | 0 |
| Mode SS | |||
|---|---|---|---|
| Quadrant | BADHDUFLAG | Total packets | Discarded packets |
| A | 0 | 126 | 0 |
| B | 0 | 126 | 0 |
| C | 0 | 126 | 0 |
| D | 0 | 126 | 0 |
| Mode M0 | |||
|---|---|---|---|
| Quadrant | BADHDUFLAG | Total packets | Discarded packets |
| A | 0 | 13230 | 1 |
| B | 0 | 13538 | 1 |
| C | 0 | 14181 | 1 |
| D | 0 | 17040 | 1 |
| Quadrant | Total seconds | Saturated seconds | Saturation percentage |
|---|---|---|---|
| A | 6230 | 16 | 0.256822% |
| B | 6231 | 39 | 0.625903% |
| C | 6230 | 138 | 2.215088% |
| D | 6230 | 263 | 4.221509% |
Noise dominated data is calculated using 1-second bins in cleaned event files. If a bin has >2000 counts, and if more than 50% of those come from <1% of pixels, then it is considered to be noise-dominated and hence unusable.
| Quadrant | # 1 sec bins | Bins with >0 counts | Bins with >2000 counts | High rate bins dominated by noise | Noise dominated (total time) | Noise dominated (detector-on time) | Marked lightcurve |
|---|---|---|---|---|---|---|---|
| A | 7430 | 6231 | 0 | 0 | 0.00% | 0.00% | 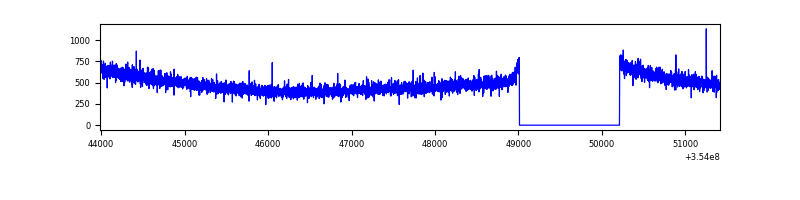 |
| B | 7431 | 6232 | 1 | 1 | 0.01% | 0.02% | 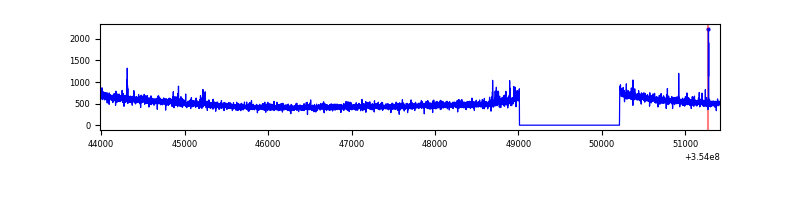 |
| C | 7430 | 6230 | 2 | 2 | 0.03% | 0.03% | 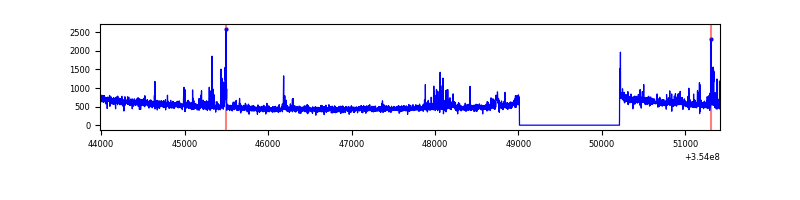 |
| D | 7430 | 6231 | 189 | 189 | 2.54% | 3.03% | 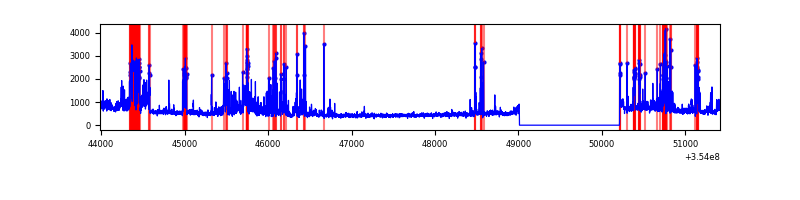 |
Top three noisy pixels from each quadrant. If the there are fewer than three noisy pixels in the level2.evt file, extra rows are filled as -1
| Pixel properties | Quadrant properties | ||||||
|---|---|---|---|---|---|---|---|
| Quadrant | DetID | PixID | Counts | Sigma | Mean | Median | Sigma |
| A | 13 | 254 | 11082 | 66.11 | 779 | 762 | 156.1 |
| A | 3 | 137 | 7418 | 42.64 | 779 | 762 | 156.1 |
| A | 0 | 226 | 6488 | 36.68 | 779 | 762 | 156.1 |
| B | 0 | 190 | 22915 | 152.06 | 784 | 764 | 145.7 |
| B | 12 | 111 | 17482 | 114.77 | 784 | 764 | 145.7 |
| B | 0 | 189 | 16850 | 110.43 | 784 | 764 | 145.7 |
| C | 14 | 238 | 145050 | 811.93 | 770 | 777 | 177.7 |
| C | 10 | 22 | 63245 | 351.55 | 770 | 777 | 177.7 |
| C | 3 | 233 | 45433 | 251.31 | 770 | 777 | 177.7 |
| D | 7 | 238 | 770893 | 4311.38 | 756 | 736 | 178.6 |
| D | 7 | 80 | 269681 | 1505.57 | 756 | 736 | 178.6 |
| D | 8 | 195 | 204766 | 1142.17 | 756 | 736 | 178.6 |
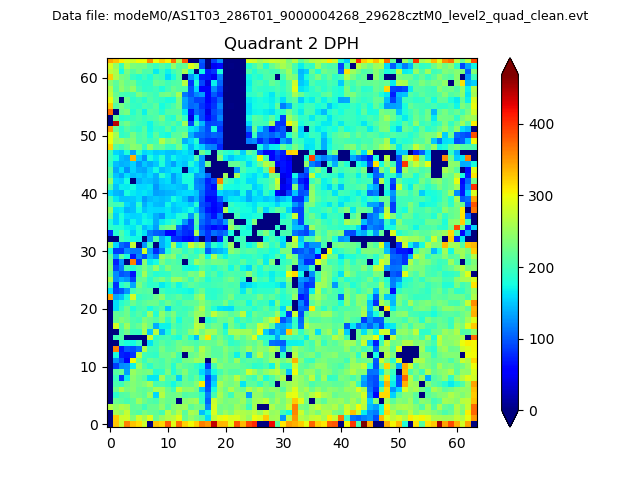
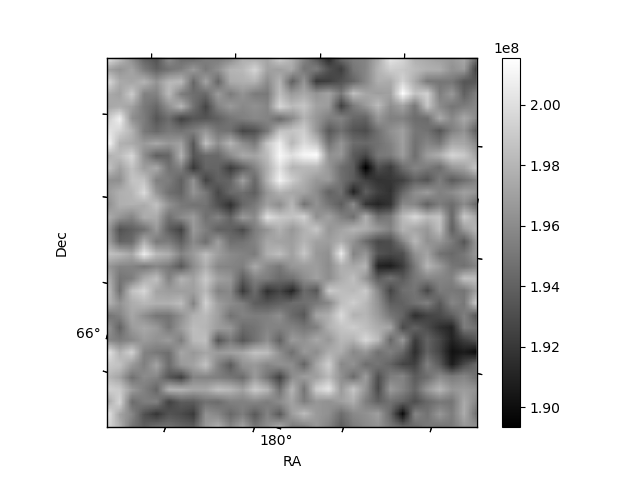
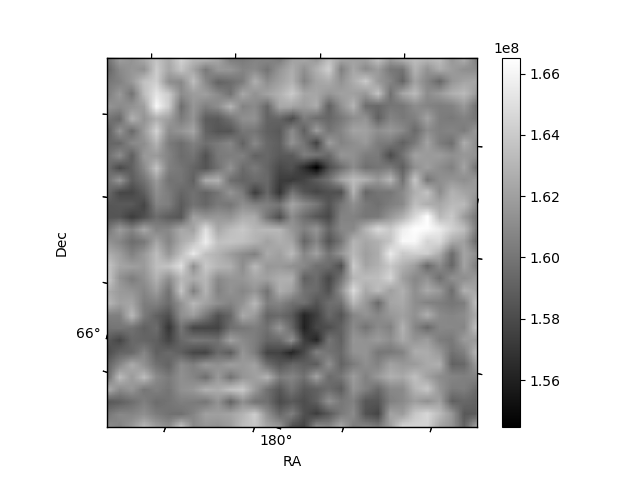
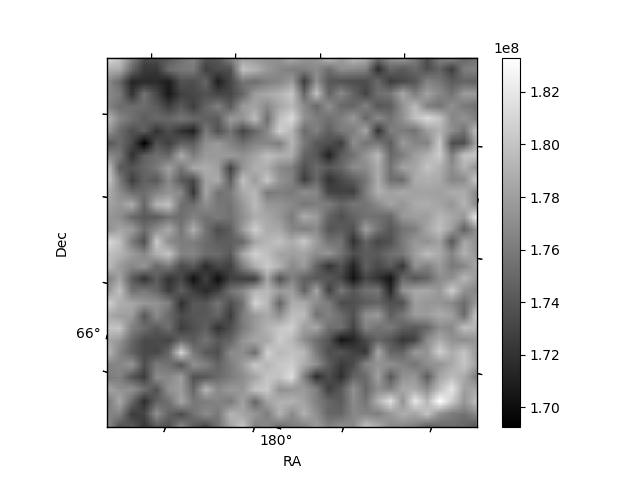
Histogram calculated using DETX and DETY for each event in the final _common_clean file
| Quadrant A |  |
 |
Quadrant B |
|---|---|---|---|
| Quadrant D |  |
 |
Quadrant C |
| Plot type | Count rate plots | Images |
|---|---|---|
| Comparison with Poisson distribution Blue bars denote a histogram of data divided into 1 sec bins. Red curve is a Poisson curve with rate = median count rate of data. |
 |
 |
| Quadrant-wise count rates Data is divided into 100 sec bins |
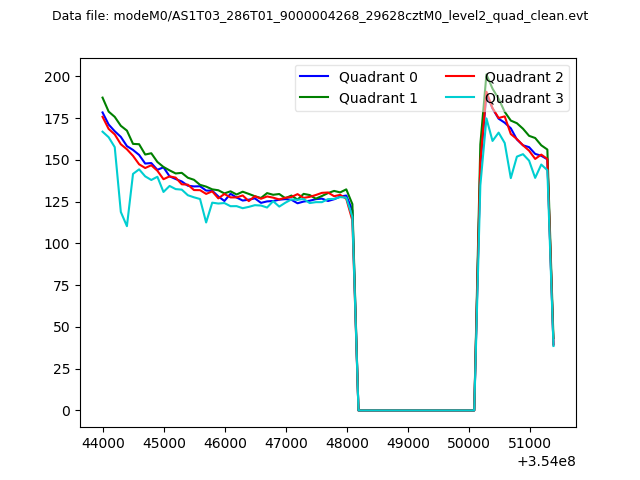 |
|
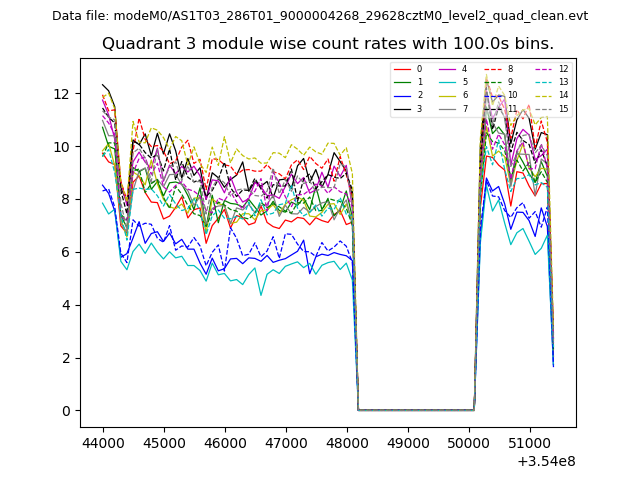
| Module-wise count rates for Quadrant A Data is divided into 100 sec bins |
 |
 |
| Module-wise count rates for Quadrant B Data is divided into 100 sec bins |
 |
 |
| Module-wise count rates for Quadrant C Data is divided into 100 sec bins |
 |
 |
| Module-wise count rates for Quadrant D Data is divided into 100 sec bins |
 |
 |
| Parameter | Plot |
|---|---|
| CZT HV Monitor |  |
| D_VDD | 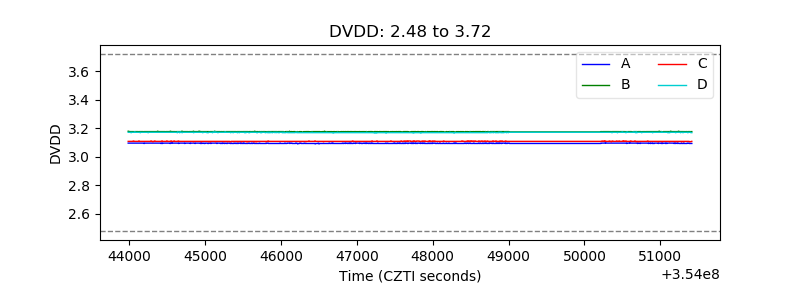 |
| Temperature 1 | 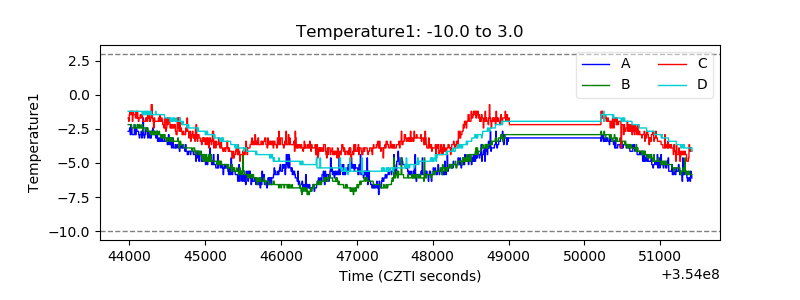 |
| Veto HV Monitor | 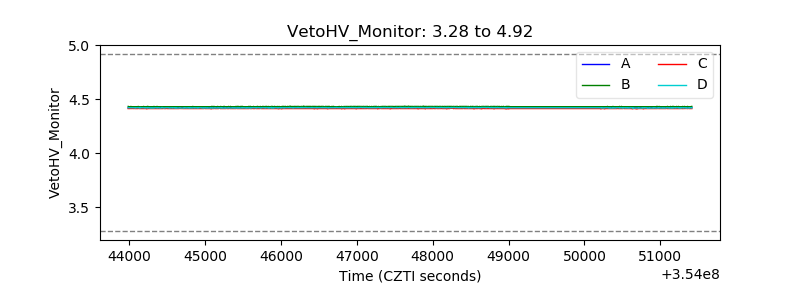 |
| Veto LLD | 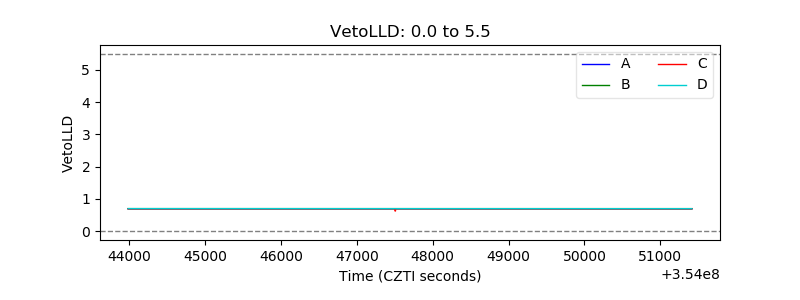 |
| Alpha Counter | 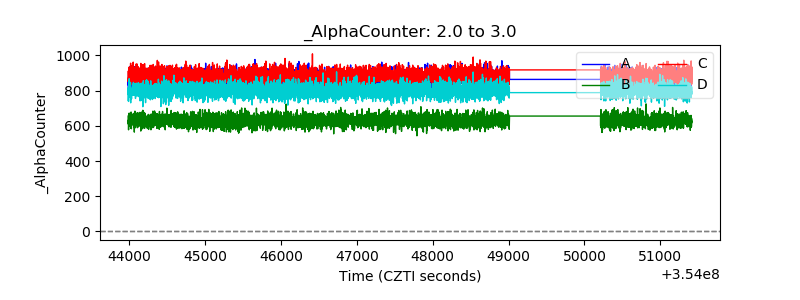 |
| _CPM_Rate | 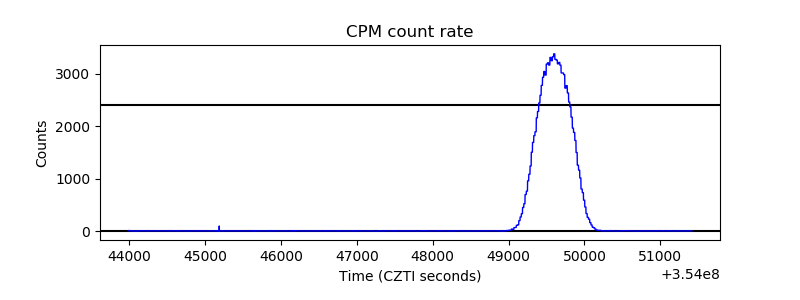 |
| CZT Counter | 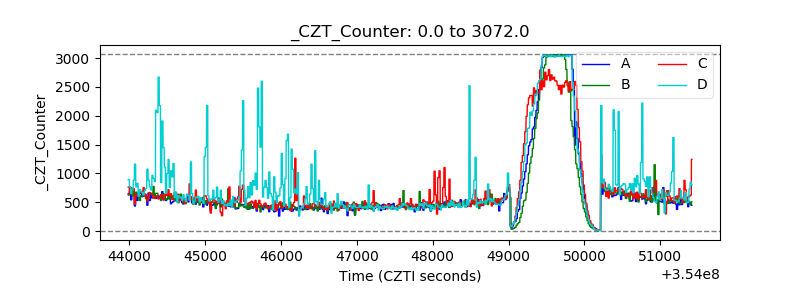 |
| +2.5 Volts monitor |  |
| +5 Volts monitor |  |
| _ROLL_ROT | 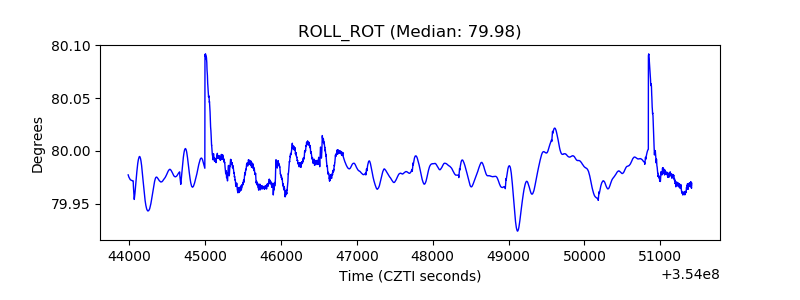 |
| _Roll_DEC | 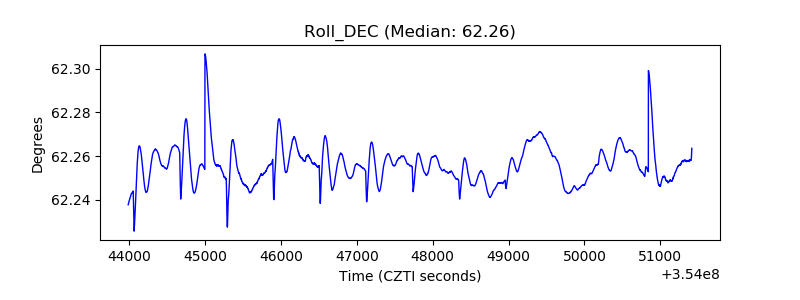 |
| _Roll_RA | 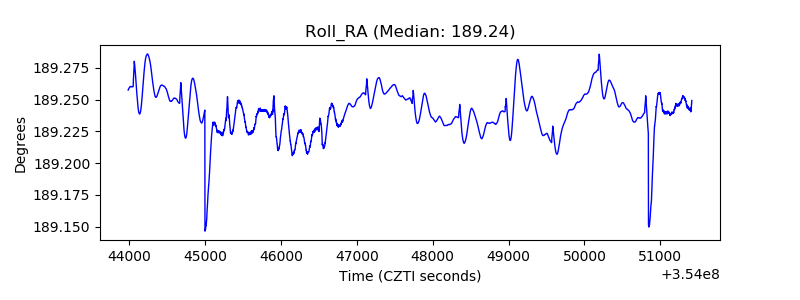 |
| Veto Counter | 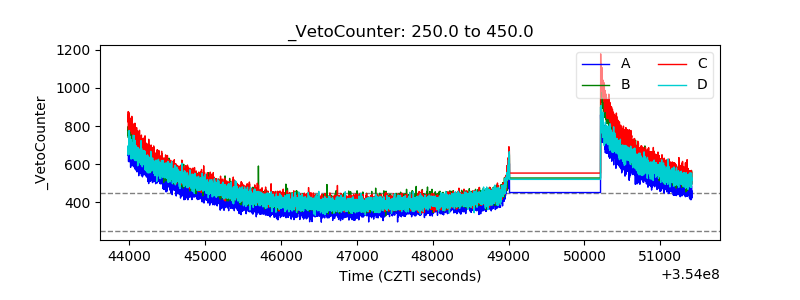 |