| Param | Original file | Final file |
|---|---|---|
| Filename | modeM0/AS1T03_286T01_9000004268_29631cztM0_level2.evt | modeM0/AS1T03_286T01_9000004268_29631cztM0_level2_quad_clean.evt |
| Size (bytes) | 485,334,720 | 102,556,800 |
| Size | 462.9 MB | 97.8 MB |
| Events in quadrant A | 3,001,317 | 676,036 |
| Events in quadrant B | 3,127,397 | 709,799 |
| Events in quadrant C | 3,215,557 | 679,583 |
| Events in quadrant D | 4,935,076 | 609,429 |
| Mode M9 | |||
|---|---|---|---|
| Quadrant | BADHDUFLAG | Total packets | Discarded packets |
| A | 0 | 20 | 0 |
| B | 0 | 21 | 0 |
| C | 0 | 21 | 0 |
| D | 0 | 21 | 0 |
| Mode SS | |||
|---|---|---|---|
| Quadrant | BADHDUFLAG | Total packets | Discarded packets |
| A | 0 | 126 | 0 |
| B | 0 | 126 | 0 |
| C | 0 | 126 | 0 |
| D | 0 | 126 | 0 |
| Mode M0 | |||
|---|---|---|---|
| Quadrant | BADHDUFLAG | Total packets | Discarded packets |
| A | 0 | 12914 | 2 |
| B | 0 | 13155 | 2 |
| C | 0 | 13344 | 2 |
| D | 0 | 18757 | 3 |
| Quadrant | Total seconds | Saturated seconds | Saturation percentage |
|---|---|---|---|
| A | 6172 | 25 | 0.405055% |
| B | 6172 | 52 | 0.842515% |
| C | 6172 | 81 | 1.312378% |
| D | 6171 | 580 | 9.398801% |
Noise dominated data is calculated using 1-second bins in cleaned event files. If a bin has >2000 counts, and if more than 50% of those come from <1% of pixels, then it is considered to be noise-dominated and hence unusable.
| Quadrant | # 1 sec bins | Bins with >0 counts | Bins with >2000 counts | High rate bins dominated by noise | Noise dominated (total time) | Noise dominated (detector-on time) | Marked lightcurve |
|---|---|---|---|---|---|---|---|
| A | 7492 | 6173 | 4 | 4 | 0.05% | 0.06% | 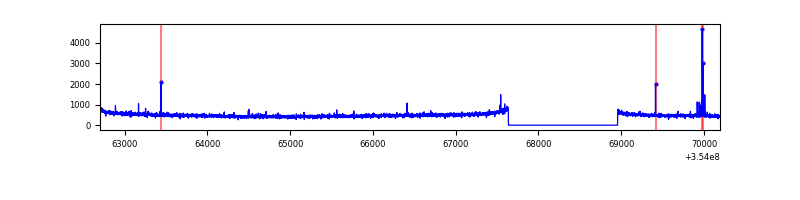 |
| B | 7492 | 6173 | 0 | 0 | 0.00% | 0.00% | 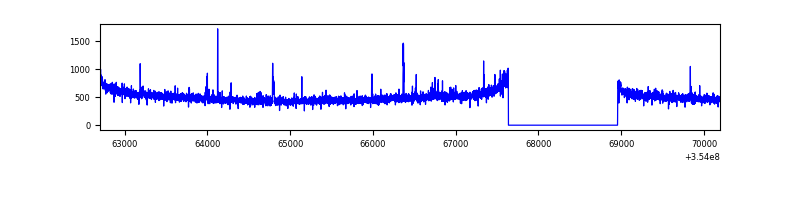 |
| C | 7492 | 6173 | 1 | 1 | 0.01% | 0.02% | 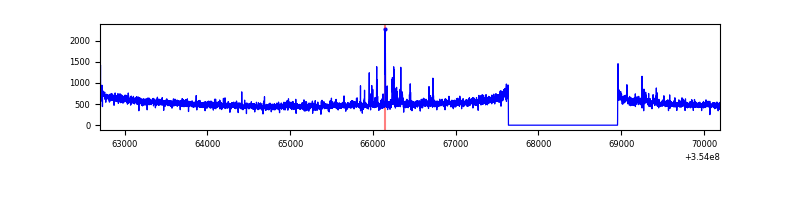 |
| D | 7491 | 6171 | 482 | 482 | 6.43% | 7.81% |  |
Top three noisy pixels from each quadrant. If the there are fewer than three noisy pixels in the level2.evt file, extra rows are filled as -1
| Pixel properties | Quadrant properties | ||||||
|---|---|---|---|---|---|---|---|
| Quadrant | DetID | PixID | Counts | Sigma | Mean | Median | Sigma |
| A | 12 | 96 | 40823 | 264.06 | 767 | 752 | 151.8 |
| A | 13 | 254 | 10047 | 61.25 | 767 | 752 | 151.8 |
| A | 3 | 137 | 7175 | 42.33 | 767 | 752 | 151.8 |
| B | 0 | 189 | 40440 | 276.01 | 780 | 761 | 143.8 |
| B | 12 | 111 | 17306 | 115.09 | 780 | 761 | 143.8 |
| B | 11 | 111 | 15608 | 103.28 | 780 | 761 | 143.8 |
| C | 14 | 238 | 131571 | 747.27 | 756 | 761 | 175.1 |
| C | 3 | 233 | 55500 | 312.7 | 756 | 761 | 175.1 |
| C | 7 | 247 | 47394 | 266.4 | 756 | 761 | 175.1 |
| D | 7 | 238 | 1782131 | 10487.79 | 716 | 696 | 169.9 |
| D | 8 | 195 | 266717 | 1566.14 | 716 | 696 | 169.9 |
| D | 2 | 250 | 76987 | 449.15 | 716 | 696 | 169.9 |
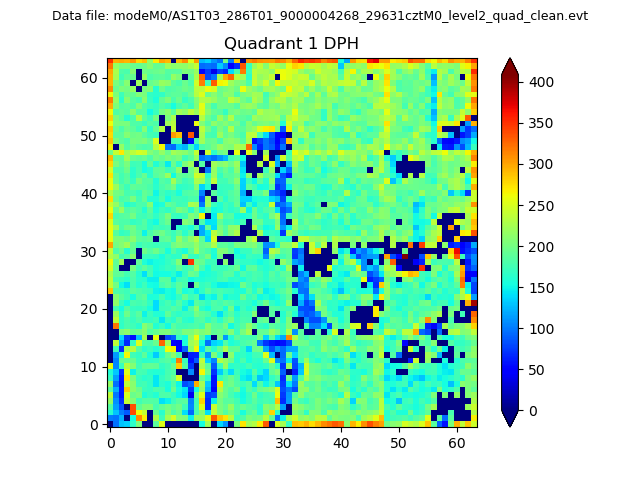
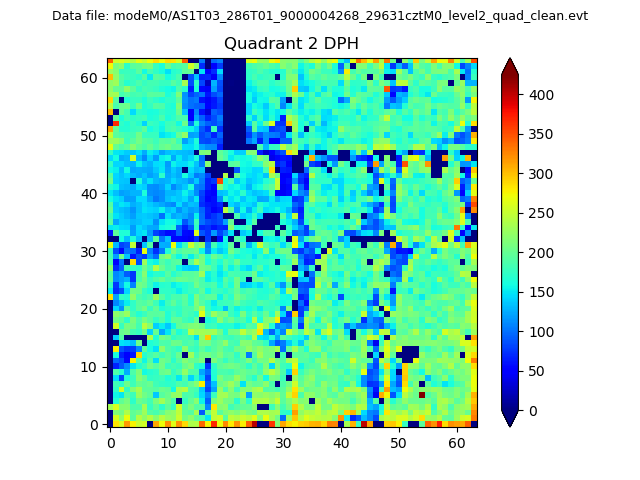
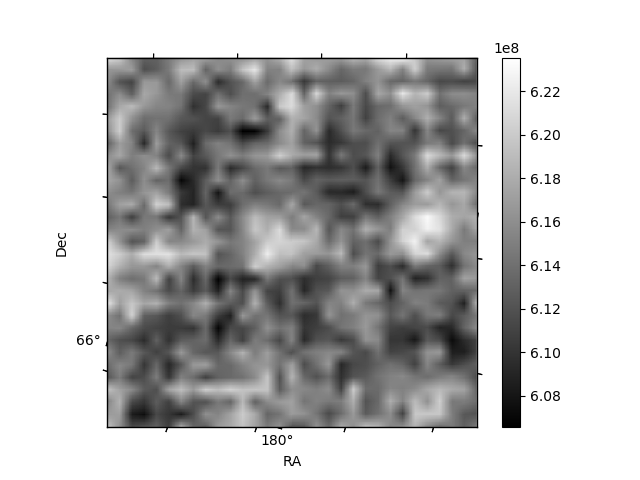
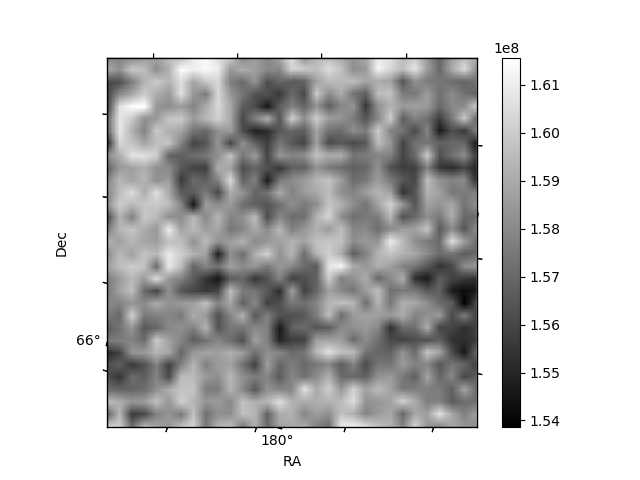
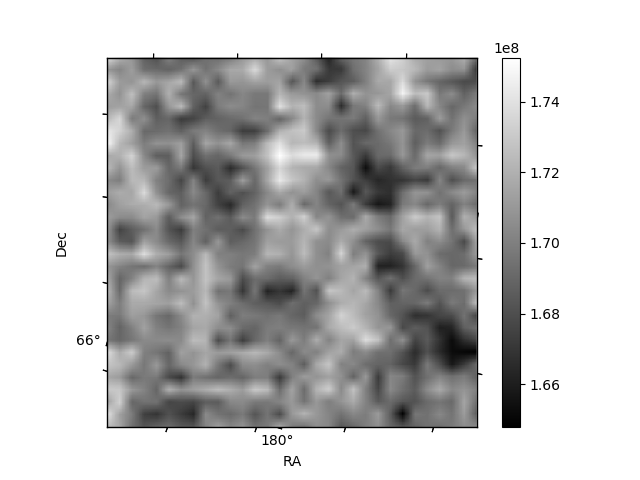
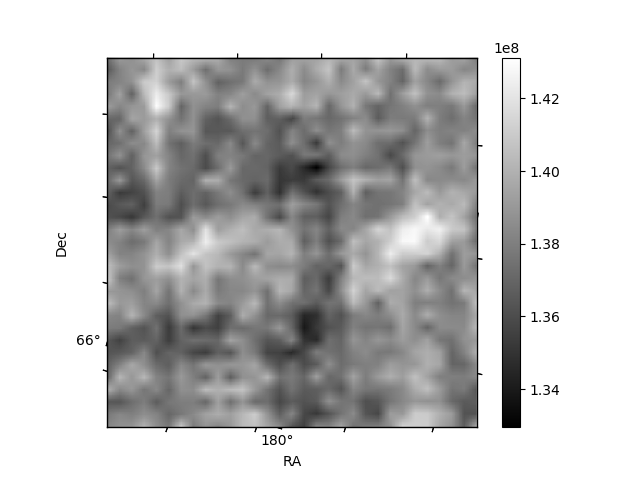
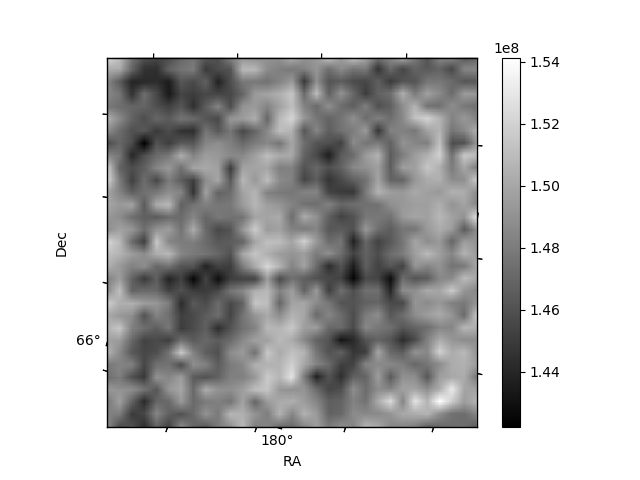
Histogram calculated using DETX and DETY for each event in the final _common_clean file
| Quadrant A | 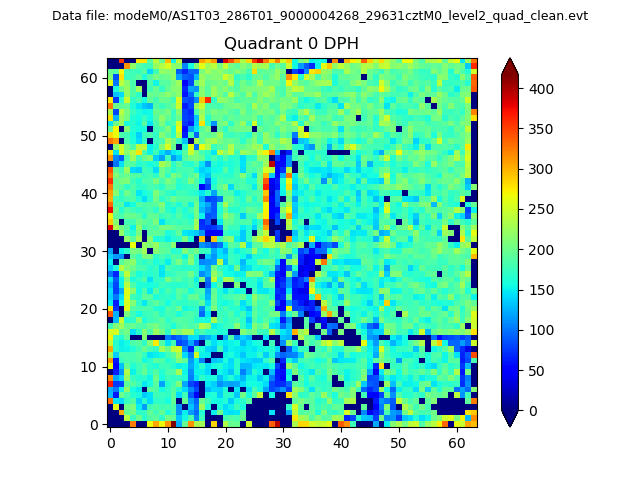 |
 |
Quadrant B |
|---|---|---|---|
| Quadrant D | 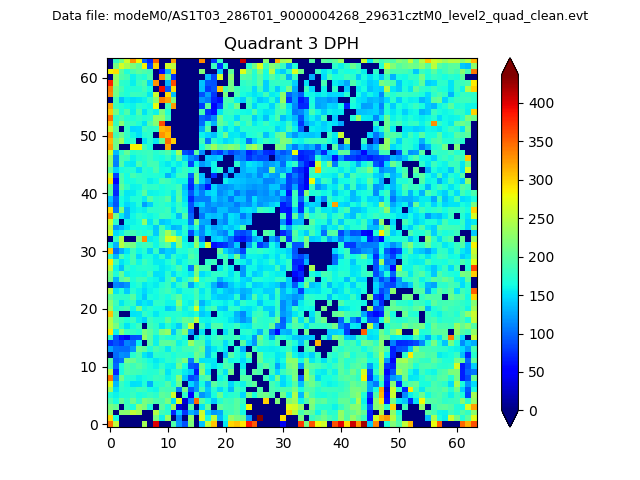 |
 |
Quadrant C |
| Plot type | Count rate plots | Images |
|---|---|---|
| Comparison with Poisson distribution Blue bars denote a histogram of data divided into 1 sec bins. Red curve is a Poisson curve with rate = median count rate of data. |
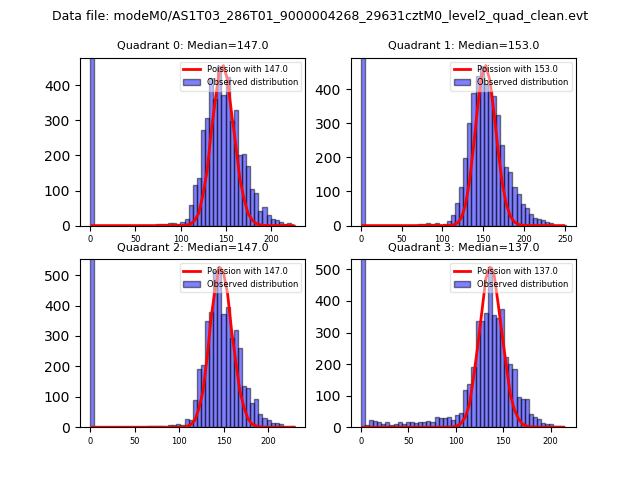 |
 |
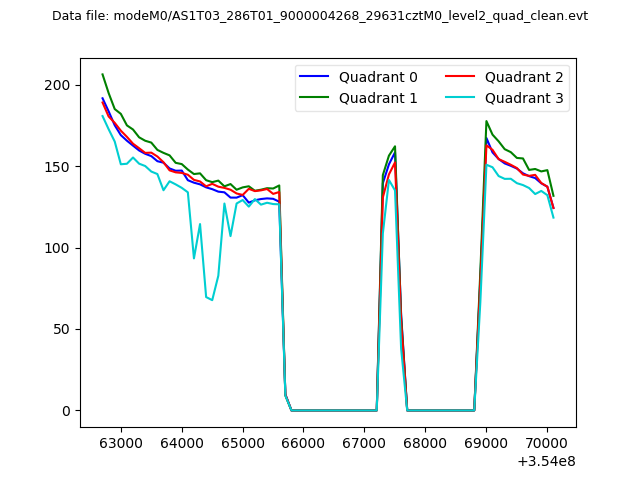
| Quadrant-wise count rates Data is divided into 100 sec bins |
 |
|
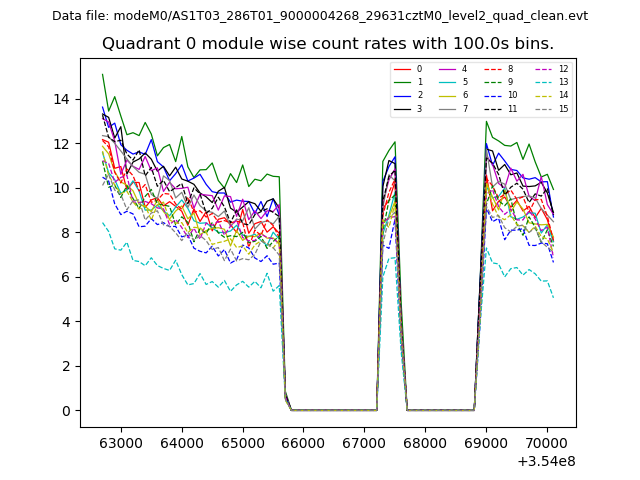
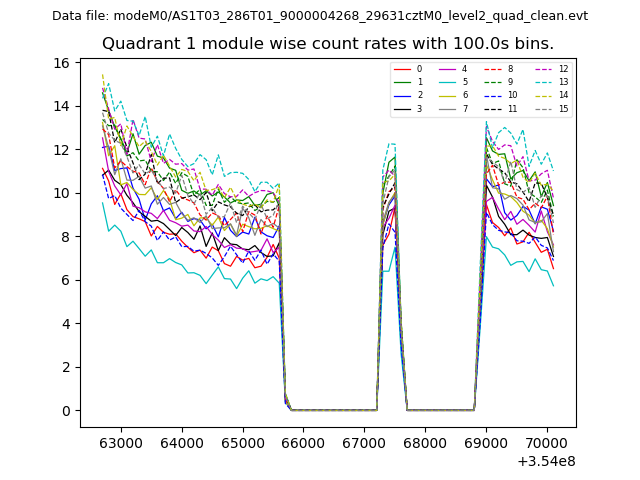
| Module-wise count rates for Quadrant A Data is divided into 100 sec bins |
 |
 |
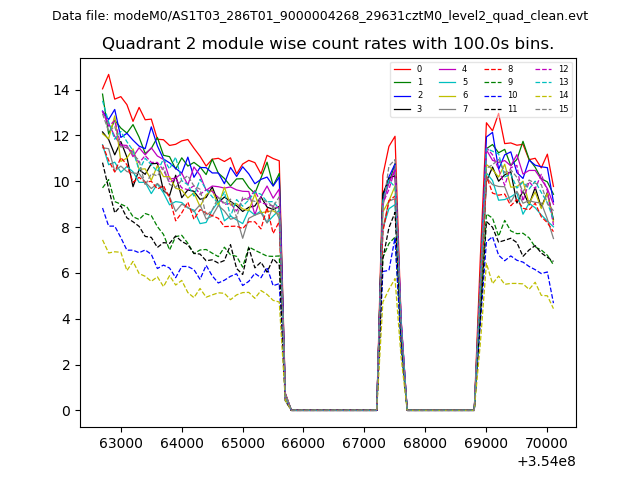
| Module-wise count rates for Quadrant B Data is divided into 100 sec bins |
 |
 |
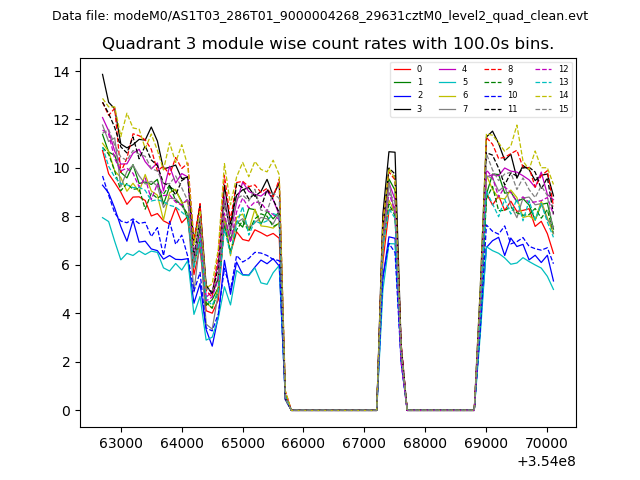
| Module-wise count rates for Quadrant C Data is divided into 100 sec bins |
 |
 |
| Module-wise count rates for Quadrant D Data is divided into 100 sec bins |
 |
 |
| Parameter | Plot |
|---|---|
| CZT HV Monitor | 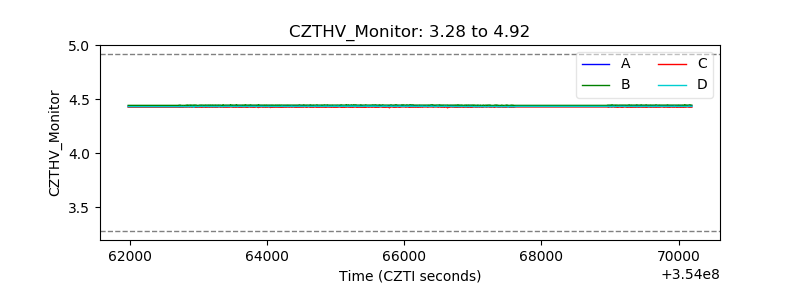 |
| D_VDD |  |
| Temperature 1 | 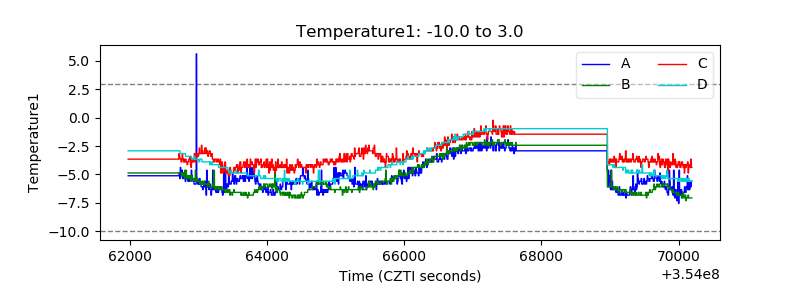 |
| Veto HV Monitor | 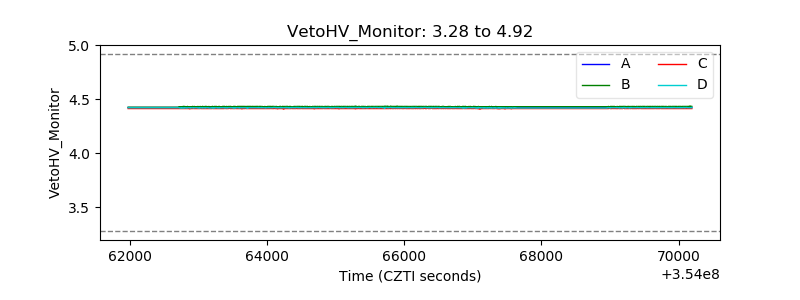 |
| Veto LLD | 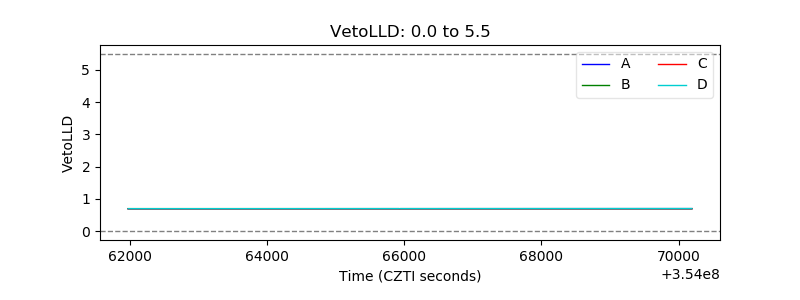 |
| Alpha Counter | 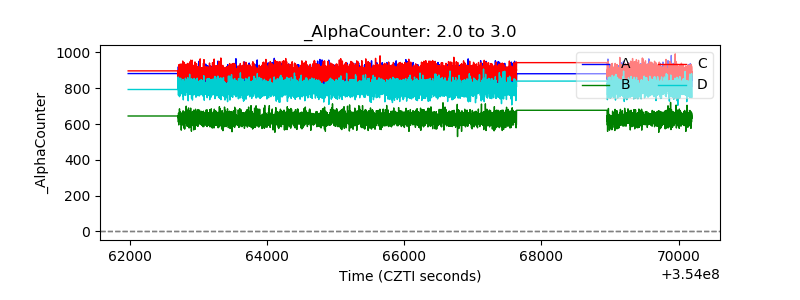 |
| _CPM_Rate | 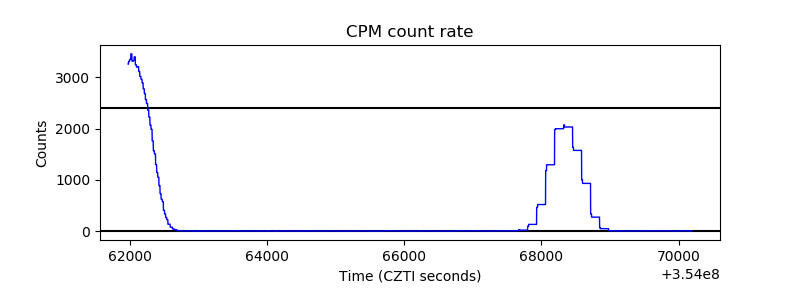 |
| CZT Counter | 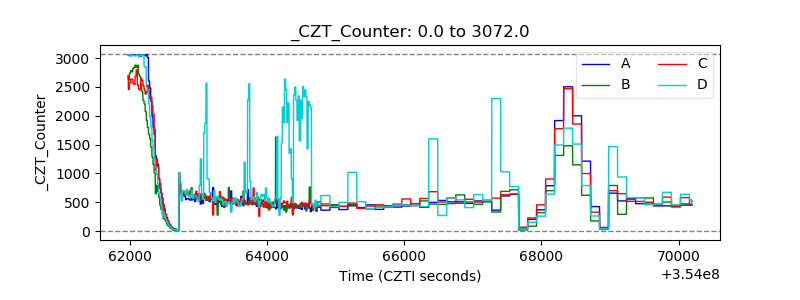 |
| +2.5 Volts monitor |  |
| +5 Volts monitor |  |
| _ROLL_ROT | 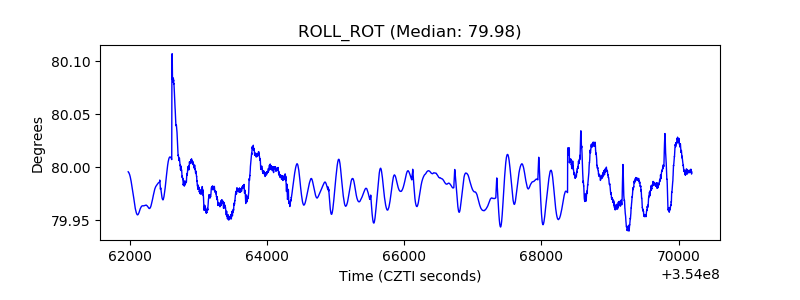 |
| _Roll_DEC | 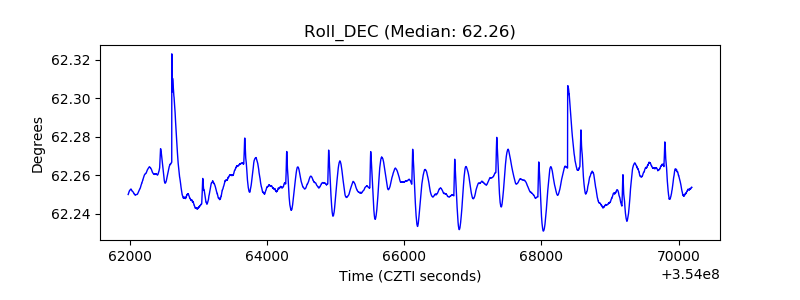 |
| _Roll_RA | 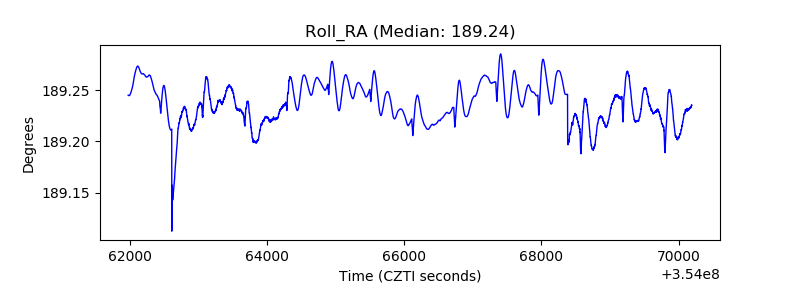 |
| Veto Counter | 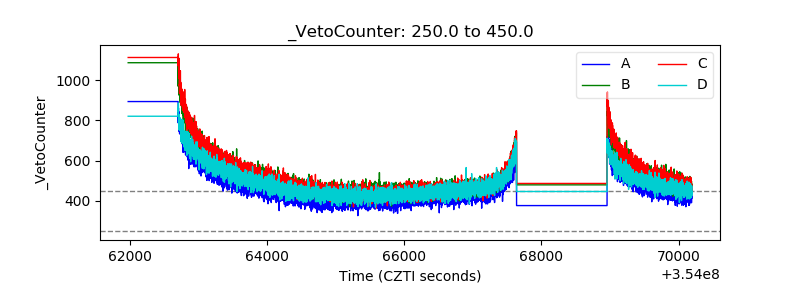 |