| Param | Original file | Final file |
|---|---|---|
| Filename | modeM0/AS1T03_286T01_9000004268_29632cztM0_level2.evt | modeM0/AS1T03_286T01_9000004268_29632cztM0_level2_quad_clean.evt |
| Size (bytes) | 478,494,720 | 101,977,920 |
| Size | 456.3 MB | 97.3 MB |
| Events in quadrant A | 3,171,323 | 665,823 |
| Events in quadrant B | 3,124,655 | 695,168 |
| Events in quadrant C | 3,137,879 | 665,212 |
| Events in quadrant D | 4,620,700 | 613,581 |
| Mode M9 | |||
|---|---|---|---|
| Quadrant | BADHDUFLAG | Total packets | Discarded packets |
| A | 0 | 15 | 0 |
| B | 0 | 16 | 0 |
| C | 0 | 16 | 0 |
| D | 0 | 16 | 0 |
| Mode SS | |||
|---|---|---|---|
| Quadrant | BADHDUFLAG | Total packets | Discarded packets |
| A | 0 | 130 | 0 |
| B | 0 | 130 | 0 |
| C | 0 | 130 | 0 |
| D | 0 | 130 | 0 |
| Mode M0 | |||
|---|---|---|---|
| Quadrant | BADHDUFLAG | Total packets | Discarded packets |
| A | 0 | 13786 | 2 |
| B | 0 | 13382 | 2 |
| C | 0 | 13461 | 2 |
| D | 0 | 18080 | 2 |
| Quadrant | Total seconds | Saturated seconds | Saturation percentage |
|---|---|---|---|
| A | 6431 | 32 | 0.497590% |
| B | 6431 | 22 | 0.342093% |
| C | 6431 | 68 | 1.057378% |
| D | 6431 | 435 | 6.764111% |
Noise dominated data is calculated using 1-second bins in cleaned event files. If a bin has >2000 counts, and if more than 50% of those come from <1% of pixels, then it is considered to be noise-dominated and hence unusable.
| Quadrant | # 1 sec bins | Bins with >0 counts | Bins with >2000 counts | High rate bins dominated by noise | Noise dominated (total time) | Noise dominated (detector-on time) | Marked lightcurve |
|---|---|---|---|---|---|---|---|
| A | 7636 | 6432 | 18 | 18 | 0.24% | 0.28% | 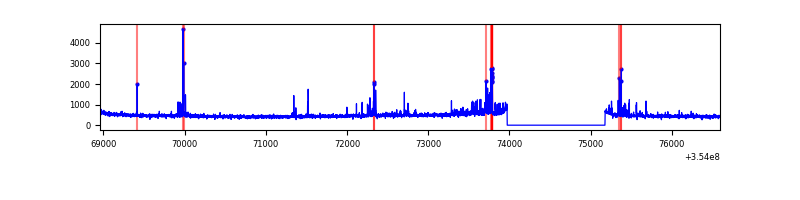 |
| B | 7636 | 6432 | 1 | 1 | 0.01% | 0.02% | 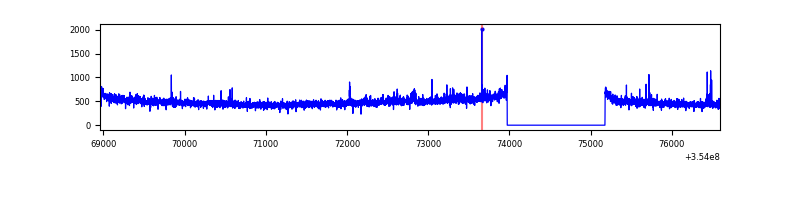 |
| C | 7636 | 6432 | 0 | 0 | 0.00% | 0.00% | 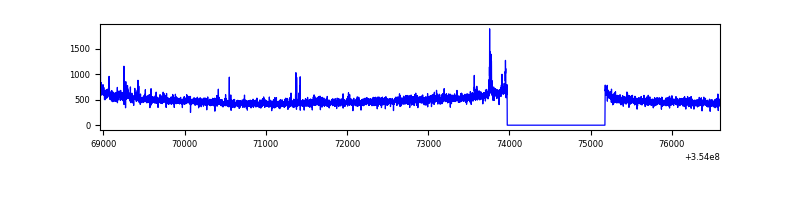 |
| D | 7636 | 6432 | 312 | 312 | 4.09% | 4.85% | 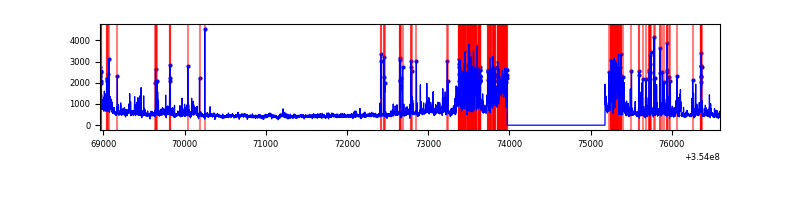 |
Top three noisy pixels from each quadrant. If the there are fewer than three noisy pixels in the level2.evt file, extra rows are filled as -1
| Pixel properties | Quadrant properties | ||||||
|---|---|---|---|---|---|---|---|
| Quadrant | DetID | PixID | Counts | Sigma | Mean | Median | Sigma |
| A | 12 | 96 | 209323 | 1356.18 | 767 | 752 | 153.8 |
| A | 13 | 254 | 10981 | 66.51 | 767 | 752 | 153.8 |
| A | 3 | 137 | 7361 | 42.97 | 767 | 752 | 153.8 |
| B | 0 | 189 | 19388 | 127.73 | 779 | 758 | 145.8 |
| B | 12 | 111 | 17841 | 117.13 | 779 | 758 | 145.8 |
| B | 0 | 190 | 17617 | 115.59 | 779 | 758 | 145.8 |
| C | 14 | 238 | 127273 | 720.34 | 750 | 755 | 175.6 |
| C | 7 | 247 | 30698 | 170.48 | 750 | 755 | 175.6 |
| C | 3 | 233 | 29801 | 165.38 | 750 | 755 | 175.6 |
| D | 7 | 238 | 823056 | 4834.15 | 720 | 701 | 170.1 |
| D | 7 | 80 | 503733 | 2957.03 | 720 | 701 | 170.1 |
| D | 8 | 195 | 314376 | 1843.91 | 720 | 701 | 170.1 |
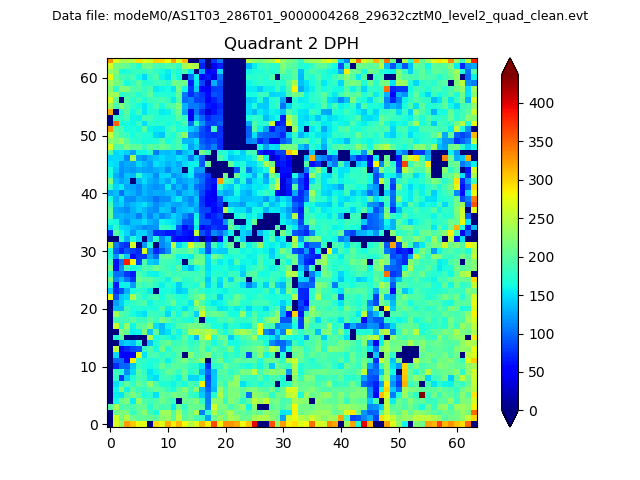
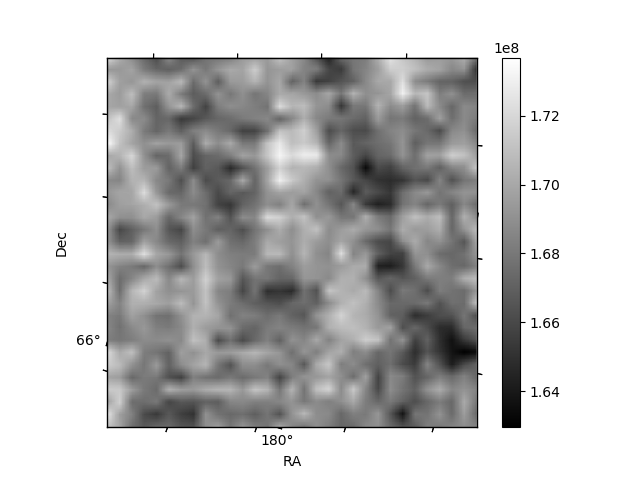
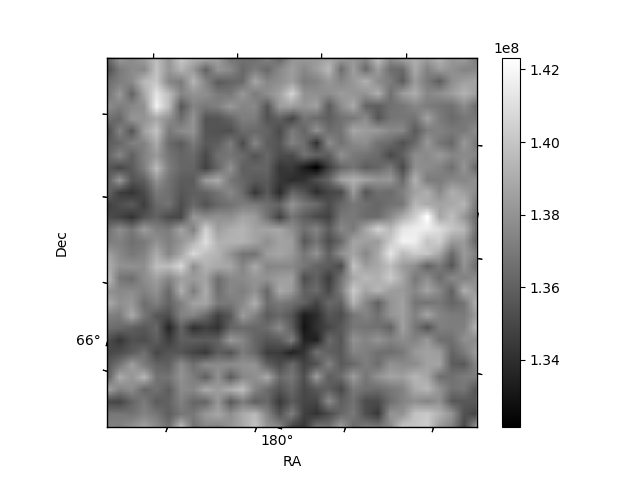
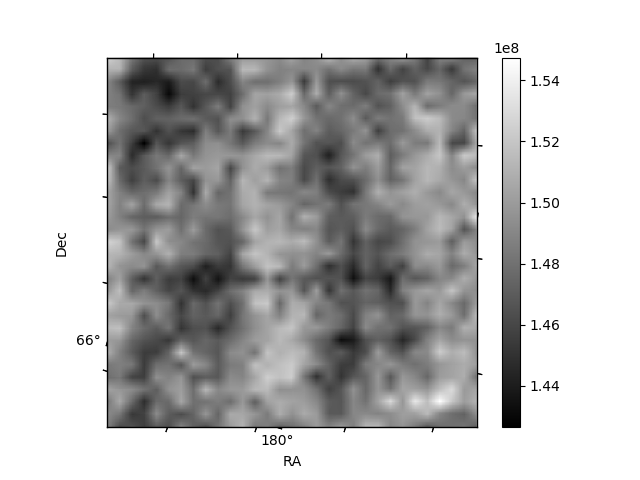
Histogram calculated using DETX and DETY for each event in the final _common_clean file
| Quadrant A | 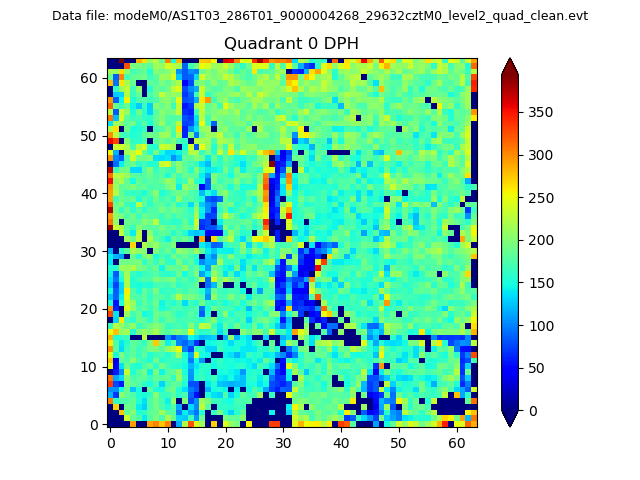 |
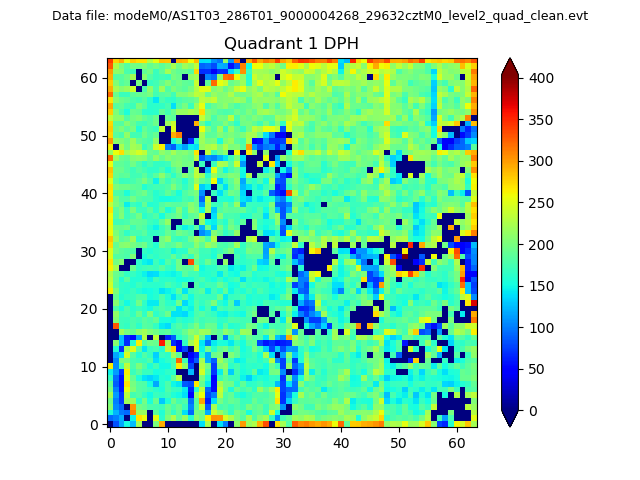 |
Quadrant B |
|---|---|---|---|
| Quadrant D | 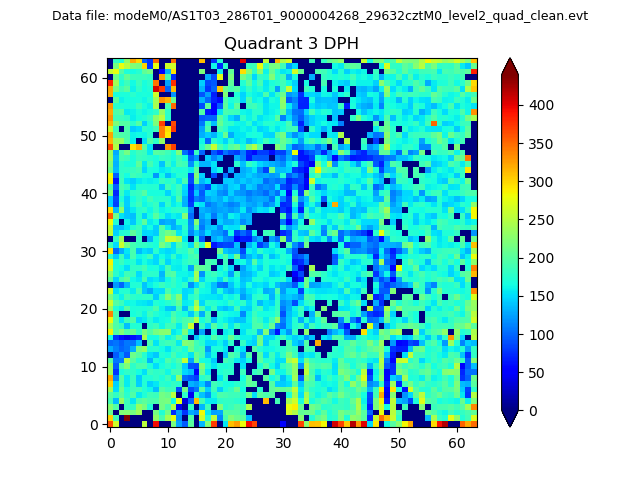 |
 |
Quadrant C |
| Plot type | Count rate plots | Images |
|---|---|---|
| Comparison with Poisson distribution Blue bars denote a histogram of data divided into 1 sec bins. Red curve is a Poisson curve with rate = median count rate of data. |
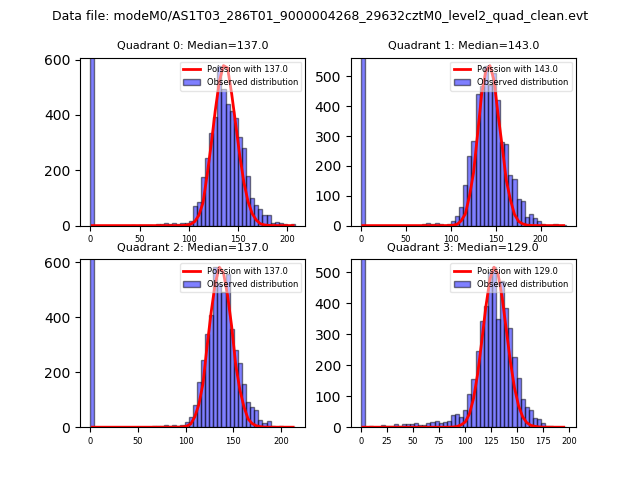 |
 |
| Quadrant-wise count rates Data is divided into 100 sec bins |
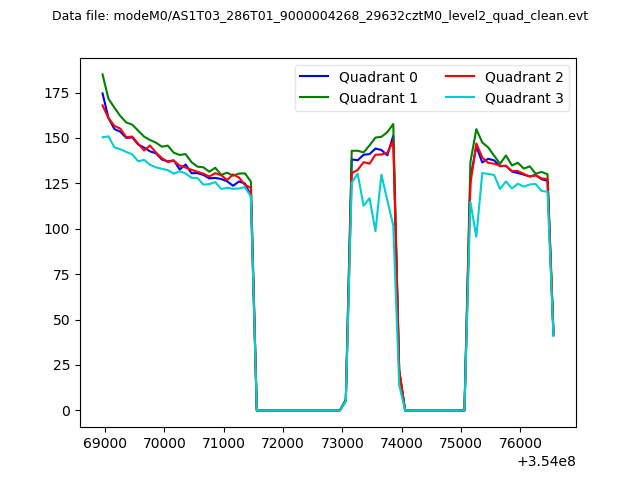 |
|
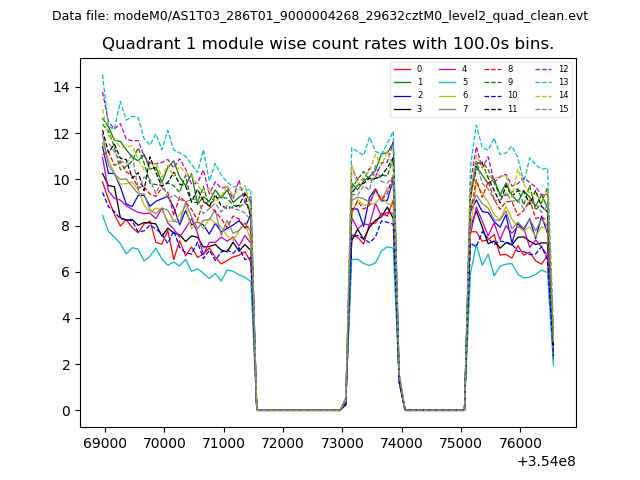
| Module-wise count rates for Quadrant A Data is divided into 100 sec bins |
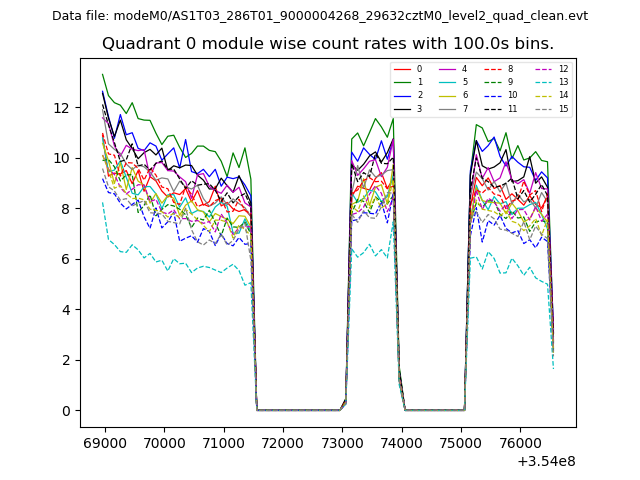 |
 |
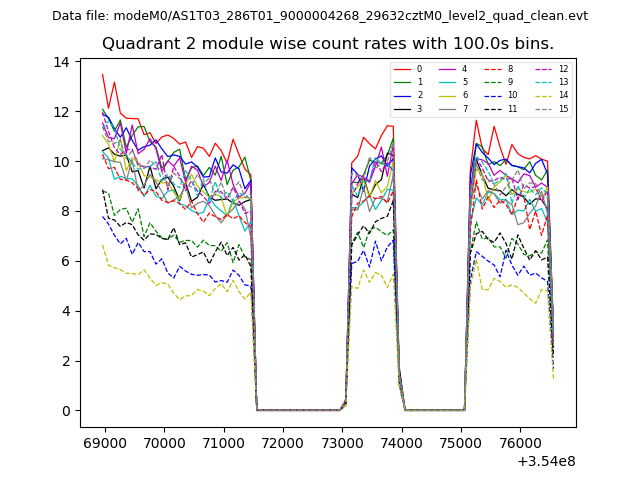
| Module-wise count rates for Quadrant B Data is divided into 100 sec bins |
 |
 |
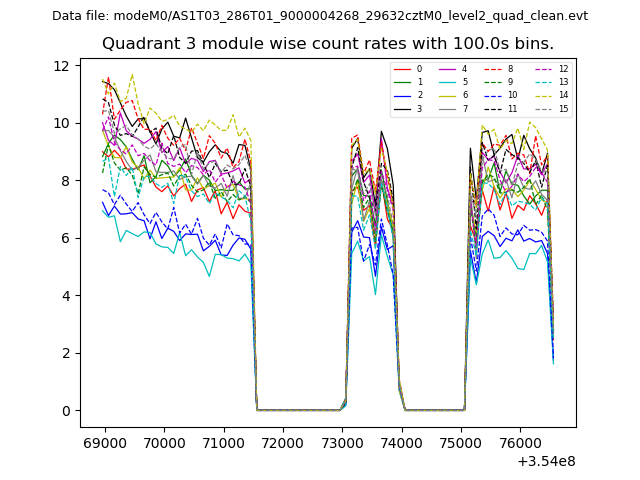
| Module-wise count rates for Quadrant C Data is divided into 100 sec bins |
 |
 |
| Module-wise count rates for Quadrant D Data is divided into 100 sec bins |
 |
 |
| Parameter | Plot |
|---|---|
| CZT HV Monitor | 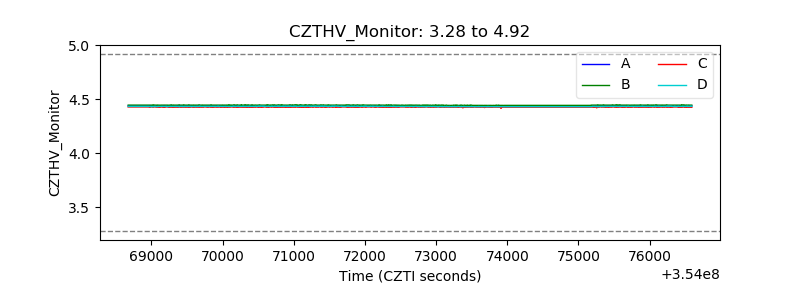 |
| D_VDD | 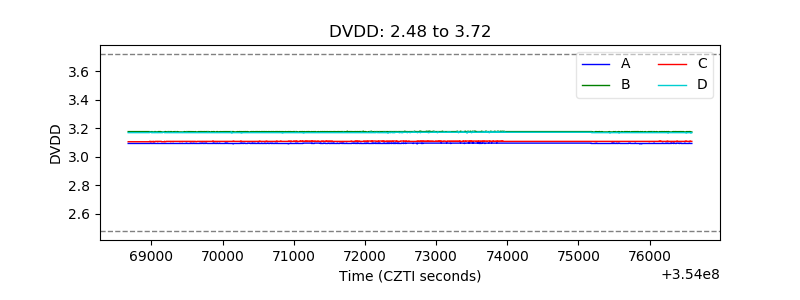 |
| Temperature 1 | 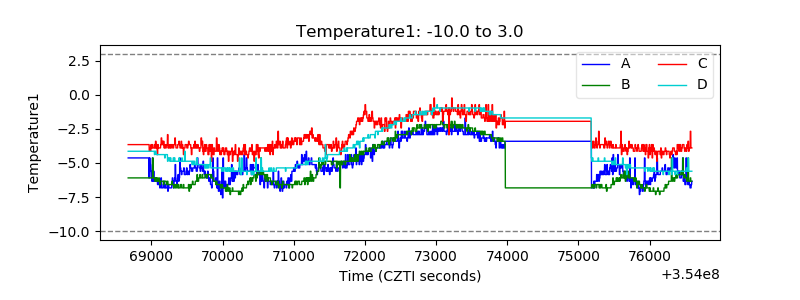 |
| Veto HV Monitor | 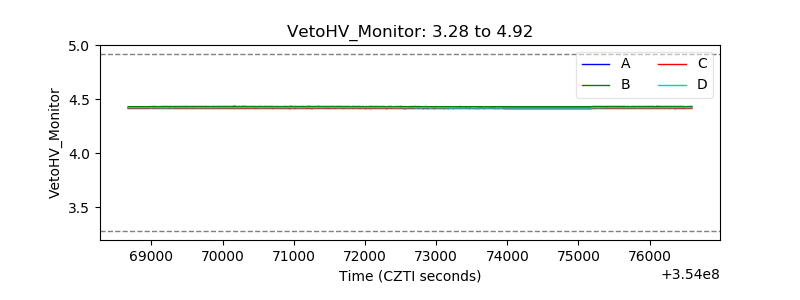 |
| Veto LLD | 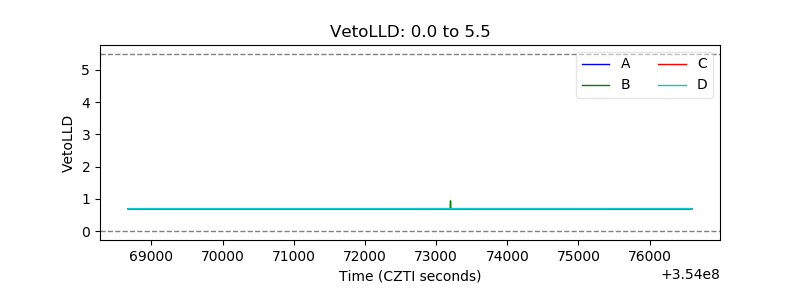 |
| Alpha Counter | 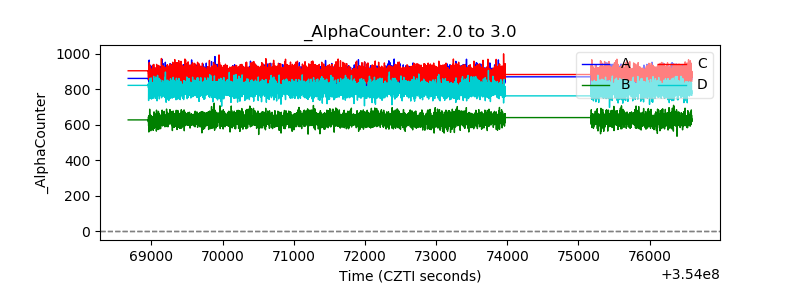 |
| _CPM_Rate | 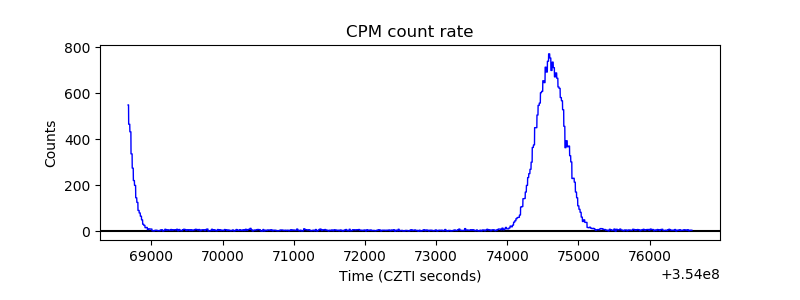 |
| CZT Counter |  |
| +2.5 Volts monitor |  |
| +5 Volts monitor | 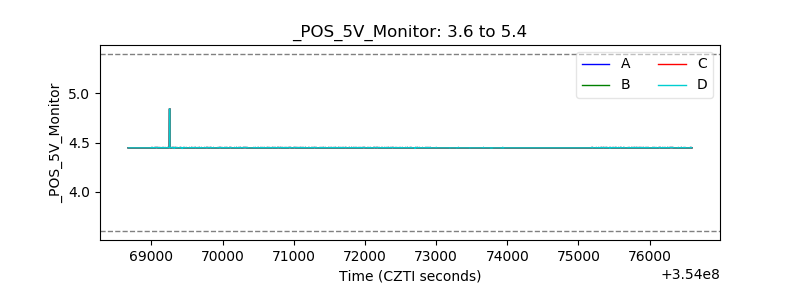 |
| _ROLL_ROT | 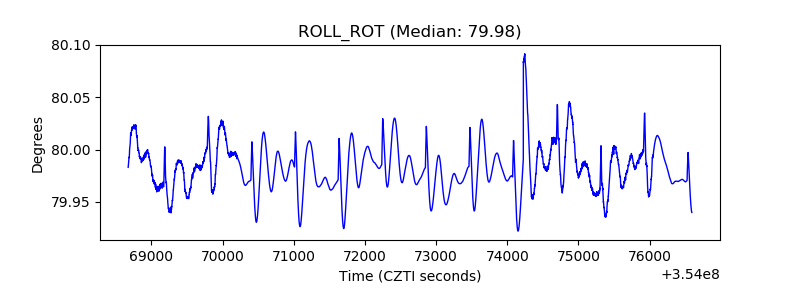 |
| _Roll_DEC | 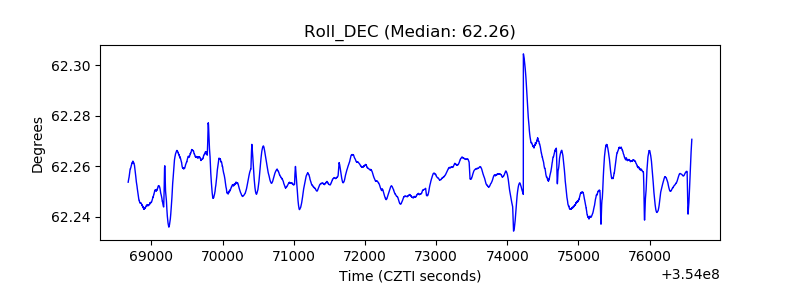 |
| _Roll_RA |  |
| Veto Counter | 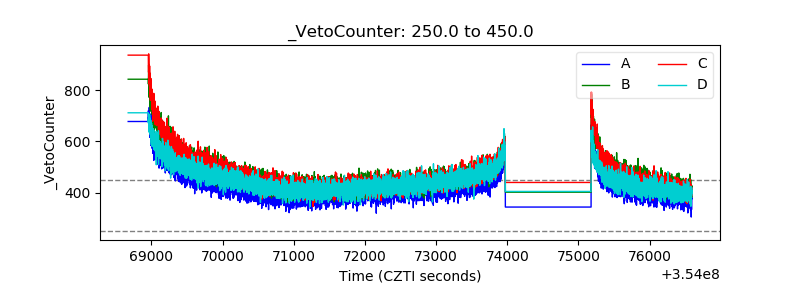 |