| Param | Original file | Final file |
|---|---|---|
| Filename | modeM0/AS1T03_286T01_9000004268_29634cztM0_level2.evt | modeM0/AS1T03_286T01_9000004268_29634cztM0_level2_quad_clean.evt |
| Size (bytes) | 535,046,400 | 108,766,080 |
| Size | 510.3 MB | 103.7 MB |
| Events in quadrant A | 3,307,964 | 708,221 |
| Events in quadrant B | 3,382,553 | 725,789 |
| Events in quadrant C | 3,551,364 | 700,443 |
| Events in quadrant D | 5,471,453 | 656,319 |
| Mode M9 | |||
|---|---|---|---|
| Quadrant | BADHDUFLAG | Total packets | Discarded packets |
| A | 0 | 3 | 0 |
| B | 0 | 3 | 0 |
| C | 0 | 3 | 0 |
| D | 0 | 3 | 0 |
| Mode SS | |||
|---|---|---|---|
| Quadrant | BADHDUFLAG | Total packets | Discarded packets |
| A | 0 | 148 | 0 |
| B | 0 | 148 | 0 |
| C | 0 | 148 | 0 |
| D | 0 | 148 | 0 |
| Mode M0 | |||
|---|---|---|---|
| Quadrant | BADHDUFLAG | Total packets | Discarded packets |
| A | 0 | 14818 | 1 |
| B | 0 | 14889 | 1 |
| C | 0 | 15297 | 1 |
| D | 0 | 21243 | 1 |
| Quadrant | Total seconds | Saturated seconds | Saturation percentage |
|---|---|---|---|
| A | 7219 | 82 | 1.135891% |
| B | 7220 | 120 | 1.662050% |
| C | 7220 | 251 | 3.476454% |
| D | 7219 | 473 | 6.552154% |
Noise dominated data is calculated using 1-second bins in cleaned event files. If a bin has >2000 counts, and if more than 50% of those come from <1% of pixels, then it is considered to be noise-dominated and hence unusable.
| Quadrant | # 1 sec bins | Bins with >0 counts | Bins with >2000 counts | High rate bins dominated by noise | Noise dominated (total time) | Noise dominated (detector-on time) | Marked lightcurve |
|---|---|---|---|---|---|---|---|
| A | 7569 | 7220 | 0 | 0 | 0.00% | 0.00% |  |
| B | 7570 | 7221 | 2 | 2 | 0.03% | 0.03% |  |
| C | 7570 | 7221 | 7 | 7 | 0.09% | 0.10% |  |
| D | 7569 | 7220 | 419 | 419 | 5.54% | 5.80% | 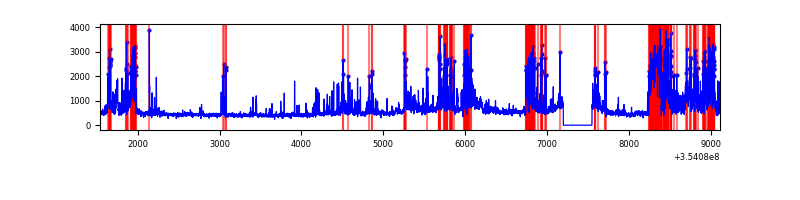 |
Top three noisy pixels from each quadrant. If the there are fewer than three noisy pixels in the level2.evt file, extra rows are filled as -1
| Pixel properties | Quadrant properties | ||||||
|---|---|---|---|---|---|---|---|
| Quadrant | DetID | PixID | Counts | Sigma | Mean | Median | Sigma |
| A | 12 | 96 | 69611 | 408.93 | 839 | 820 | 168.2 |
| A | 13 | 254 | 12369 | 68.65 | 839 | 820 | 168.2 |
| A | 3 | 137 | 8609 | 46.3 | 839 | 820 | 168.2 |
| B | 0 | 230 | 28277 | 171.31 | 840 | 815 | 160.3 |
| B | 0 | 229 | 24433 | 147.33 | 840 | 815 | 160.3 |
| B | 0 | 190 | 22276 | 133.88 | 840 | 815 | 160.3 |
| C | 14 | 238 | 191747 | 1018.15 | 806 | 810 | 187.5 |
| C | 14 | 254 | 89613 | 473.53 | 806 | 810 | 187.5 |
| C | 10 | 22 | 85706 | 452.7 | 806 | 810 | 187.5 |
| D | 7 | 238 | 1111887 | 5915.04 | 796 | 773 | 187.8 |
| D | 7 | 80 | 465117 | 2471.95 | 796 | 773 | 187.8 |
| D | 8 | 195 | 428869 | 2278.98 | 796 | 773 | 187.8 |
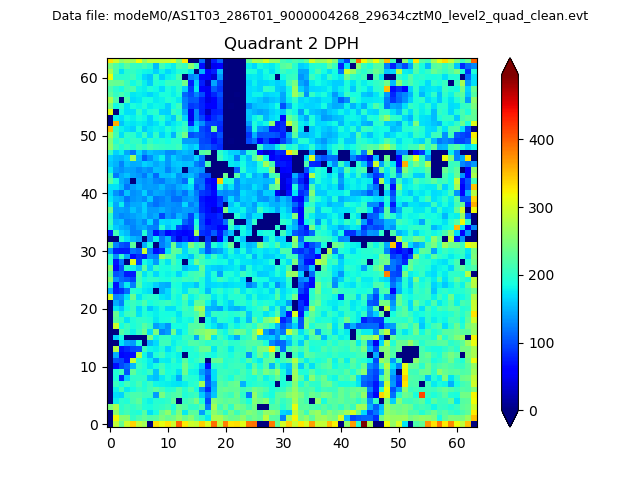
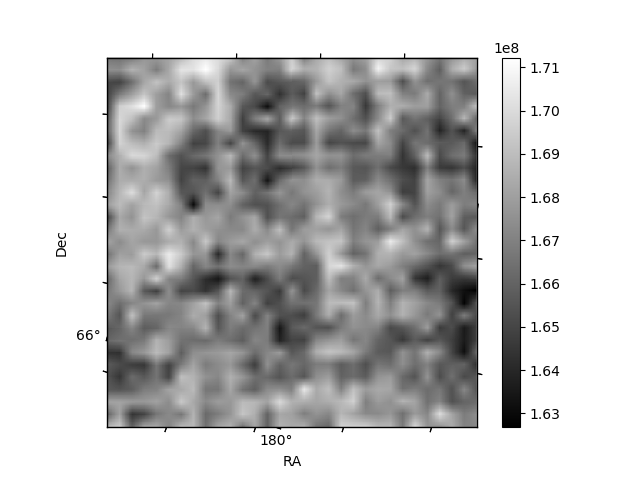
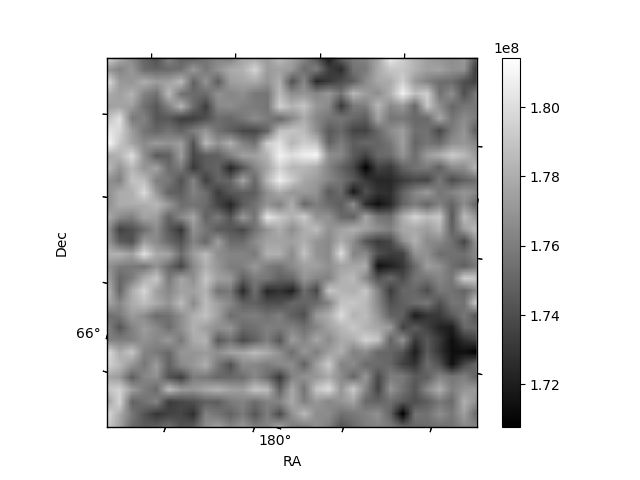
Histogram calculated using DETX and DETY for each event in the final _common_clean file
| Quadrant A | 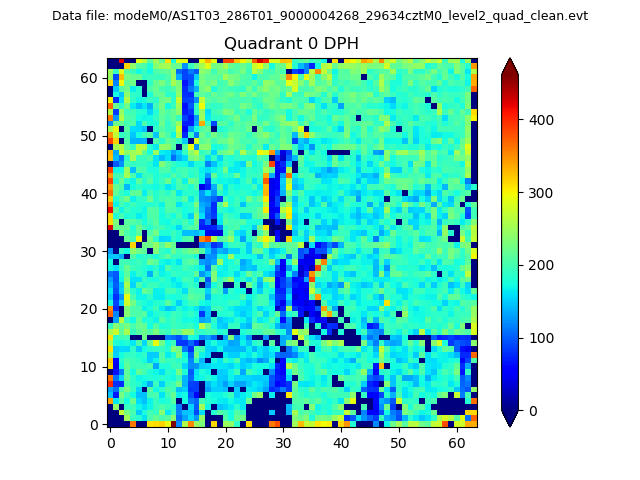 |
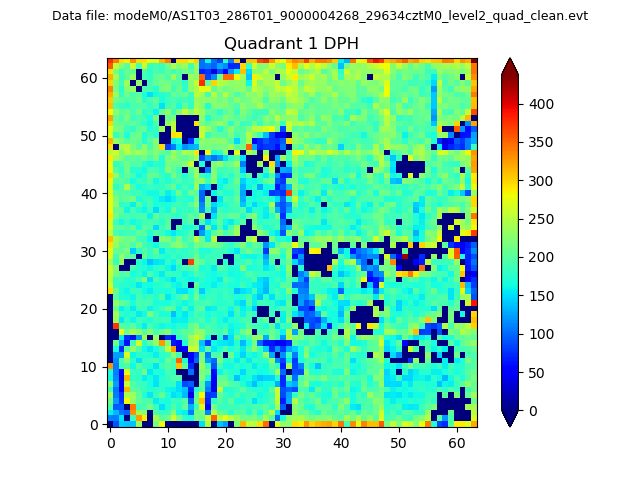 |
Quadrant B |
|---|---|---|---|
| Quadrant D | 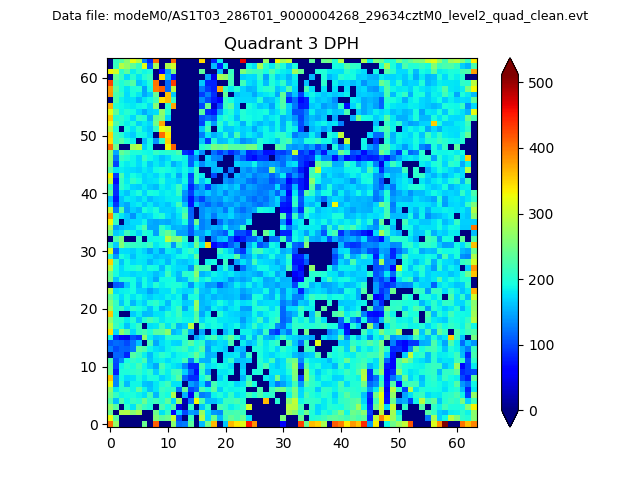 |
 |
Quadrant C |
| Plot type | Count rate plots | Images |
|---|---|---|
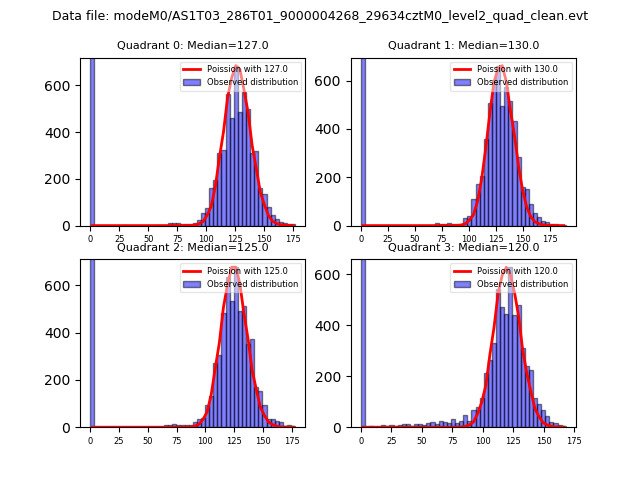
| Comparison with Poisson distribution Blue bars denote a histogram of data divided into 1 sec bins. Red curve is a Poisson curve with rate = median count rate of data. |
 |
 |
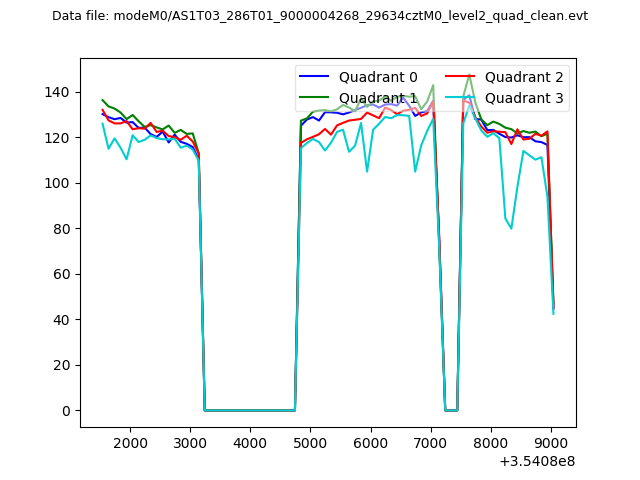
| Quadrant-wise count rates Data is divided into 100 sec bins |
 |
|
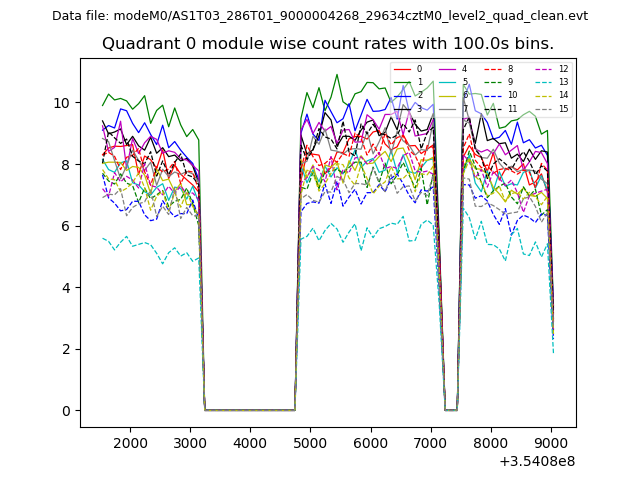
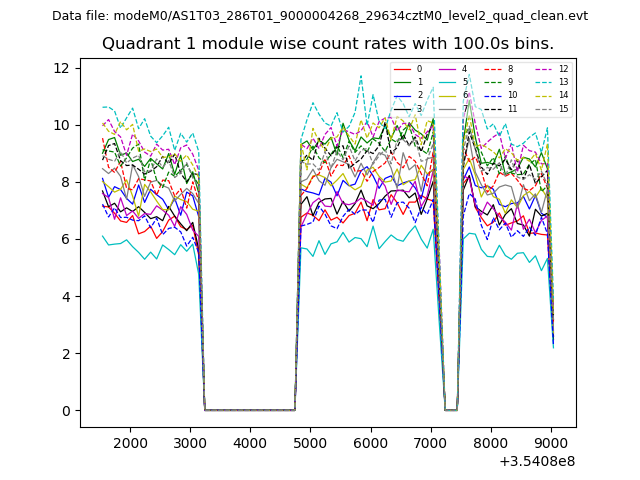
| Module-wise count rates for Quadrant A Data is divided into 100 sec bins |
 |
 |
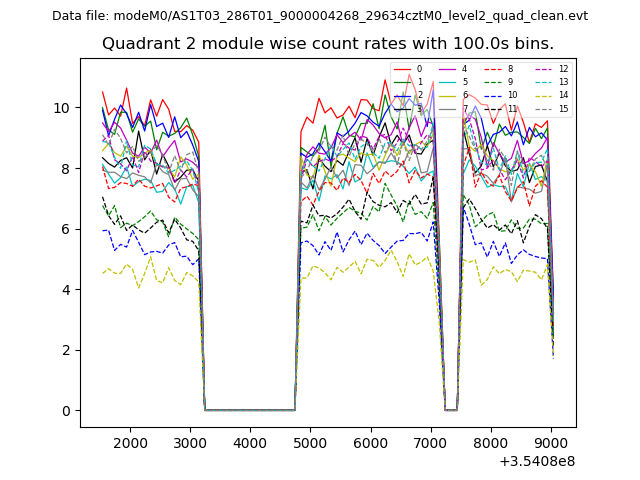
| Module-wise count rates for Quadrant B Data is divided into 100 sec bins |
 |
 |
| Module-wise count rates for Quadrant C Data is divided into 100 sec bins |
 |
 |
| Module-wise count rates for Quadrant D Data is divided into 100 sec bins |
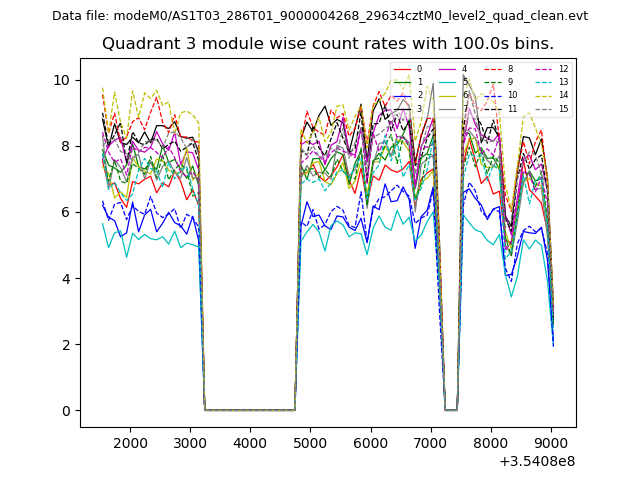 |
 |
| Parameter | Plot |
|---|---|
| CZT HV Monitor | 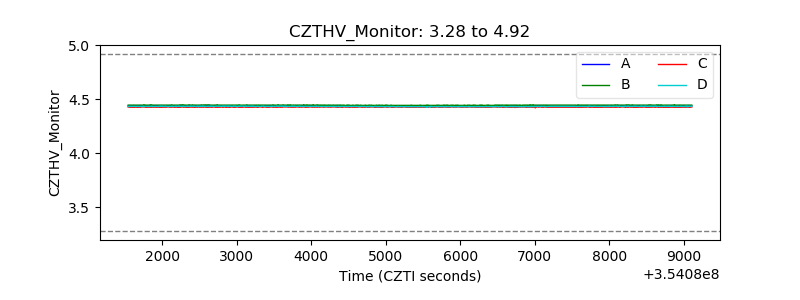 |
| D_VDD | 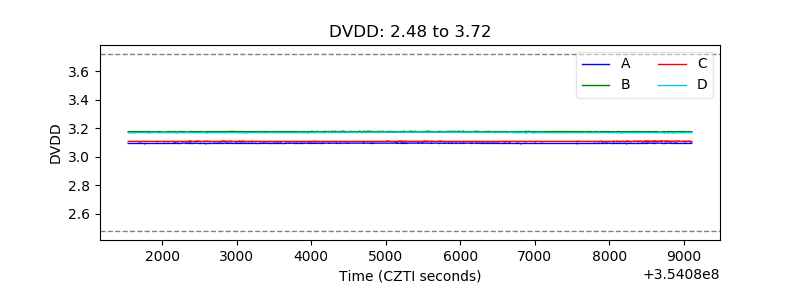 |
| Temperature 1 | 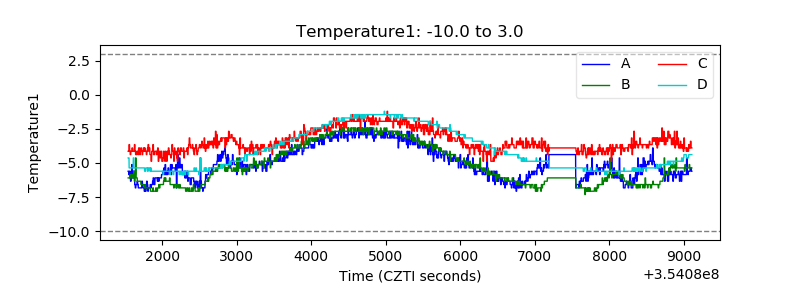 |
| Veto HV Monitor |  |
| Veto LLD | 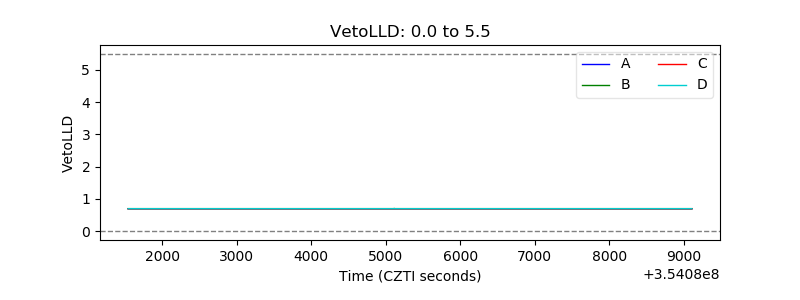 |
| Alpha Counter | 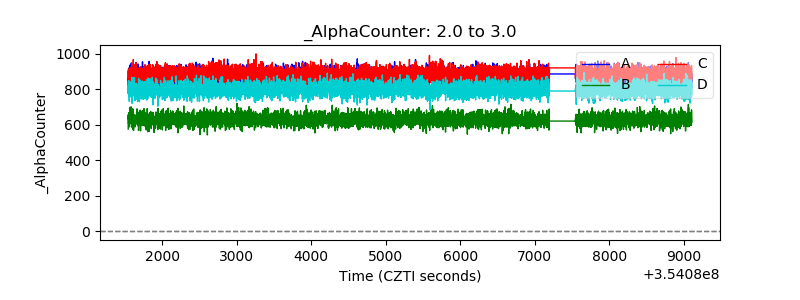 |
| _CPM_Rate | 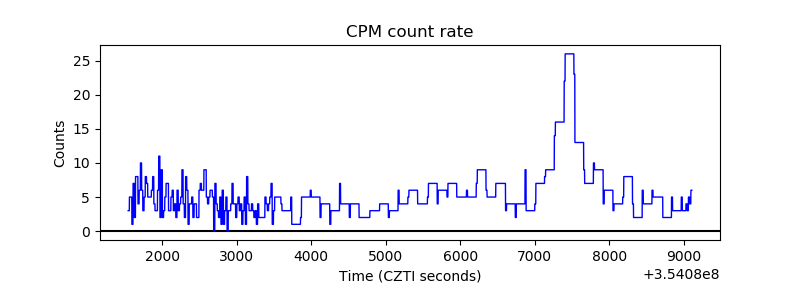 |
| CZT Counter | 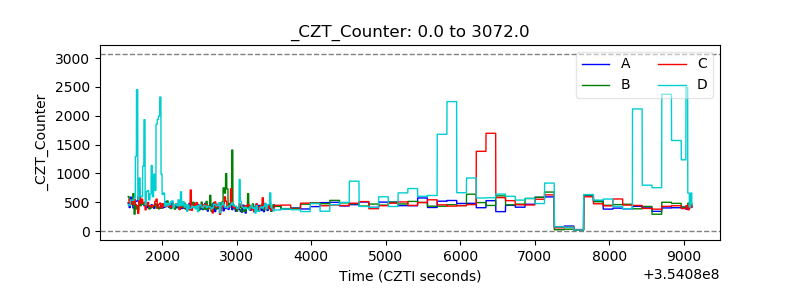 |
| +2.5 Volts monitor | 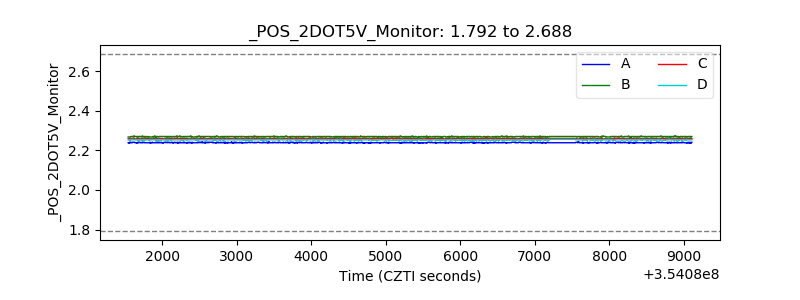 |
| +5 Volts monitor | 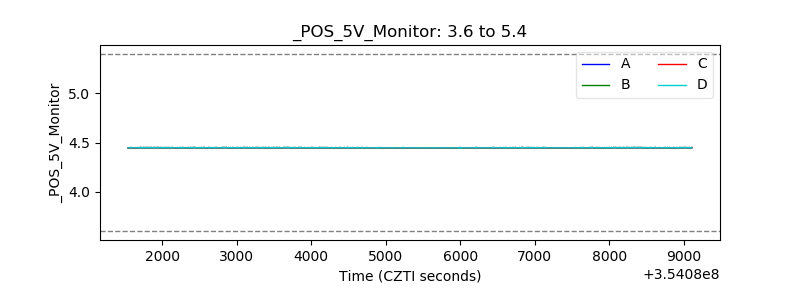 |
| _ROLL_ROT | 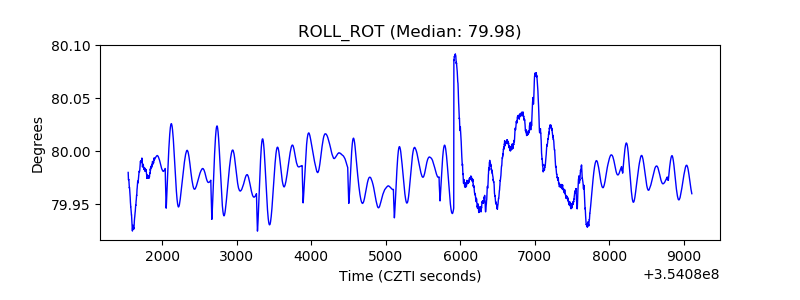 |
| _Roll_DEC | 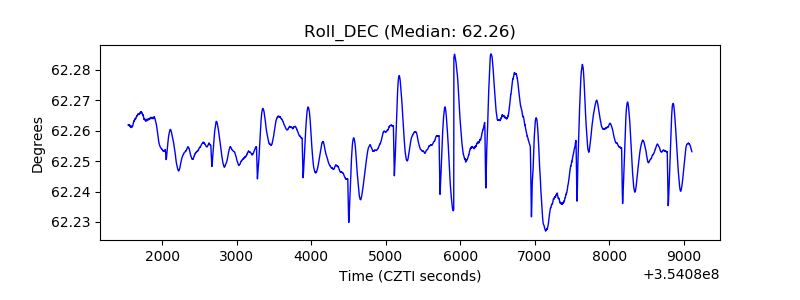 |
| _Roll_RA | 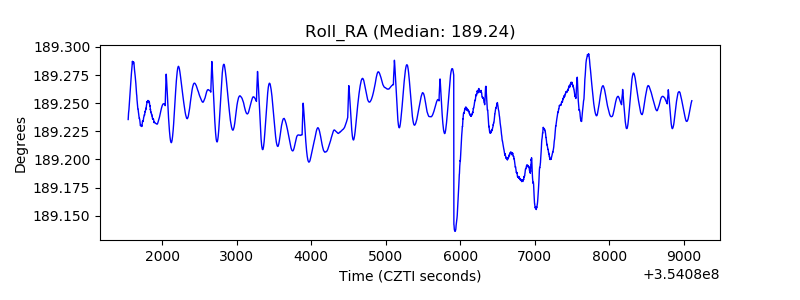 |
| Veto Counter | 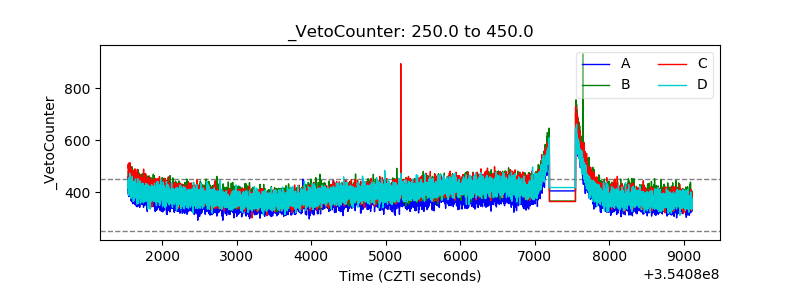 |