| Param | Original file | Final file |
|---|---|---|
| Filename | modeM0/AS1T03_286T01_9000004268_29635cztM0_level2.evt | modeM0/AS1T03_286T01_9000004268_29635cztM0_level2_quad_clean.evt |
| Size (bytes) | 600,981,120 | 95,063,040 |
| Size | 573.1 MB | 90.7 MB |
| Events in quadrant A | 3,269,016 | 613,943 |
| Events in quadrant B | 3,490,375 | 618,729 |
| Events in quadrant C | 3,470,804 | 601,848 |
| Events in quadrant D | 7,486,940 | 546,915 |
| Mode M9 | |||
|---|---|---|---|
| Quadrant | BADHDUFLAG | Total packets | Discarded packets |
| A | 0 | 1 | 0 |
| B | 0 | 1 | 0 |
| C | 0 | 1 | 0 |
| D | 0 | 1 | 0 |
| Mode SS | |||
|---|---|---|---|
| Quadrant | BADHDUFLAG | Total packets | Discarded packets |
| A | 0 | 144 | 0 |
| B | 0 | 144 | 0 |
| C | 0 | 144 | 0 |
| D | 0 | 144 | 0 |
| Mode M0 | |||
|---|---|---|---|
| Quadrant | BADHDUFLAG | Total packets | Discarded packets |
| A | 0 | 14700 | 1 |
| B | 0 | 15115 | 1 |
| C | 0 | 15086 | 1 |
| D | 0 | 27113 | 1 |
| Quadrant | Total seconds | Saturated seconds | Saturation percentage |
|---|---|---|---|
| A | 7137 | 190 | 2.662183% |
| B | 7137 | 264 | 3.699033% |
| C | 7137 | 397 | 5.562561% |
| D | 7138 | 940 | 13.168955% |
Noise dominated data is calculated using 1-second bins in cleaned event files. If a bin has >2000 counts, and if more than 50% of those come from <1% of pixels, then it is considered to be noise-dominated and hence unusable.
| Quadrant | # 1 sec bins | Bins with >0 counts | Bins with >2000 counts | High rate bins dominated by noise | Noise dominated (total time) | Noise dominated (detector-on time) | Marked lightcurve |
|---|---|---|---|---|---|---|---|
| A | 7222 | 7138 | 0 | 0 | 0.00% | 0.00% |  |
| B | 7222 | 7138 | 39 | 39 | 0.54% | 0.55% |  |
| C | 7222 | 7139 | 1 | 1 | 0.01% | 0.01% |  |
| D | 7223 | 7139 | 781 | 781 | 10.81% | 10.94% |  |
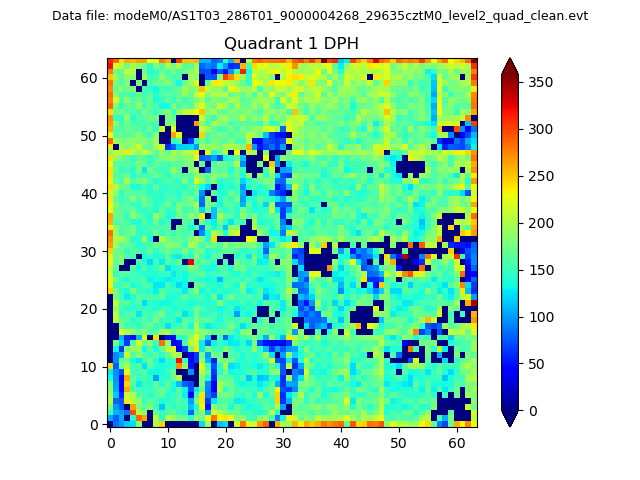
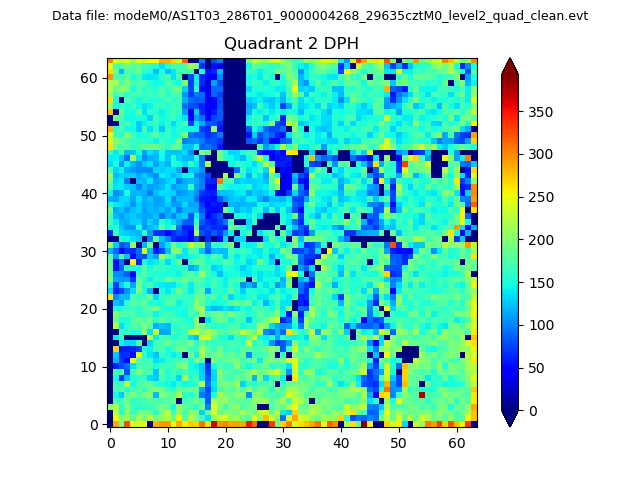
Top three noisy pixels from each quadrant. If the there are fewer than three noisy pixels in the level2.evt file, extra rows are filled as -1
| Pixel properties | Quadrant properties | ||||||
|---|---|---|---|---|---|---|---|
| Quadrant | DetID | PixID | Counts | Sigma | Mean | Median | Sigma |
| A | 0 | 13 | 34654 | 200.28 | 837 | 817 | 168.9 |
| A | 13 | 254 | 11788 | 64.94 | 837 | 817 | 168.9 |
| A | 3 | 137 | 8843 | 47.51 | 837 | 817 | 168.9 |
| B | 15 | 33 | 179522 | 1144.0 | 826 | 803 | 156.2 |
| B | 0 | 189 | 23506 | 145.32 | 826 | 803 | 156.2 |
| B | 12 | 111 | 20322 | 124.94 | 826 | 803 | 156.2 |
| C | 14 | 238 | 192241 | 1024.26 | 801 | 805 | 186.9 |
| C | 14 | 254 | 88355 | 468.43 | 801 | 805 | 186.9 |
| C | 15 | 208 | 27414 | 142.37 | 801 | 805 | 186.9 |
| D | 7 | 238 | 3348560 | 18307.59 | 770 | 746 | 182.9 |
| D | 8 | 195 | 518609 | 2831.94 | 770 | 746 | 182.9 |
| D | 7 | 80 | 388179 | 2118.69 | 770 | 746 | 182.9 |
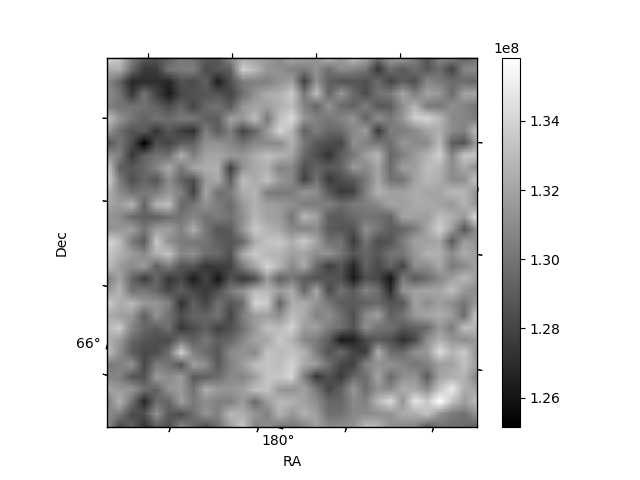
Histogram calculated using DETX and DETY for each event in the final _common_clean file
| Quadrant A | 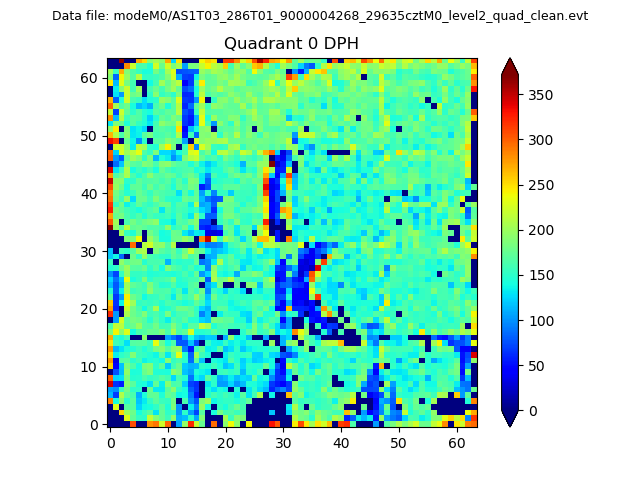 |
 |
Quadrant B |
|---|---|---|---|
| Quadrant D | 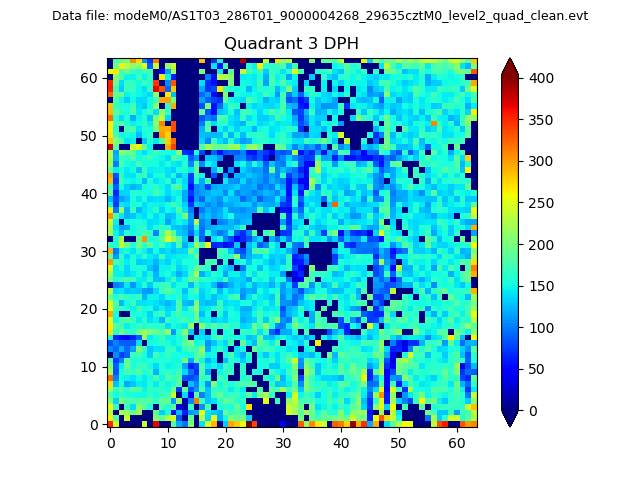 |
 |
Quadrant C |
| Plot type | Count rate plots | Images |
|---|---|---|
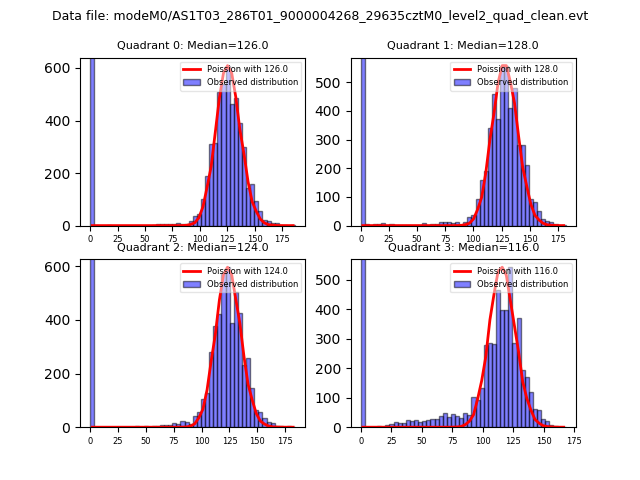
| Comparison with Poisson distribution Blue bars denote a histogram of data divided into 1 sec bins. Red curve is a Poisson curve with rate = median count rate of data. |
 |
 |
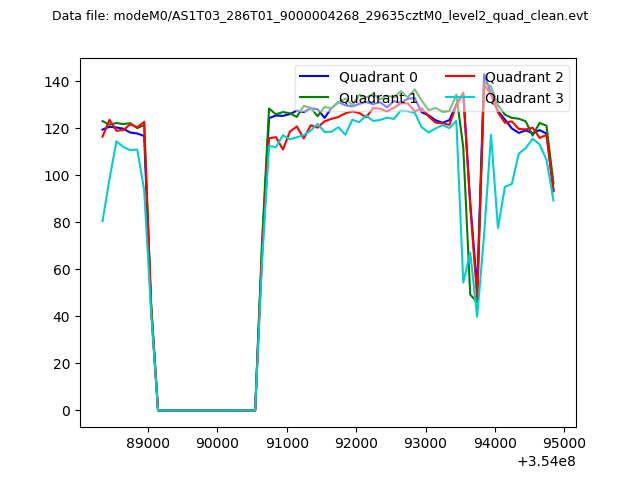
| Quadrant-wise count rates Data is divided into 100 sec bins |
 |
|
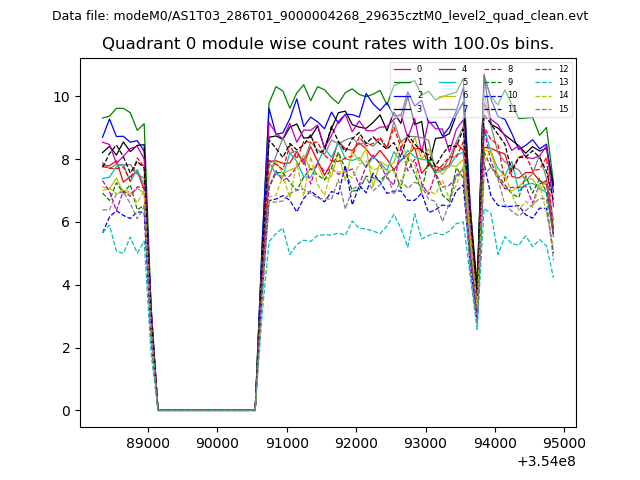
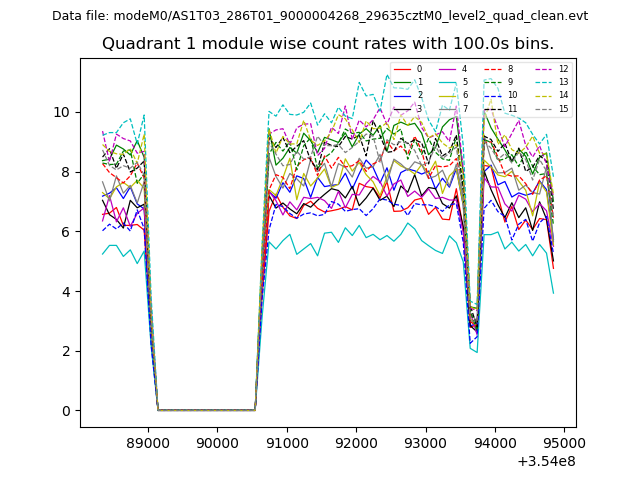
| Module-wise count rates for Quadrant A Data is divided into 100 sec bins |
 |
 |
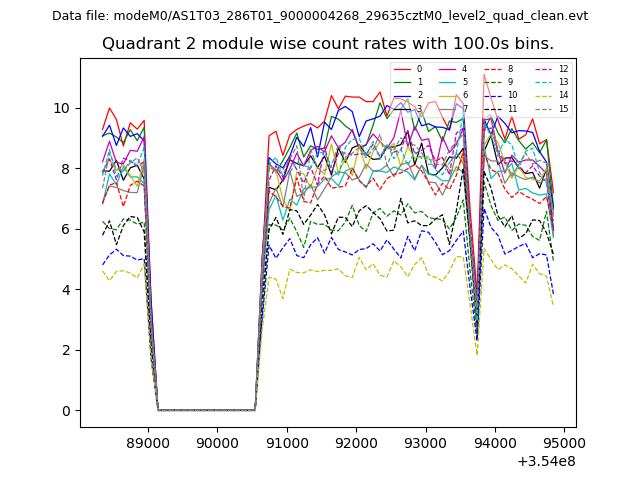
| Module-wise count rates for Quadrant B Data is divided into 100 sec bins |
 |
 |
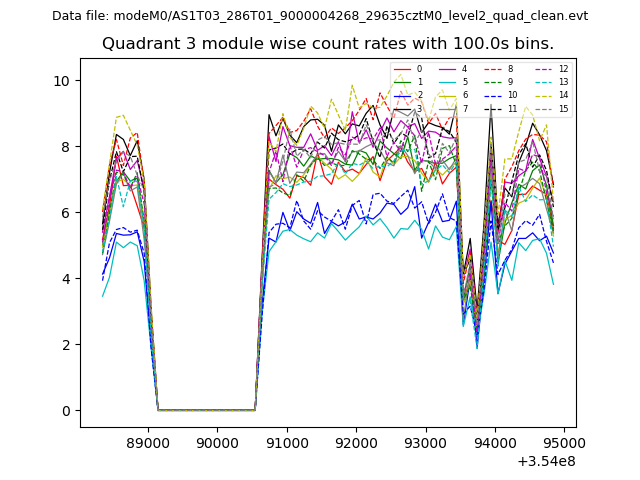
| Module-wise count rates for Quadrant C Data is divided into 100 sec bins |
 |
 |
| Module-wise count rates for Quadrant D Data is divided into 100 sec bins |
 |
 |
| Parameter | Plot |
|---|---|
| CZT HV Monitor | 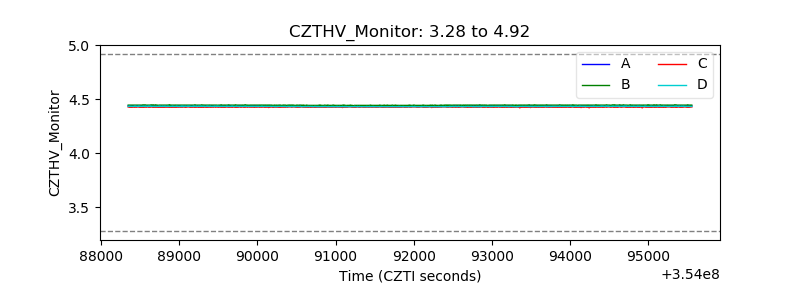 |
| D_VDD | 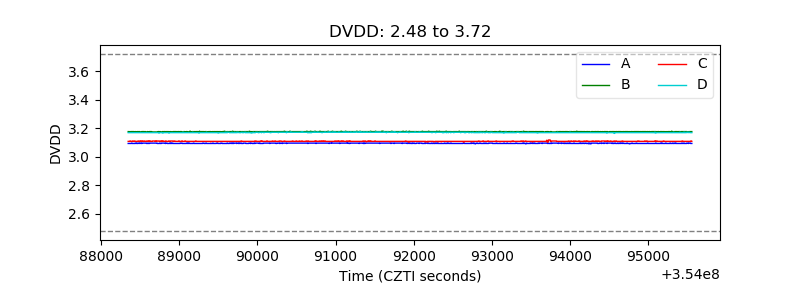 |
| Temperature 1 | 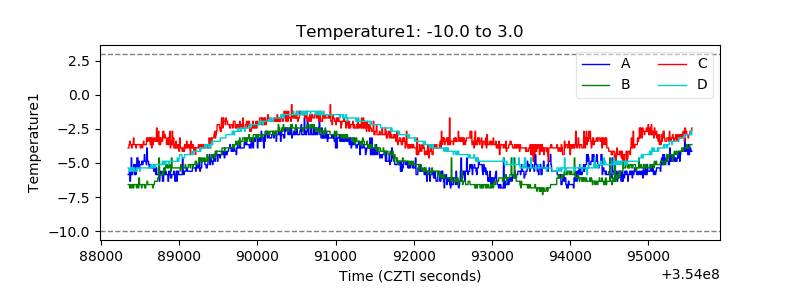 |
| Veto HV Monitor | 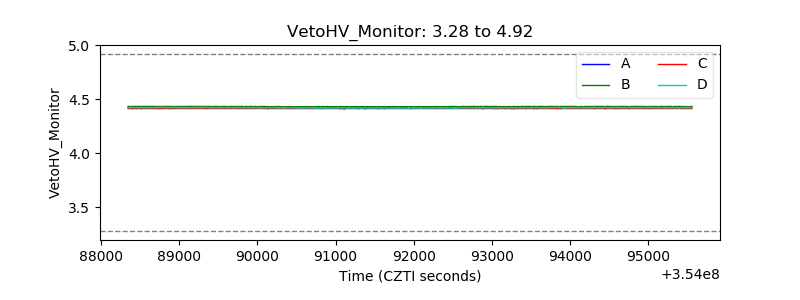 |
| Veto LLD | 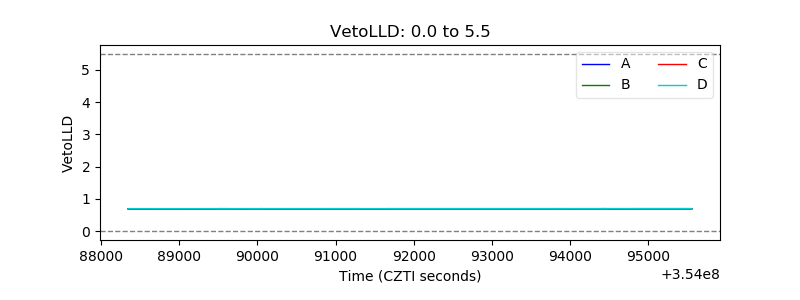 |
| Alpha Counter | 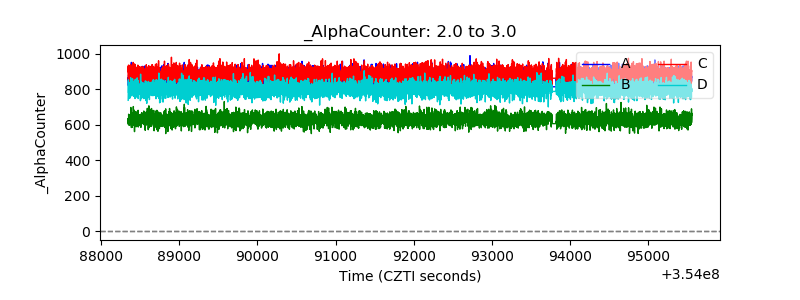 |
| _CPM_Rate | 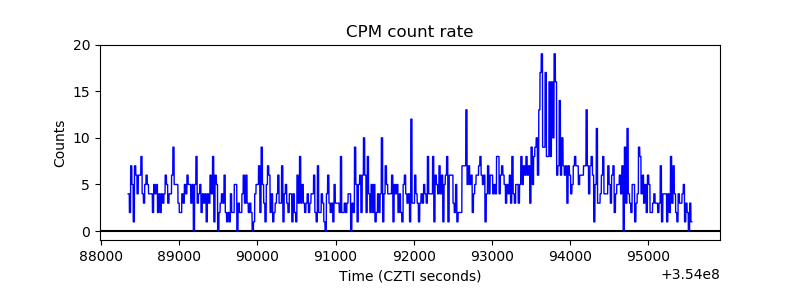 |
| CZT Counter | 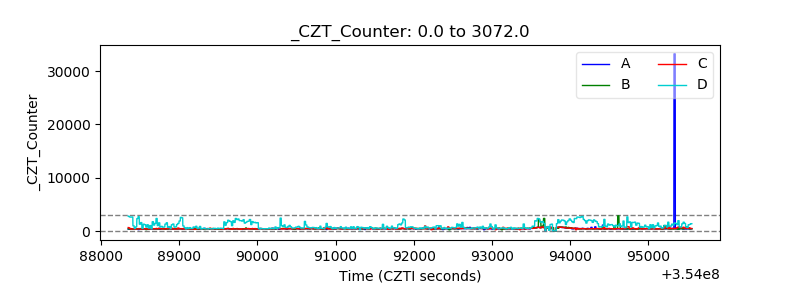 |
| +2.5 Volts monitor | 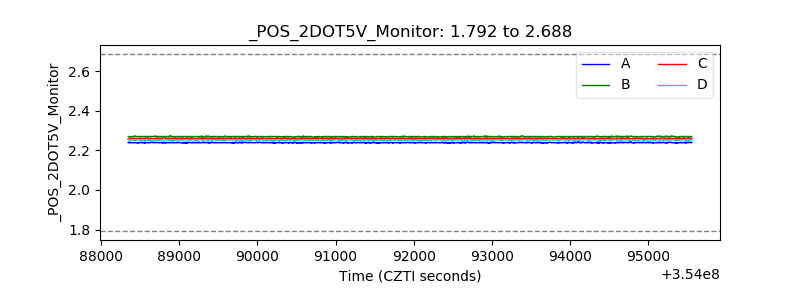 |
| +5 Volts monitor |  |
| _ROLL_ROT | 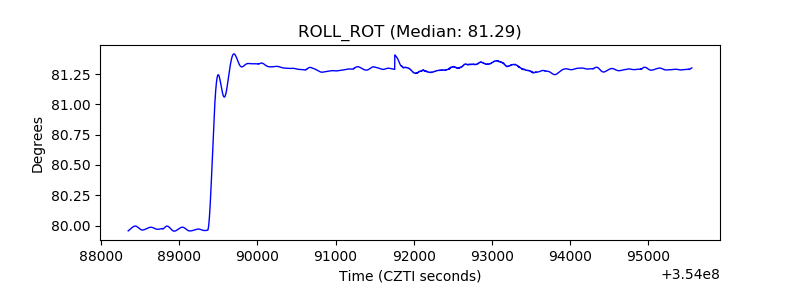 |
| _Roll_DEC | 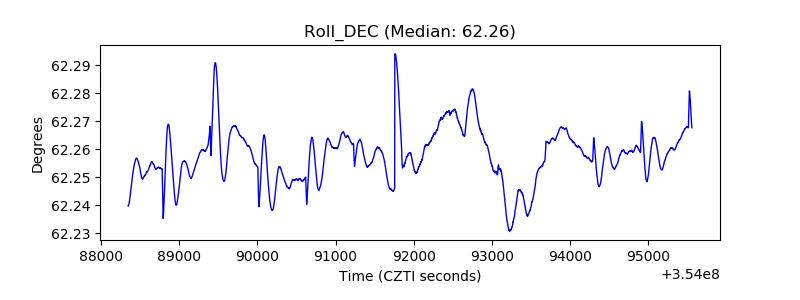 |
| _Roll_RA | 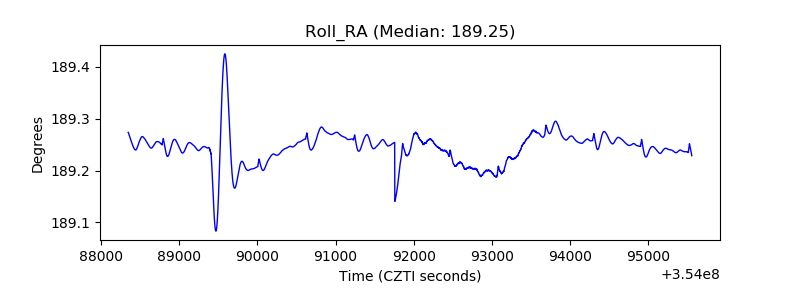 |
| Veto Counter | 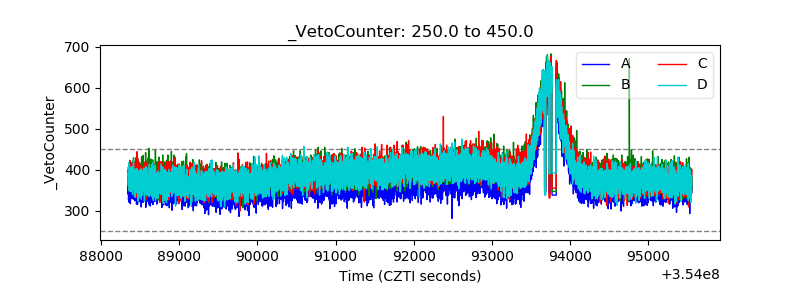 |