| Param | Original file | Final file |
|---|---|---|
| Filename | modeM0/AS1T03_286T01_9000004268_29636cztM0_level2.evt | modeM0/AS1T03_286T01_9000004268_29636cztM0_level2_quad_clean.evt |
| Size (bytes) | 676,785,600 | 96,240,960 |
| Size | 645.4 MB | 91.8 MB |
| Events in quadrant A | 3,595,318 | 614,216 |
| Events in quadrant B | 3,762,188 | 626,872 |
| Events in quadrant C | 3,793,774 | 603,625 |
| Events in quadrant D | 8,823,735 | 533,806 |
| Mode M9 | |||
|---|---|---|---|
| Quadrant | BADHDUFLAG | Total packets | Discarded packets |
| A | 0 | 2 | 0 |
| B | 0 | 2 | 0 |
| C | 0 | 2 | 0 |
| D | 0 | 2 | 0 |
| Mode SS | |||
|---|---|---|---|
| Quadrant | BADHDUFLAG | Total packets | Discarded packets |
| A | 0 | 158 | 0 |
| B | 0 | 158 | 0 |
| C | 0 | 158 | 0 |
| D | 0 | 158 | 0 |
| Mode M0 | |||
|---|---|---|---|
| Quadrant | BADHDUFLAG | Total packets | Discarded packets |
| A | 0 | 15957 | 1 |
| B | 0 | 16228 | 1 |
| C | 0 | 16289 | 1 |
| D | 0 | 31423 | 1 |
| Quadrant | Total seconds | Saturated seconds | Saturation percentage |
|---|---|---|---|
| A | 7690 | 169 | 2.197659% |
| B | 7691 | 224 | 2.912495% |
| C | 7691 | 347 | 4.511767% |
| D | 7691 | 1259 | 16.369783% |
Noise dominated data is calculated using 1-second bins in cleaned event files. If a bin has >2000 counts, and if more than 50% of those come from <1% of pixels, then it is considered to be noise-dominated and hence unusable.
| Quadrant | # 1 sec bins | Bins with >0 counts | Bins with >2000 counts | High rate bins dominated by noise | Noise dominated (total time) | Noise dominated (detector-on time) | Marked lightcurve |
|---|---|---|---|---|---|---|---|
| A | 7955 | 7690 | 16 | 16 | 0.20% | 0.21% |  |
| B | 7956 | 7691 | 56 | 56 | 0.70% | 0.73% |  |
| C | 7956 | 7691 | 7 | 7 | 0.09% | 0.09% |  |
| D | 7956 | 7691 | 1128 | 1128 | 14.18% | 14.67% | 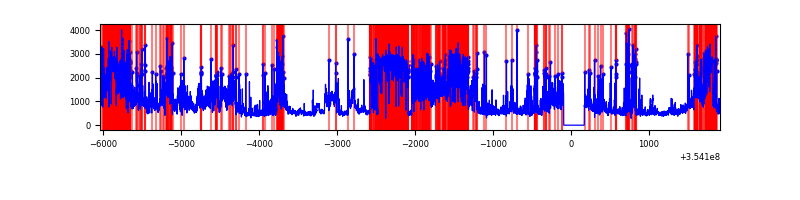 |
Top three noisy pixels from each quadrant. If the there are fewer than three noisy pixels in the level2.evt file, extra rows are filled as -1
| Pixel properties | Quadrant properties | ||||||
|---|---|---|---|---|---|---|---|
| Quadrant | DetID | PixID | Counts | Sigma | Mean | Median | Sigma |
| A | 12 | 96 | 87785 | 474.05 | 900 | 880 | 183.3 |
| A | 0 | 13 | 34647 | 184.19 | 900 | 880 | 183.3 |
| A | 13 | 254 | 13332 | 67.92 | 900 | 880 | 183.3 |
| B | 15 | 33 | 116985 | 673.0 | 894 | 870 | 172.5 |
| B | 0 | 229 | 79066 | 453.22 | 894 | 870 | 172.5 |
| B | 12 | 111 | 22042 | 122.71 | 894 | 870 | 172.5 |
| C | 14 | 238 | 218308 | 1084.18 | 858 | 862 | 200.6 |
| C | 14 | 254 | 115538 | 571.77 | 858 | 862 | 200.6 |
| C | 10 | 22 | 74590 | 367.6 | 858 | 862 | 200.6 |
| D | 7 | 238 | 2855799 | 14709.75 | 819 | 797 | 194.1 |
| D | 7 | 80 | 2208276 | 11373.53 | 819 | 797 | 194.1 |
| D | 8 | 195 | 353224 | 1815.8 | 819 | 797 | 194.1 |
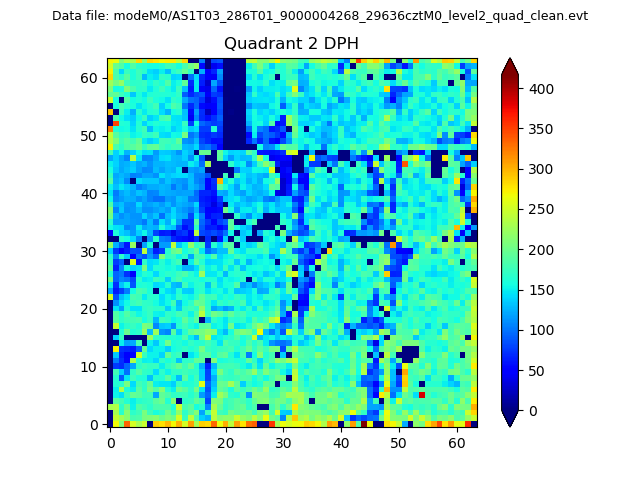
Histogram calculated using DETX and DETY for each event in the final _common_clean file
| Quadrant A | 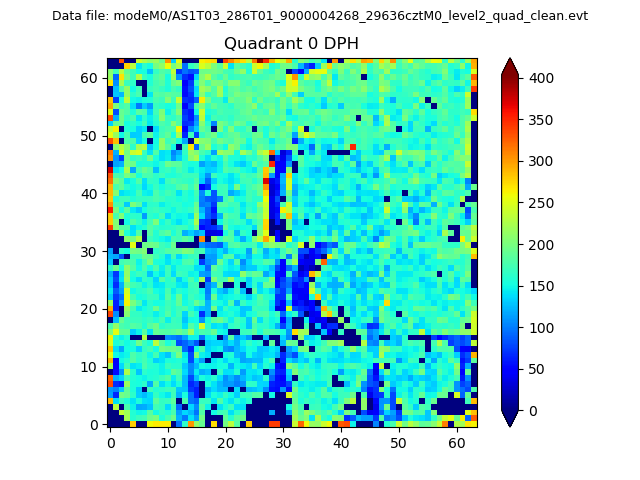 |
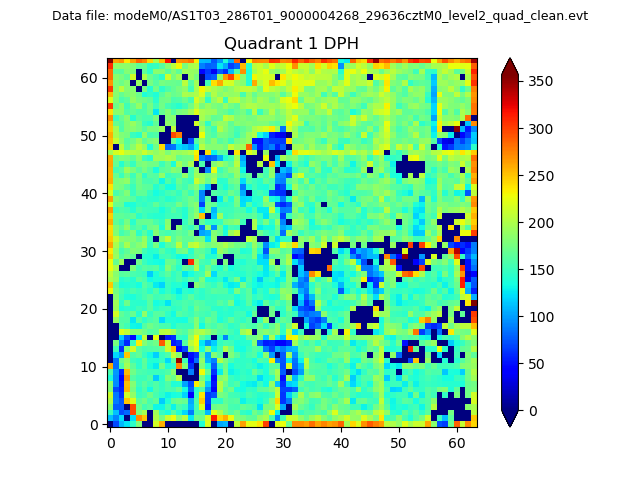 |
Quadrant B |
|---|---|---|---|
| Quadrant D | 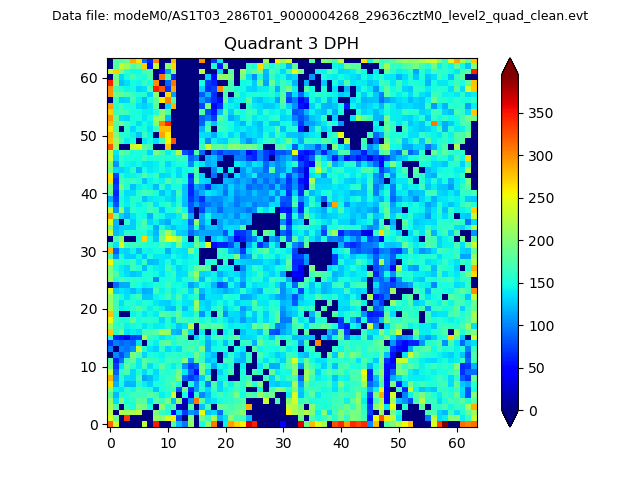 |
 |
Quadrant C |
| Plot type | Count rate plots | Images |
|---|---|---|
| Comparison with Poisson distribution Blue bars denote a histogram of data divided into 1 sec bins. Red curve is a Poisson curve with rate = median count rate of data. |
 |
 |
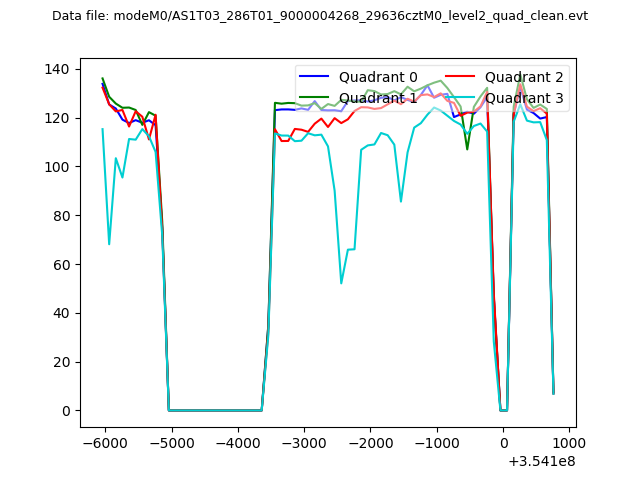
| Quadrant-wise count rates Data is divided into 100 sec bins |
 |
|
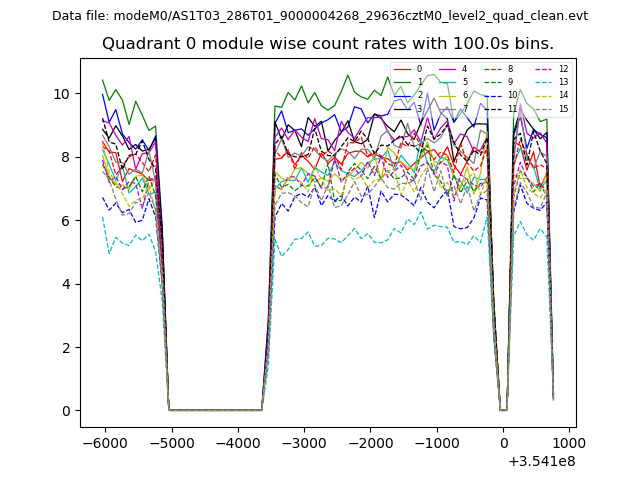
| Module-wise count rates for Quadrant A Data is divided into 100 sec bins |
 |
 |
| Module-wise count rates for Quadrant B Data is divided into 100 sec bins |
 |
 |
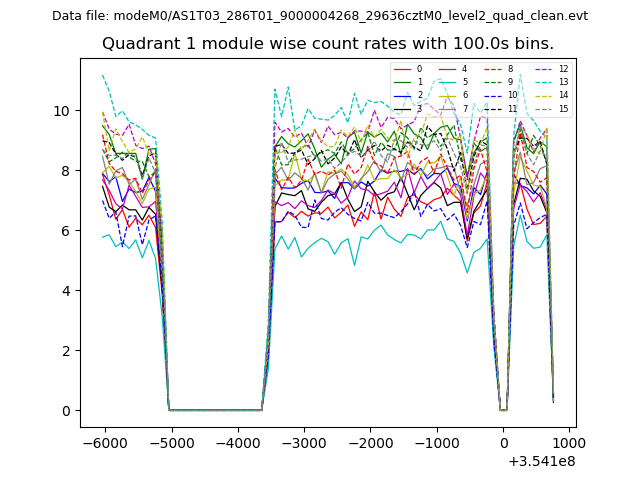
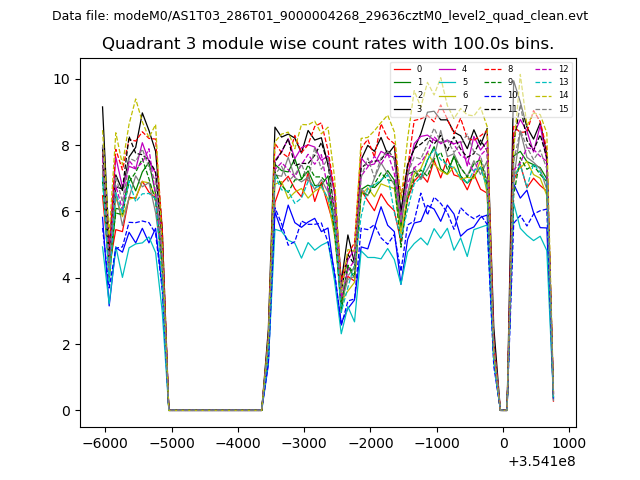
| Module-wise count rates for Quadrant C Data is divided into 100 sec bins |
 |
 |
| Module-wise count rates for Quadrant D Data is divided into 100 sec bins |
 |
 |
| Parameter | Plot |
|---|---|
| CZT HV Monitor | 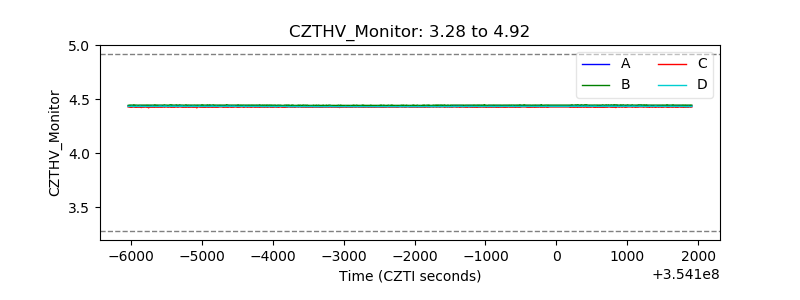 |
| D_VDD | 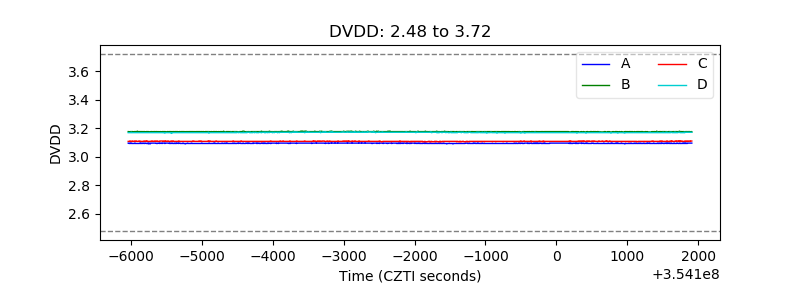 |
| Temperature 1 | 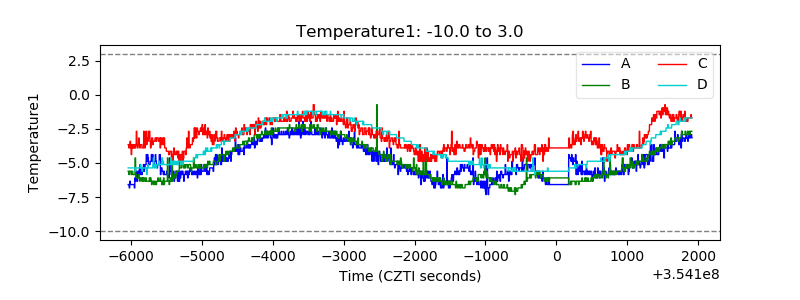 |
| Veto HV Monitor | 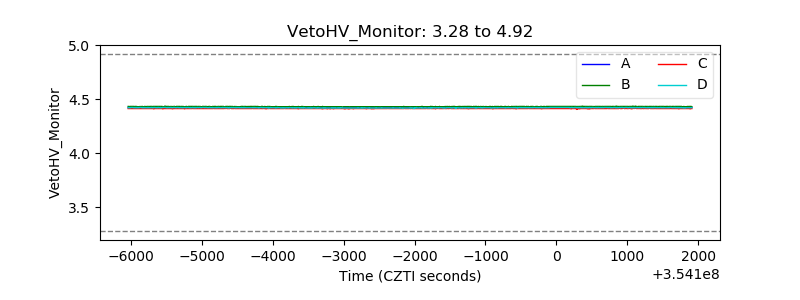 |
| Veto LLD | 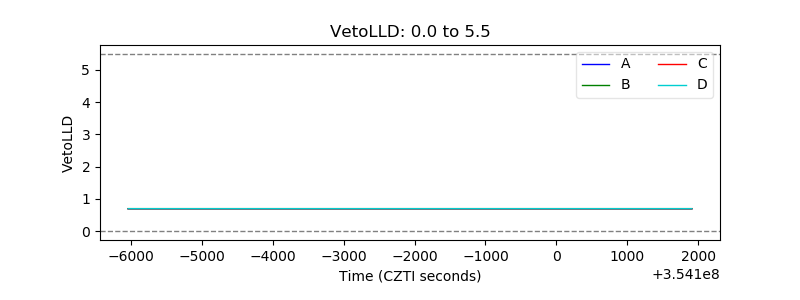 |
| Alpha Counter | 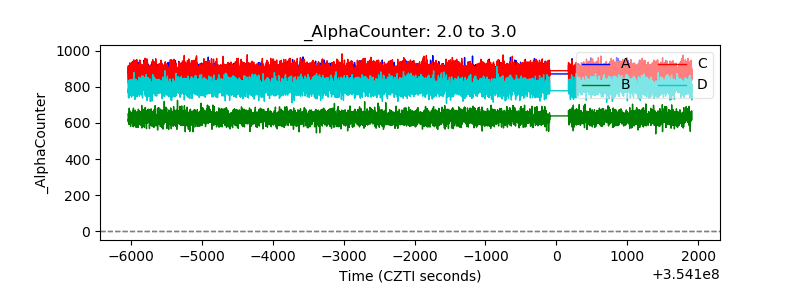 |
| _CPM_Rate | 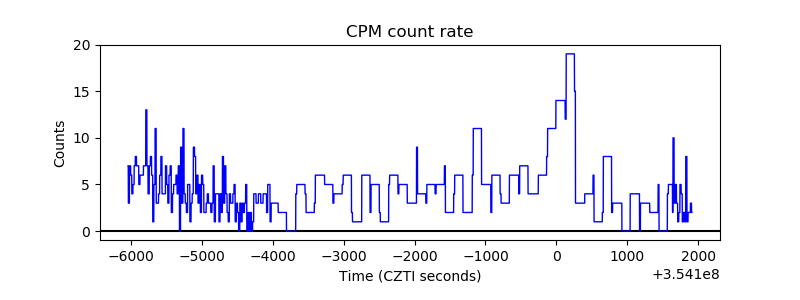 |
| CZT Counter | 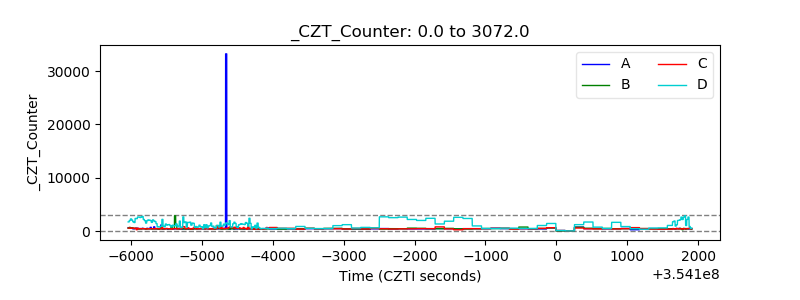 |
| +2.5 Volts monitor | 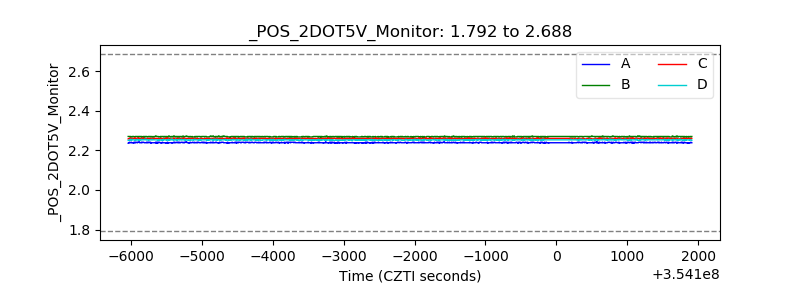 |
| +5 Volts monitor |  |
| _ROLL_ROT | 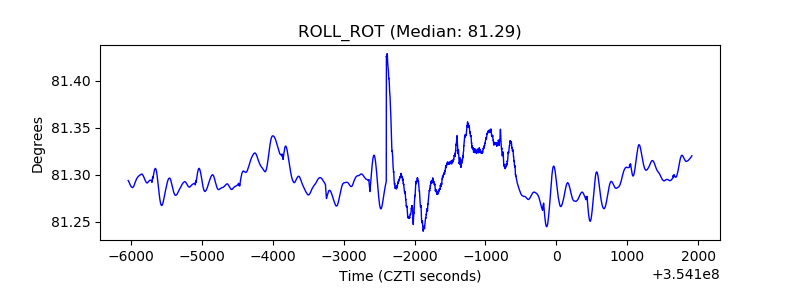 |
| _Roll_DEC | 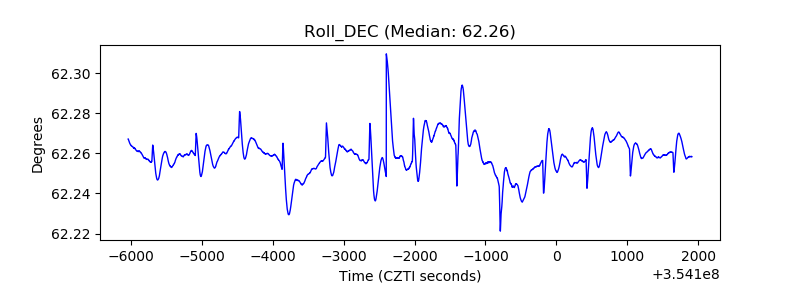 |
| _Roll_RA | 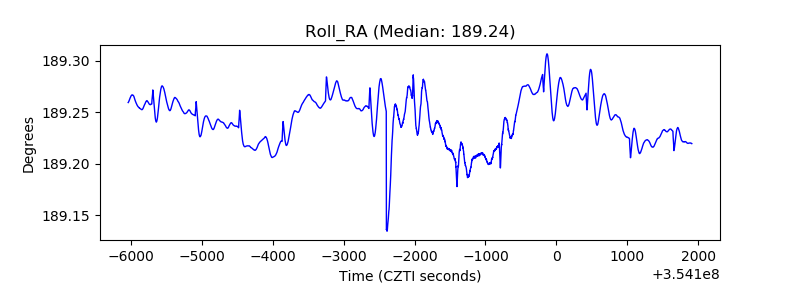 |
| Veto Counter | 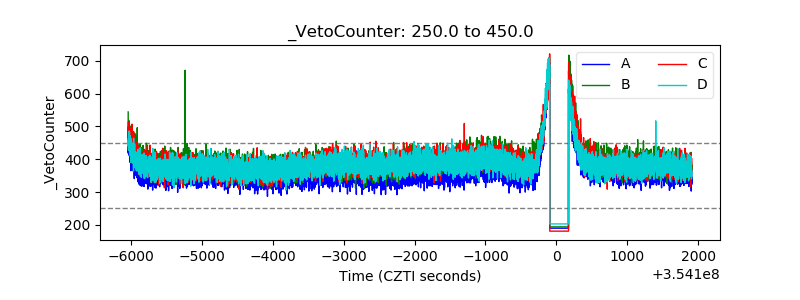 |