| Param | Original file | Final file |
|---|---|---|
| Filename | modeM0/AS1T03_286T01_9000004268_29640cztM0_level2.evt | modeM0/AS1T03_286T01_9000004268_29640cztM0_level2_quad_clean.evt |
| Size (bytes) | 615,735,360 | 101,666,880 |
| Size | 587.2 MB | 97.0 MB |
| Events in quadrant A | 3,104,948 | 684,392 |
| Events in quadrant B | 3,239,029 | 697,409 |
| Events in quadrant C | 3,228,376 | 668,834 |
| Events in quadrant D | 8,628,748 | 568,097 |
| Mode M9 | |||
|---|---|---|---|
| Quadrant | BADHDUFLAG | Total packets | Discarded packets |
| A | 0 | 10 | 0 |
| B | 0 | 10 | 0 |
| C | 0 | 10 | 0 |
| D | 0 | 10 | 0 |
| Mode SS | |||
|---|---|---|---|
| Quadrant | BADHDUFLAG | Total packets | Discarded packets |
| A | 0 | 134 | 0 |
| B | 0 | 134 | 0 |
| C | 0 | 134 | 0 |
| D | 0 | 134 | 0 |
| Mode M0 | |||
|---|---|---|---|
| Quadrant | BADHDUFLAG | Total packets | Discarded packets |
| A | 0 | 13661 | 1 |
| B | 0 | 13962 | 1 |
| C | 0 | 13845 | 1 |
| D | 0 | 30371 | 1 |
| Quadrant | Total seconds | Saturated seconds | Saturation percentage |
|---|---|---|---|
| A | 6592 | 28 | 0.424757% |
| B | 6592 | 47 | 0.712985% |
| C | 6593 | 81 | 1.228576% |
| D | 6593 | 1553 | 23.555286% |
Noise dominated data is calculated using 1-second bins in cleaned event files. If a bin has >2000 counts, and if more than 50% of those come from <1% of pixels, then it is considered to be noise-dominated and hence unusable.
| Quadrant | # 1 sec bins | Bins with >0 counts | Bins with >2000 counts | High rate bins dominated by noise | Noise dominated (total time) | Noise dominated (detector-on time) | Marked lightcurve |
|---|---|---|---|---|---|---|---|
| A | 7612 | 6592 | 0 | 0 | 0.00% | 0.00% | 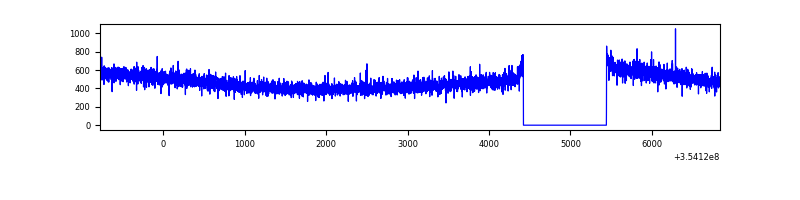 |
| B | 7612 | 6592 | 3 | 3 | 0.04% | 0.05% | 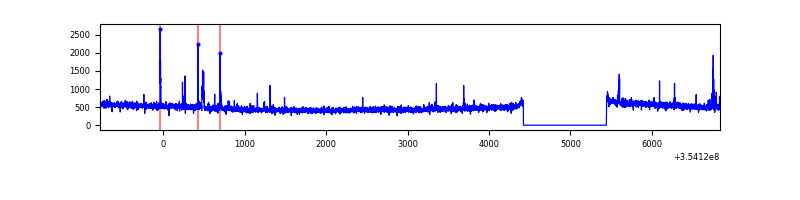 |
| C | 7613 | 6594 | 1 | 1 | 0.01% | 0.02% | 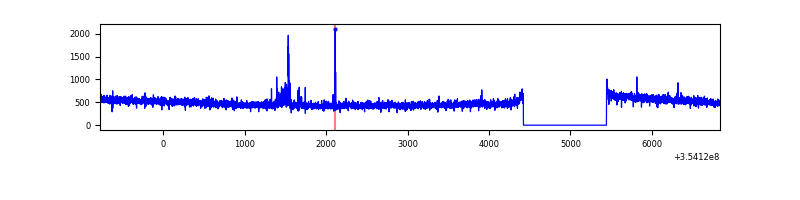 |
| D | 7613 | 6593 | 1334 | 1334 | 17.52% | 20.23% | 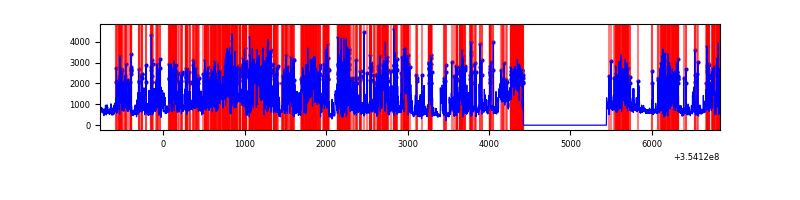 |
Top three noisy pixels from each quadrant. If the there are fewer than three noisy pixels in the level2.evt file, extra rows are filled as -1
| Pixel properties | Quadrant properties | ||||||
|---|---|---|---|---|---|---|---|
| Quadrant | DetID | PixID | Counts | Sigma | Mean | Median | Sigma |
| A | 13 | 254 | 13222 | 77.37 | 803 | 786 | 160.7 |
| A | 3 | 137 | 7905 | 44.29 | 803 | 786 | 160.7 |
| A | 0 | 226 | 6748 | 37.09 | 803 | 786 | 160.7 |
| B | 0 | 229 | 52715 | 342.65 | 800 | 780 | 151.6 |
| B | 12 | 111 | 18755 | 118.59 | 800 | 780 | 151.6 |
| B | 0 | 189 | 18292 | 115.54 | 800 | 780 | 151.6 |
| C | 14 | 238 | 129560 | 707.91 | 778 | 783 | 181.9 |
| C | 10 | 22 | 30494 | 163.33 | 778 | 783 | 181.9 |
| C | 2 | 114 | 15689 | 81.94 | 778 | 783 | 181.9 |
| D | 7 | 80 | 4180118 | 24925.05 | 708 | 690 | 167.7 |
| D | 7 | 238 | 609736 | 3632.2 | 708 | 690 | 167.7 |
| D | 8 | 195 | 558121 | 3324.38 | 708 | 690 | 167.7 |
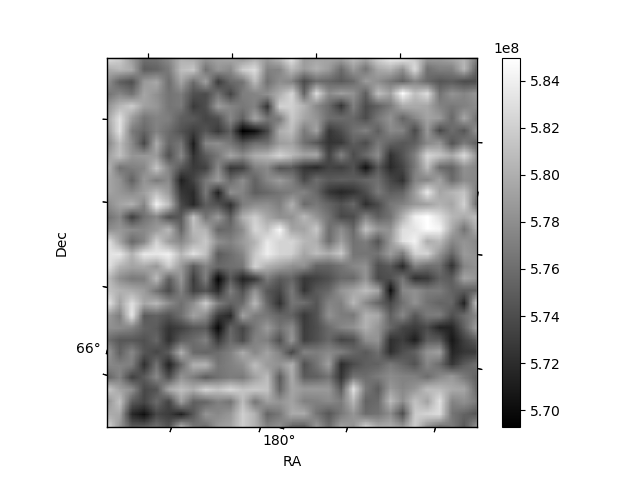
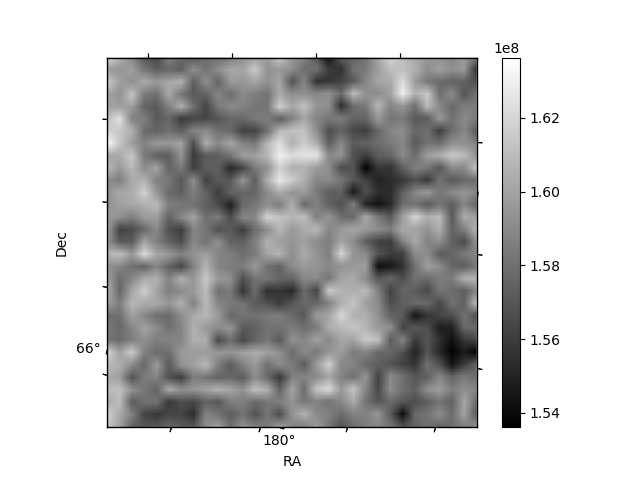
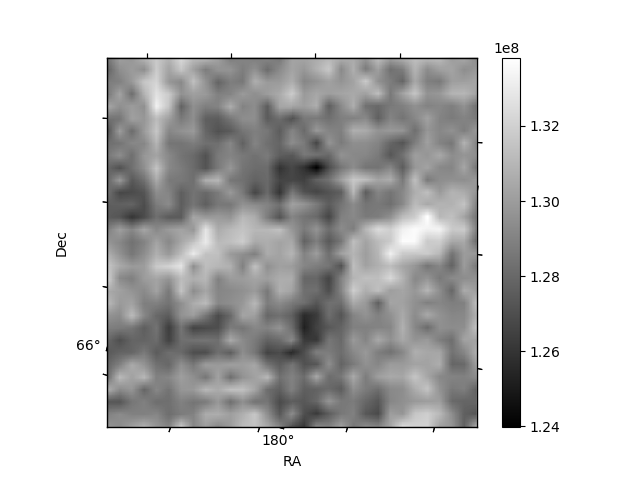
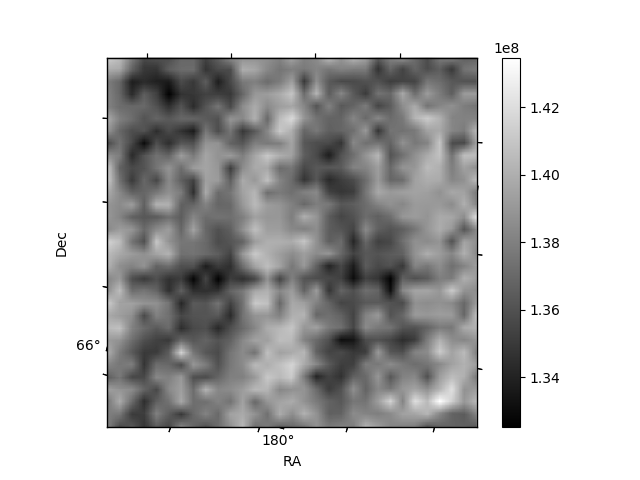
Histogram calculated using DETX and DETY for each event in the final _common_clean file
| Quadrant A | 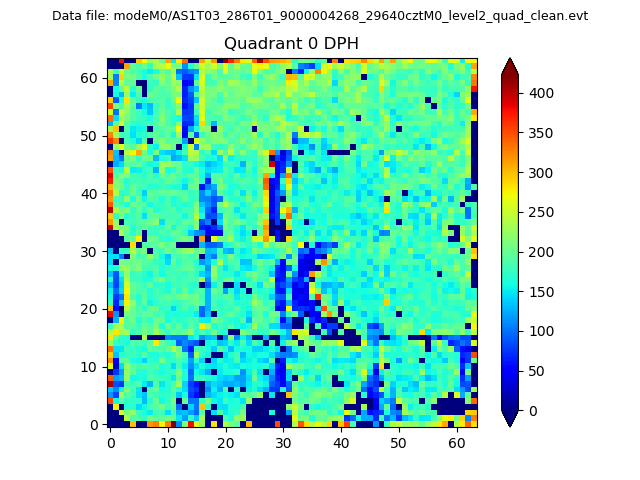 |
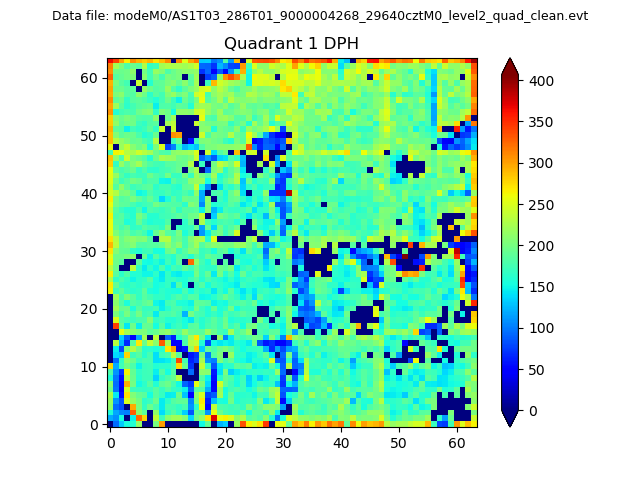 |
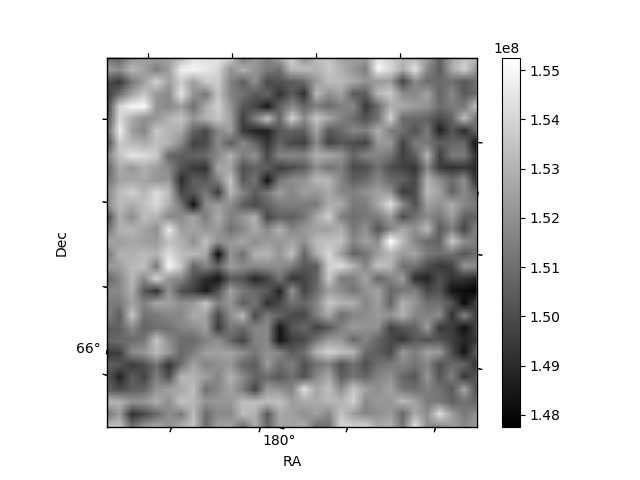
Quadrant B |
|---|---|---|---|
| Quadrant D | 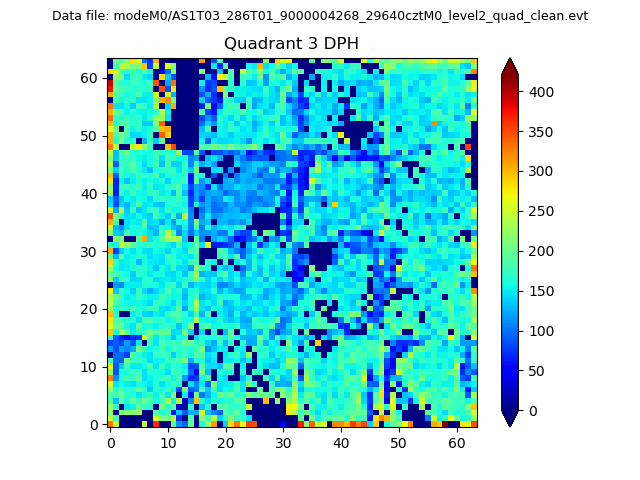 |
 |
Quadrant C |
| Plot type | Count rate plots | Images |
|---|---|---|
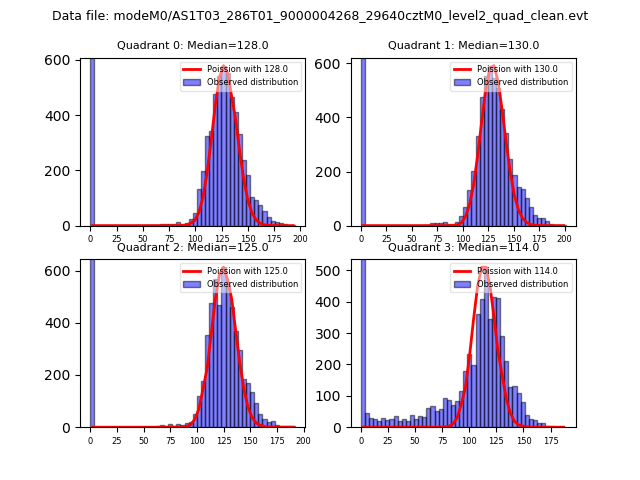
| Comparison with Poisson distribution Blue bars denote a histogram of data divided into 1 sec bins. Red curve is a Poisson curve with rate = median count rate of data. |
 |
 |
| Quadrant-wise count rates Data is divided into 100 sec bins |
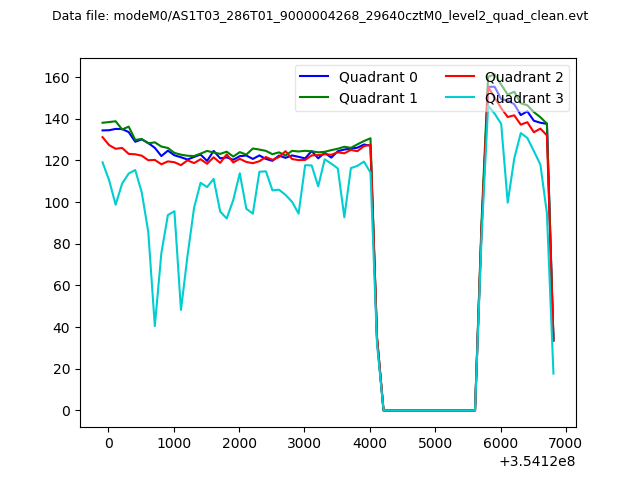 |
|
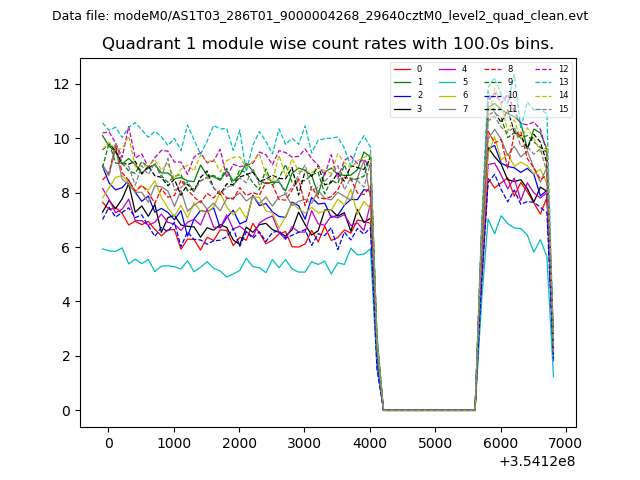
| Module-wise count rates for Quadrant A Data is divided into 100 sec bins |
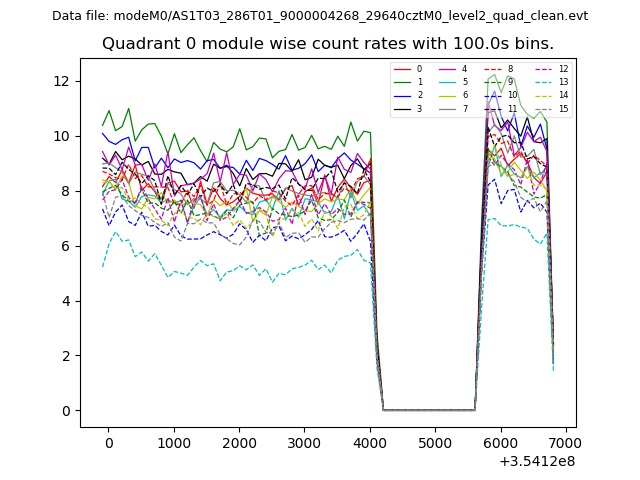 |
 |
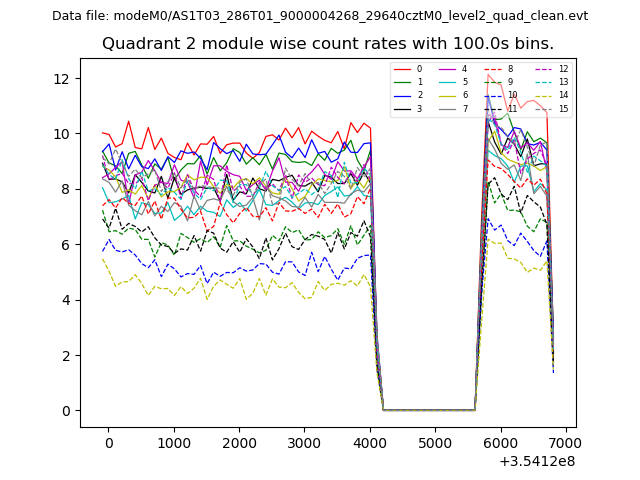
| Module-wise count rates for Quadrant B Data is divided into 100 sec bins |
 |
 |
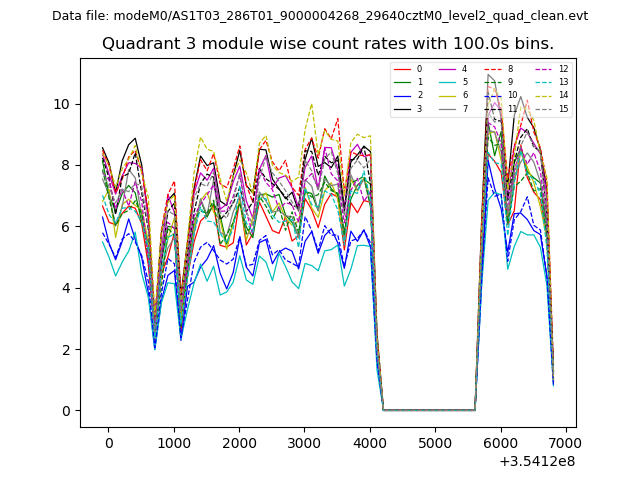
| Module-wise count rates for Quadrant C Data is divided into 100 sec bins |
 |
 |
| Module-wise count rates for Quadrant D Data is divided into 100 sec bins |
 |
 |
| Parameter | Plot |
|---|---|
| CZT HV Monitor | 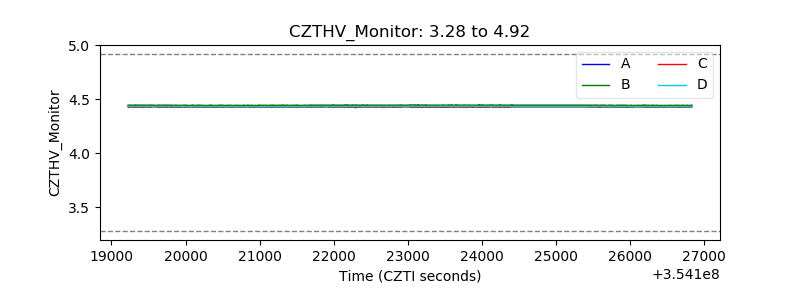 |
| D_VDD | 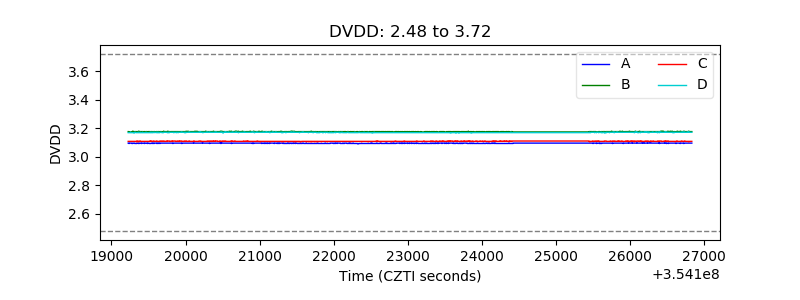 |
| Temperature 1 |  |
| Veto HV Monitor | 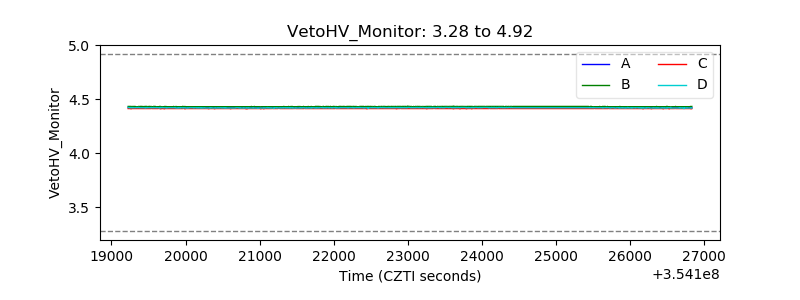 |
| Veto LLD | 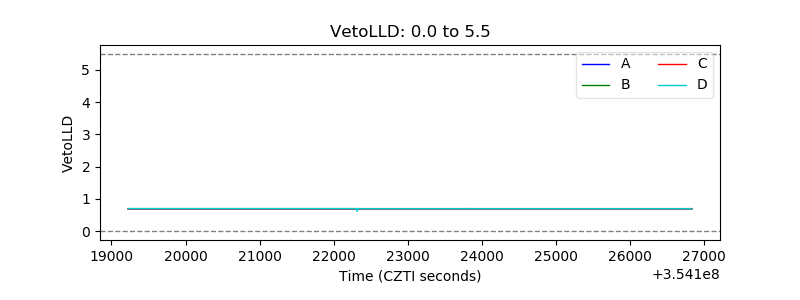 |
| Alpha Counter | 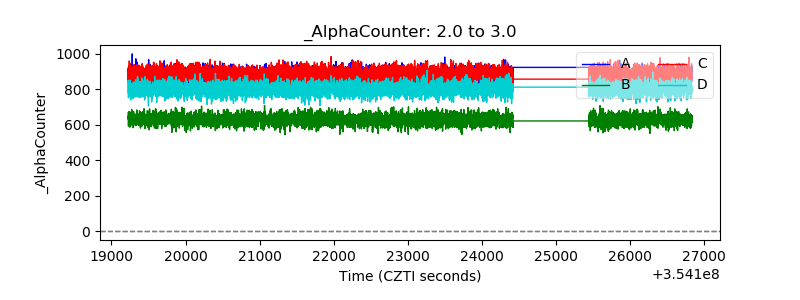 |
| _CPM_Rate | 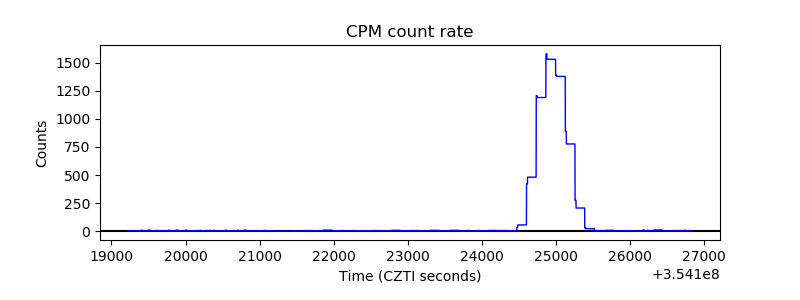 |
| CZT Counter | 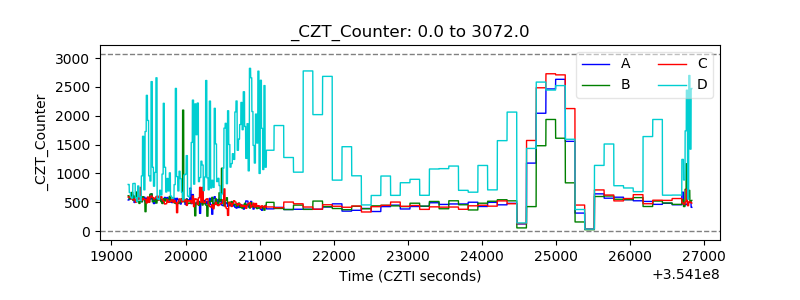 |
| +2.5 Volts monitor |  |
| +5 Volts monitor | 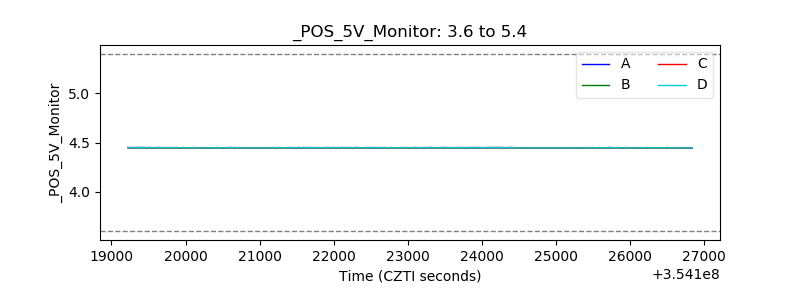 |
| _ROLL_ROT | 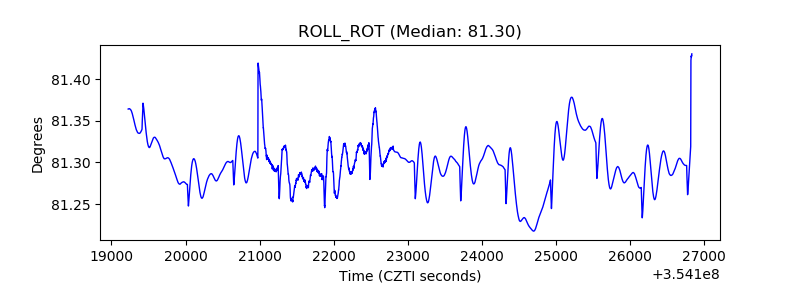 |
| _Roll_DEC | 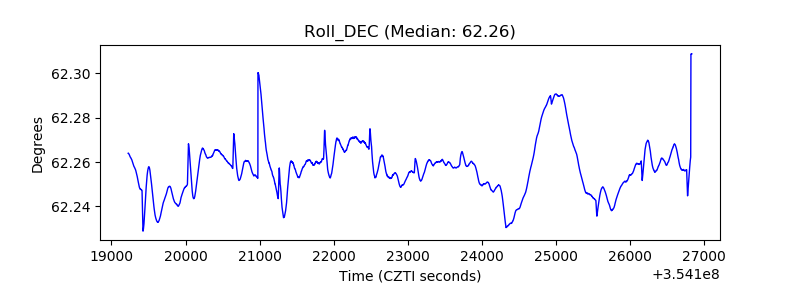 |
| _Roll_RA | 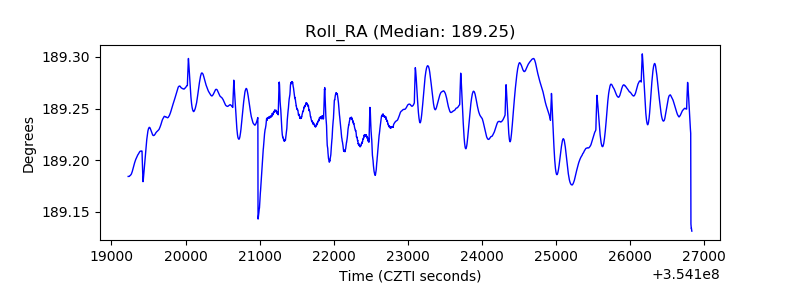 |
| Veto Counter | 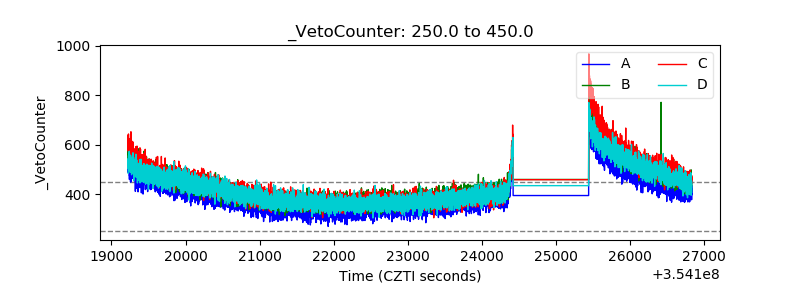 |