| Param | Original file | Final file |
|---|---|---|
| Filename | modeM0/AS1T03_286T01_9000004268_29642cztM0_level2.evt | modeM0/AS1T03_286T01_9000004268_29642cztM0_level2_quad_clean.evt |
| Size (bytes) | 533,491,200 | 113,950,080 |
| Size | 508.8 MB | 108.7 MB |
| Events in quadrant A | 3,155,767 | 761,536 |
| Events in quadrant B | 3,243,135 | 783,485 |
| Events in quadrant C | 3,355,402 | 759,786 |
| Events in quadrant D | 5,968,263 | 699,524 |
| Mode M9 | |||
|---|---|---|---|
| Quadrant | BADHDUFLAG | Total packets | Discarded packets |
| A | 0 | 18 | 0 |
| B | 0 | 19 | 0 |
| C | 0 | 19 | 0 |
| D | 0 | 19 | 0 |
| Mode SS | |||
|---|---|---|---|
| Quadrant | BADHDUFLAG | Total packets | Discarded packets |
| A | 0 | 130 | 0 |
| B | 0 | 130 | 0 |
| C | 0 | 130 | 0 |
| D | 0 | 130 | 0 |
| Mode M0 | |||
|---|---|---|---|
| Quadrant | BADHDUFLAG | Total packets | Discarded packets |
| A | 0 | 13813 | 2 |
| B | 0 | 14003 | 2 |
| C | 0 | 14257 | 3 |
| D | 0 | 22288 | 2 |
| Quadrant | Total seconds | Saturated seconds | Saturation percentage |
|---|---|---|---|
| A | 6404 | 35 | 0.546533% |
| B | 6404 | 58 | 0.905684% |
| C | 6403 | 158 | 2.467593% |
| D | 6403 | 674 | 10.526316% |
Noise dominated data is calculated using 1-second bins in cleaned event files. If a bin has >2000 counts, and if more than 50% of those come from <1% of pixels, then it is considered to be noise-dominated and hence unusable.
| Quadrant | # 1 sec bins | Bins with >0 counts | Bins with >2000 counts | High rate bins dominated by noise | Noise dominated (total time) | Noise dominated (detector-on time) | Marked lightcurve |
|---|---|---|---|---|---|---|---|
| A | 7529 | 6405 | 8 | 8 | 0.11% | 0.12% | 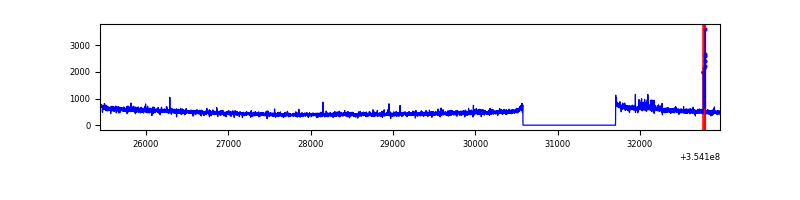 |
| B | 7529 | 6405 | 6 | 6 | 0.08% | 0.09% | 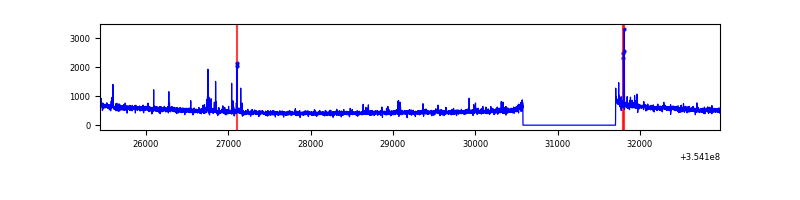 |
| C | 7528 | 6403 | 29 | 29 | 0.39% | 0.45% | 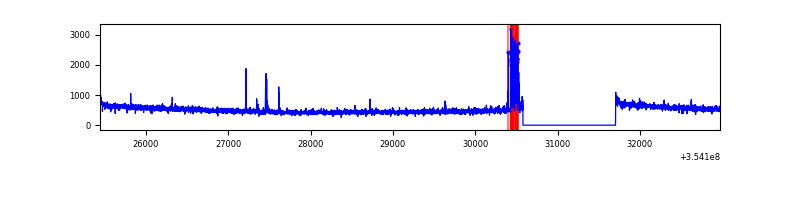 |
| D | 7528 | 6403 | 492 | 492 | 6.54% | 7.68% | 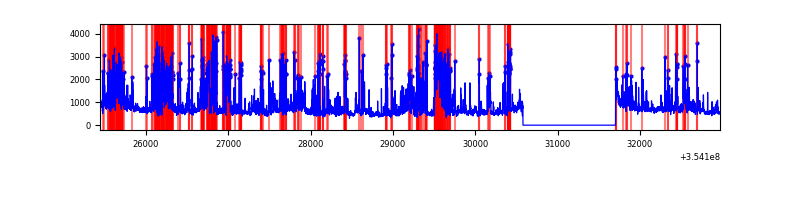 |
Top three noisy pixels from each quadrant. If the there are fewer than three noisy pixels in the level2.evt file, extra rows are filled as -1
| Pixel properties | Quadrant properties | ||||||
|---|---|---|---|---|---|---|---|
| Quadrant | DetID | PixID | Counts | Sigma | Mean | Median | Sigma |
| A | 12 | 96 | 55197 | 340.51 | 803 | 786 | 159.8 |
| A | 13 | 254 | 12517 | 73.41 | 803 | 786 | 159.8 |
| A | 3 | 137 | 7682 | 43.16 | 803 | 786 | 159.8 |
| B | 0 | 156 | 24296 | 155.8 | 801 | 780 | 150.9 |
| B | 15 | 32 | 18482 | 117.28 | 801 | 780 | 150.9 |
| B | 12 | 111 | 18078 | 114.6 | 801 | 780 | 150.9 |
| C | 10 | 22 | 135124 | 730.07 | 785 | 791 | 184.0 |
| C | 14 | 238 | 127195 | 686.98 | 785 | 791 | 184.0 |
| C | 2 | 114 | 15382 | 79.3 | 785 | 791 | 184.0 |
| D | 7 | 80 | 1944260 | 10671.99 | 762 | 739 | 182.1 |
| D | 8 | 195 | 511367 | 2803.89 | 762 | 739 | 182.1 |
| D | 7 | 238 | 241979 | 1324.66 | 762 | 739 | 182.1 |
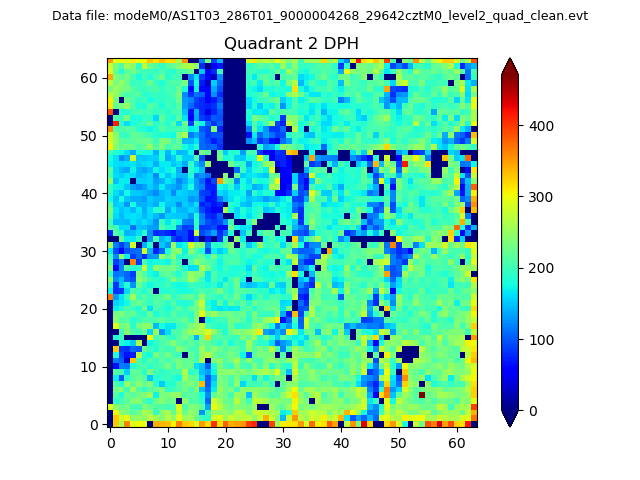
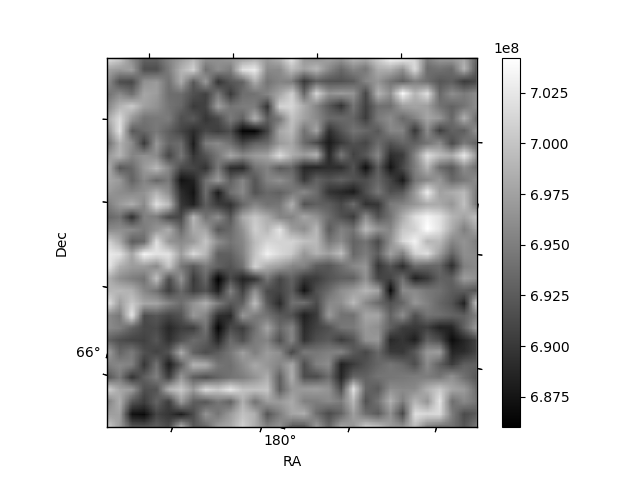
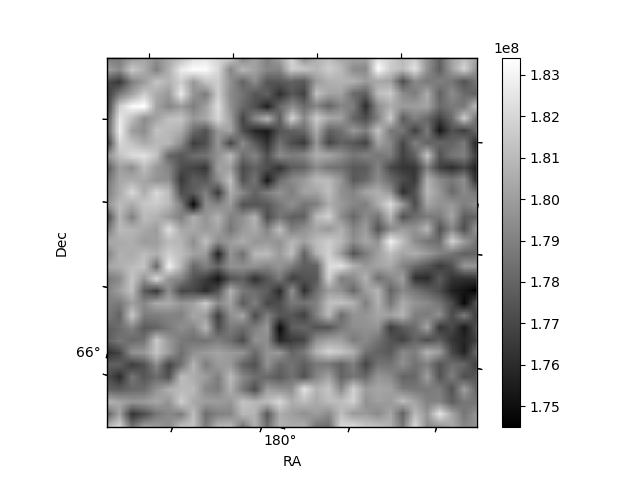
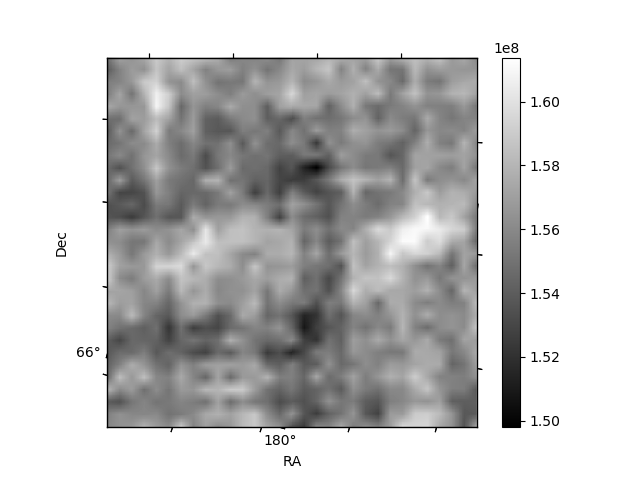
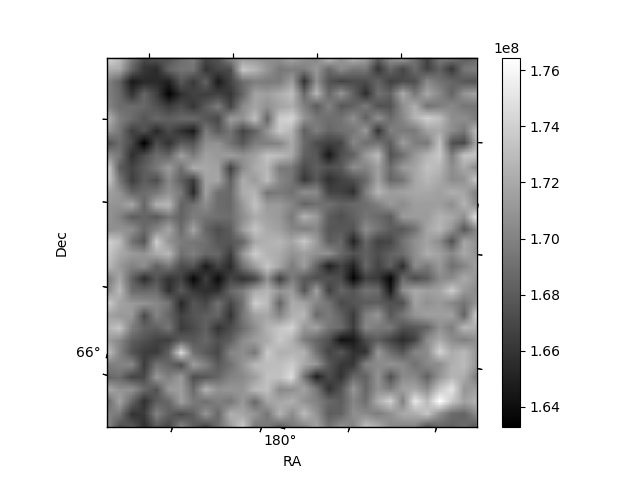
Histogram calculated using DETX and DETY for each event in the final _common_clean file
| Quadrant A | 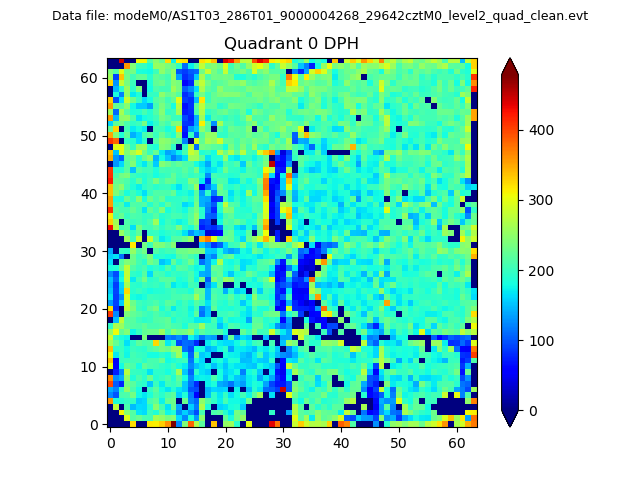 |
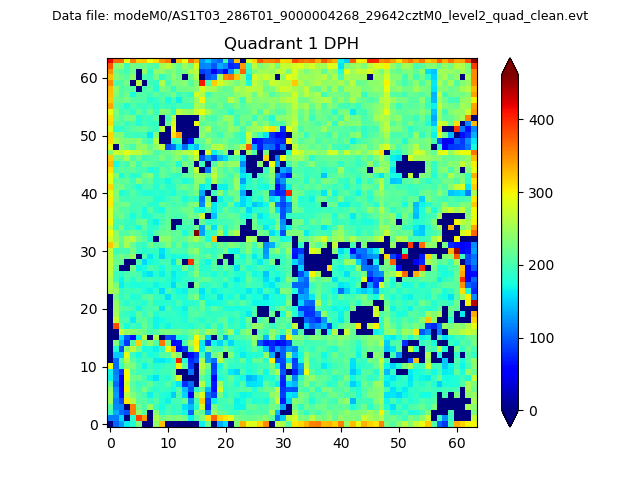 |
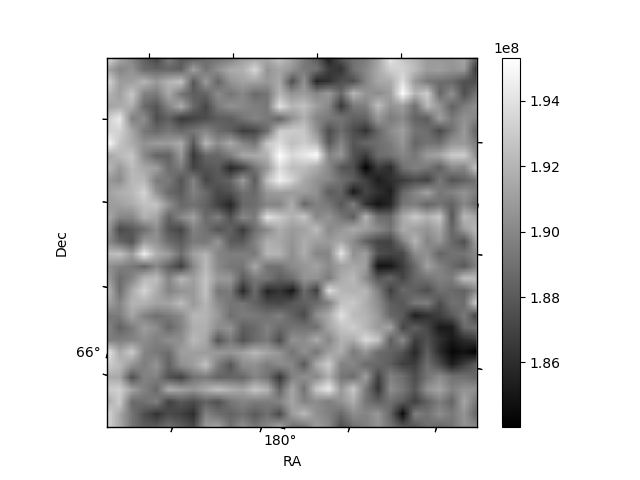
Quadrant B |
|---|---|---|---|
| Quadrant D | 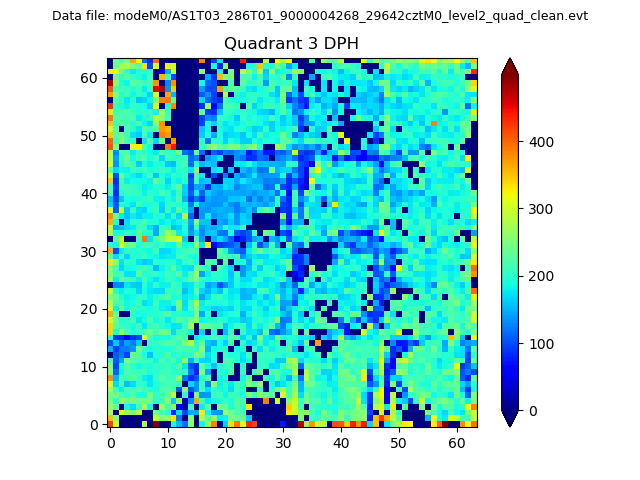 |
 |
Quadrant C |
| Plot type | Count rate plots | Images |
|---|---|---|
| Comparison with Poisson distribution Blue bars denote a histogram of data divided into 1 sec bins. Red curve is a Poisson curve with rate = median count rate of data. |
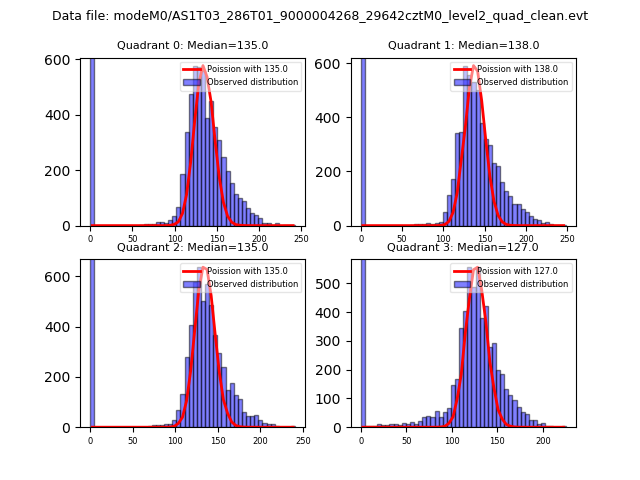 |
 |
| Quadrant-wise count rates Data is divided into 100 sec bins |
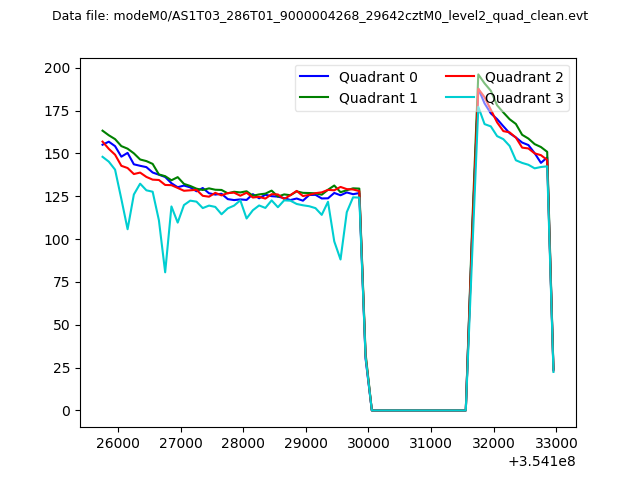 |
|
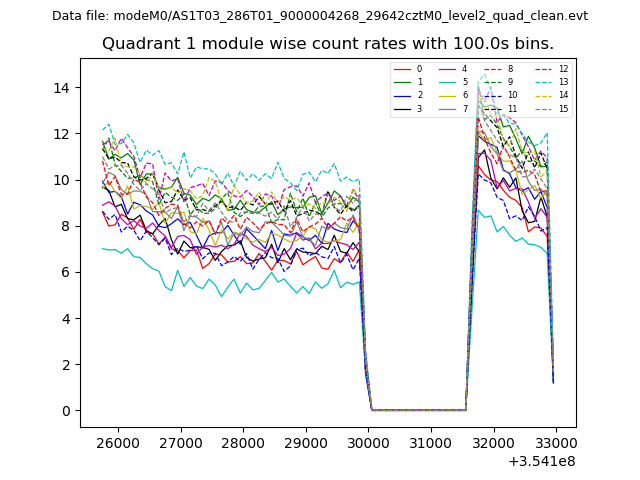
| Module-wise count rates for Quadrant A Data is divided into 100 sec bins |
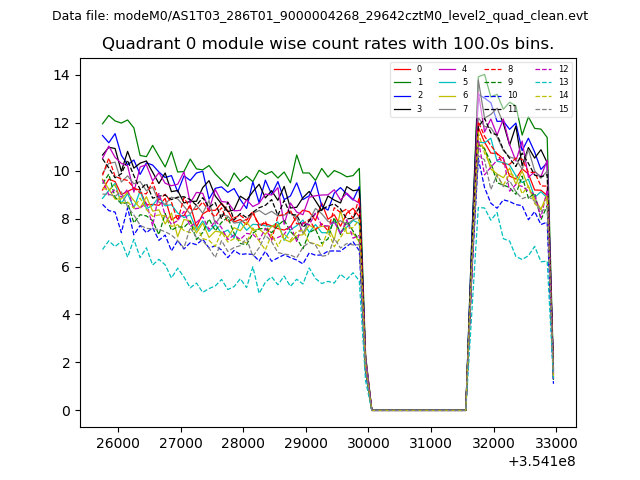 |
 |
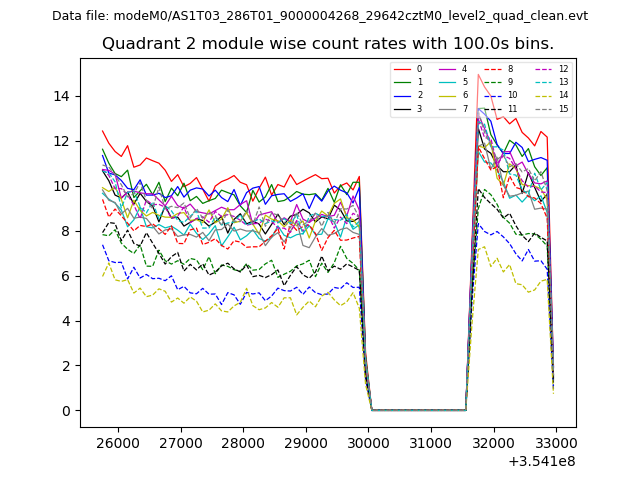
| Module-wise count rates for Quadrant B Data is divided into 100 sec bins |
 |
 |
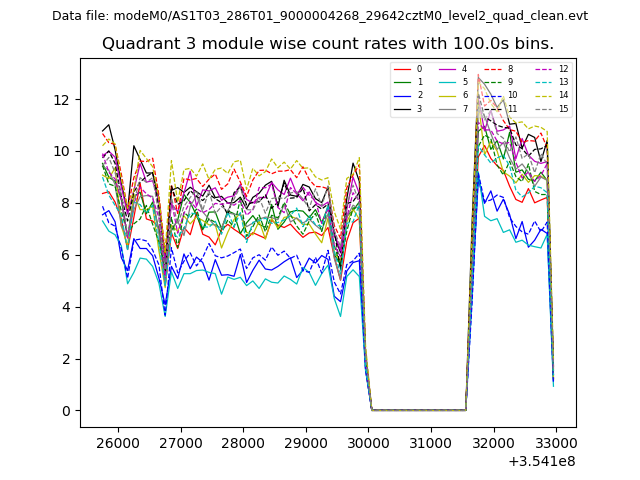
| Module-wise count rates for Quadrant C Data is divided into 100 sec bins |
 |
 |
| Module-wise count rates for Quadrant D Data is divided into 100 sec bins |
 |
 |
| Parameter | Plot |
|---|---|
| CZT HV Monitor | 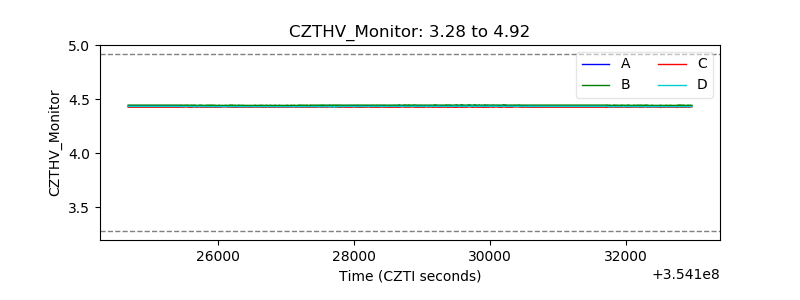 |
| D_VDD | 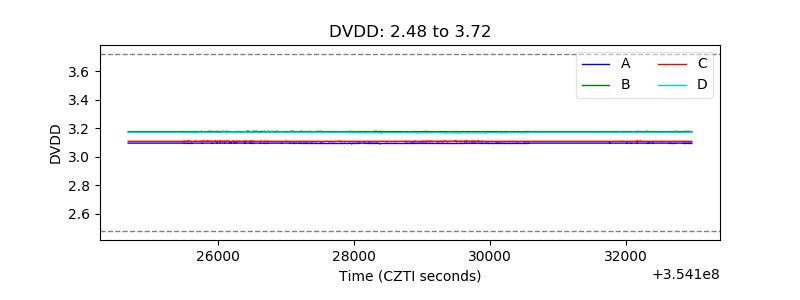 |
| Temperature 1 | 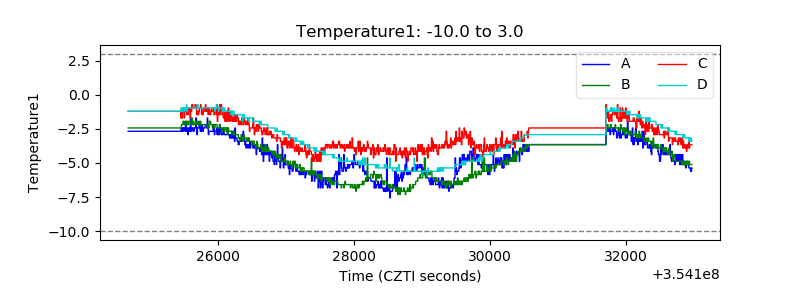 |
| Veto HV Monitor |  |
| Veto LLD | 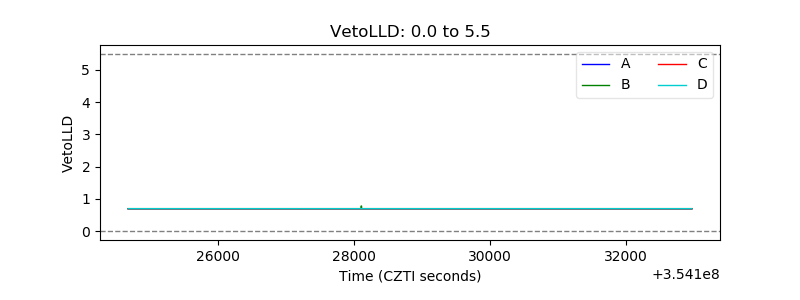 |
| Alpha Counter |  |
| _CPM_Rate |  |
| CZT Counter | 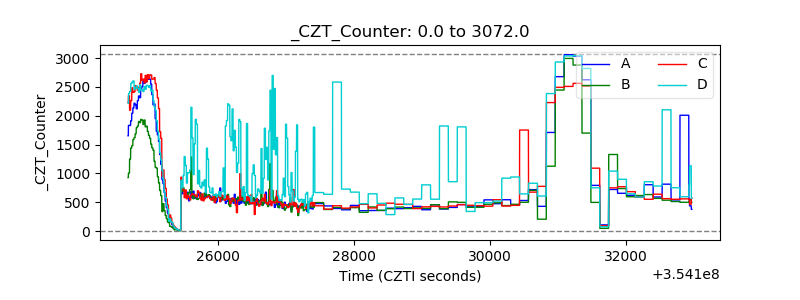 |
| +2.5 Volts monitor | 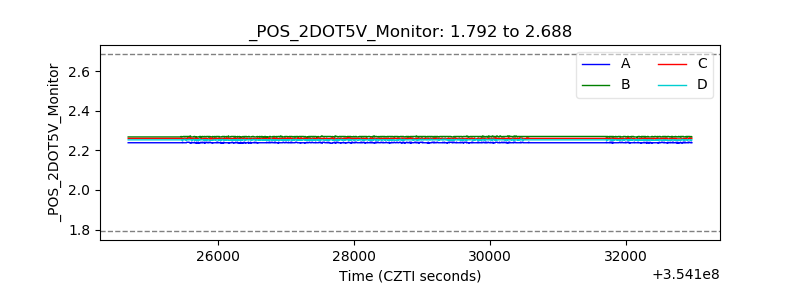 |
| +5 Volts monitor |  |
| _ROLL_ROT | 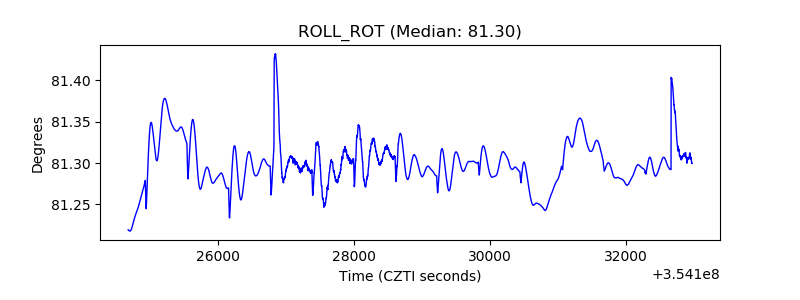 |
| _Roll_DEC | 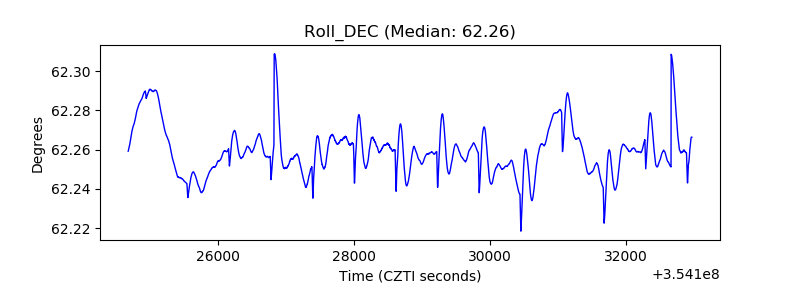 |
| _Roll_RA | 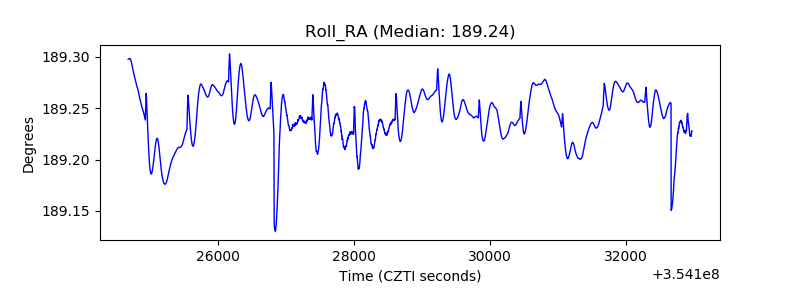 |
| Veto Counter | 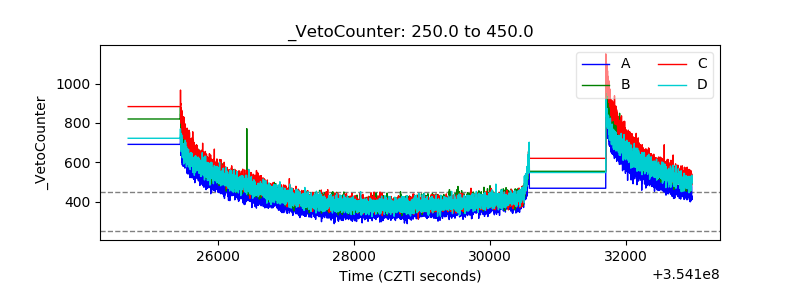 |