| Param | Original file | Final file |
|---|---|---|
| Filename | modeM0/AS1T03_286T01_9000004268_29643cztM0_level2.evt | modeM0/AS1T03_286T01_9000004268_29643cztM0_level2_quad_clean.evt |
| Size (bytes) | 479,090,880 | 118,693,440 |
| Size | 456.9 MB | 113.2 MB |
| Events in quadrant A | 3,131,956 | 789,157 |
| Events in quadrant B | 3,298,849 | 816,891 |
| Events in quadrant C | 3,367,229 | 794,842 |
| Events in quadrant D | 4,287,658 | 758,427 |
| Mode M9 | |||
|---|---|---|---|
| Quadrant | BADHDUFLAG | Total packets | Discarded packets |
| A | 0 | 22 | 0 |
| B | 0 | 23 | 0 |
| C | 0 | 23 | 0 |
| D | 0 | 23 | 0 |
| Mode SS | |||
|---|---|---|---|
| Quadrant | BADHDUFLAG | Total packets | Discarded packets |
| A | 0 | 126 | 0 |
| B | 0 | 126 | 0 |
| C | 0 | 126 | 0 |
| D | 0 | 126 | 0 |
| Mode M0 | |||
|---|---|---|---|
| Quadrant | BADHDUFLAG | Total packets | Discarded packets |
| A | 0 | 13567 | 2 |
| B | 0 | 13987 | 2 |
| C | 0 | 14174 | 3 |
| D | 0 | 17057 | 2 |
| Quadrant | Total seconds | Saturated seconds | Saturation percentage |
|---|---|---|---|
| A | 6244 | 38 | 0.608584% |
| B | 6244 | 73 | 1.169122% |
| C | 6243 | 144 | 2.306583% |
| D | 6243 | 164 | 2.626942% |
Noise dominated data is calculated using 1-second bins in cleaned event files. If a bin has >2000 counts, and if more than 50% of those come from <1% of pixels, then it is considered to be noise-dominated and hence unusable.
| Quadrant | # 1 sec bins | Bins with >0 counts | Bins with >2000 counts | High rate bins dominated by noise | Noise dominated (total time) | Noise dominated (detector-on time) | Marked lightcurve |
|---|---|---|---|---|---|---|---|
| A | 7489 | 6245 | 8 | 8 | 0.11% | 0.13% | 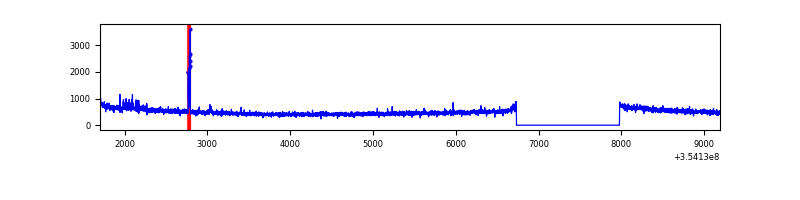 |
| B | 7489 | 6245 | 18 | 18 | 0.24% | 0.29% | 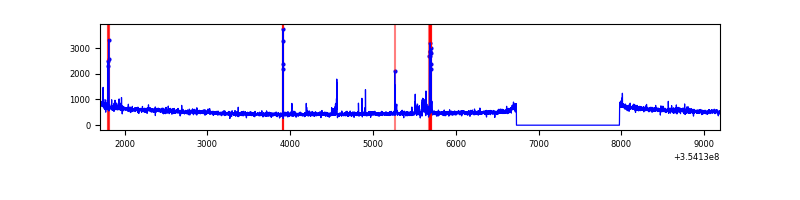 |
| C | 7488 | 6243 | 24 | 24 | 0.32% | 0.38% | 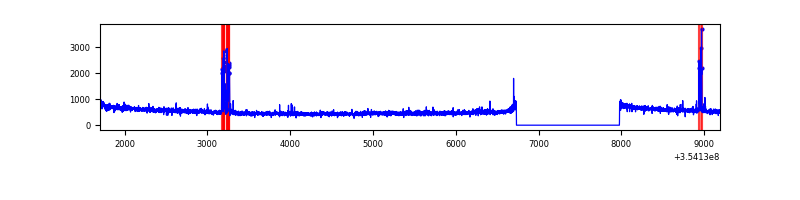 |
| D | 7488 | 6243 | 93 | 93 | 1.24% | 1.49% | 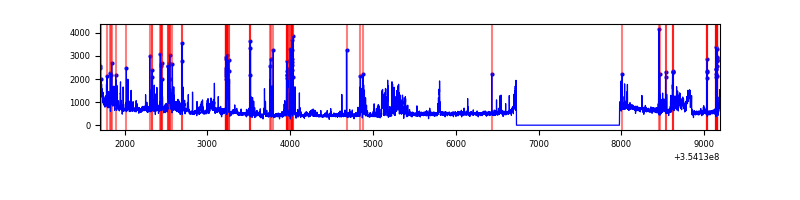 |
Top three noisy pixels from each quadrant. If the there are fewer than three noisy pixels in the level2.evt file, extra rows are filled as -1
| Pixel properties | Quadrant properties | ||||||
|---|---|---|---|---|---|---|---|
| Quadrant | DetID | PixID | Counts | Sigma | Mean | Median | Sigma |
| A | 12 | 96 | 60668 | 376.76 | 796 | 781 | 159.0 |
| A | 13 | 254 | 11995 | 70.55 | 796 | 781 | 159.0 |
| A | 3 | 137 | 7502 | 42.28 | 796 | 781 | 159.0 |
| B | 15 | 33 | 104025 | 698.3 | 800 | 781 | 147.9 |
| B | 0 | 156 | 20532 | 133.59 | 800 | 781 | 147.9 |
| B | 12 | 111 | 17842 | 115.39 | 800 | 781 | 147.9 |
| C | 10 | 22 | 131302 | 717.31 | 788 | 795 | 181.9 |
| C | 14 | 238 | 128426 | 701.5 | 788 | 795 | 181.9 |
| C | 3 | 233 | 15257 | 79.49 | 788 | 795 | 181.9 |
| D | 8 | 195 | 304507 | 1651.19 | 782 | 764 | 184.0 |
| D | 12 | 33 | 304298 | 1650.05 | 782 | 764 | 184.0 |
| D | 7 | 80 | 225255 | 1220.36 | 782 | 764 | 184.0 |
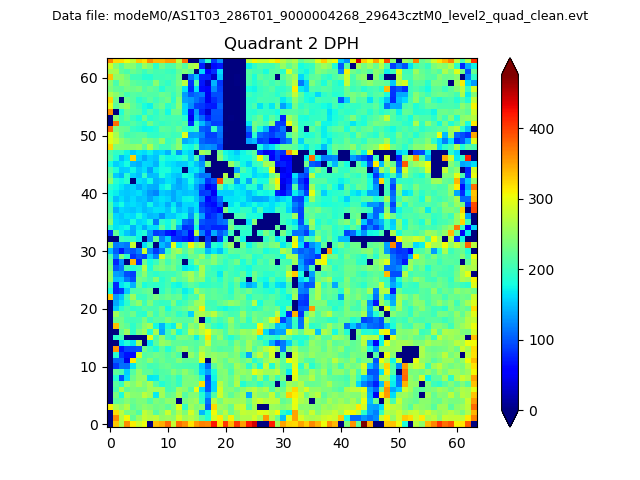
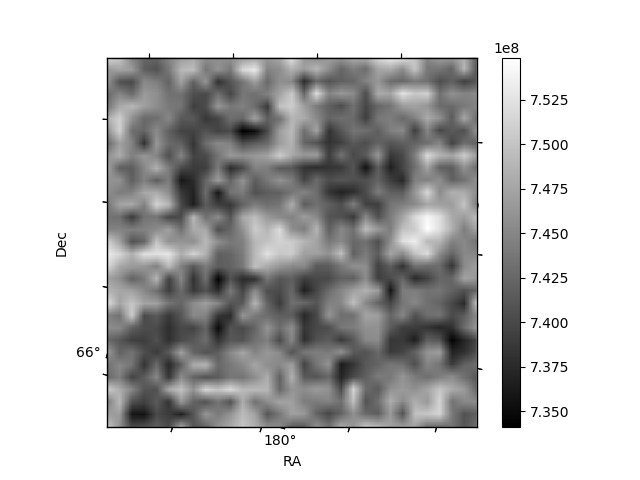
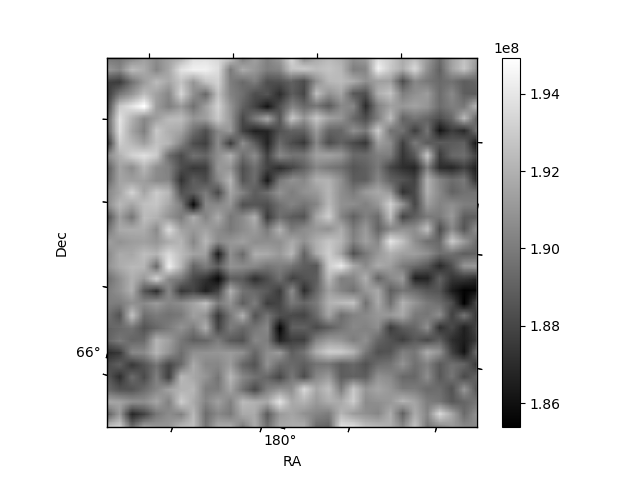
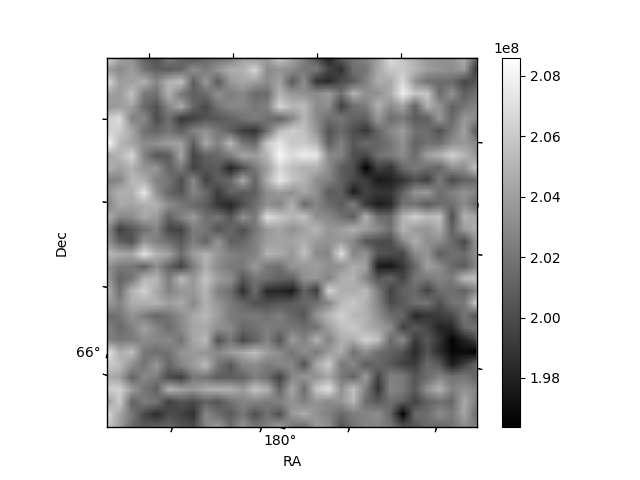
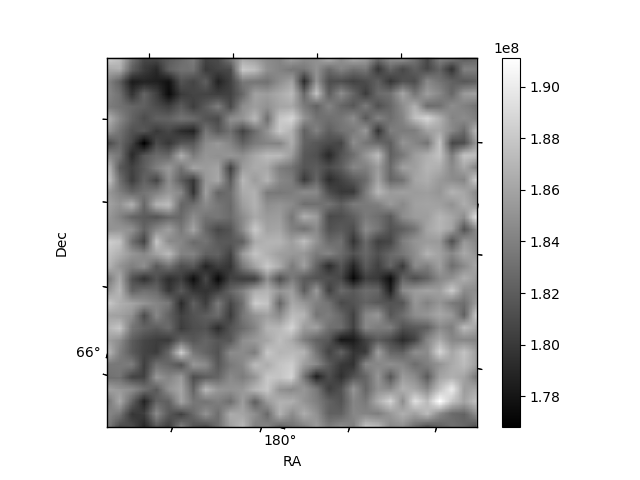
Histogram calculated using DETX and DETY for each event in the final _common_clean file
| Quadrant A | 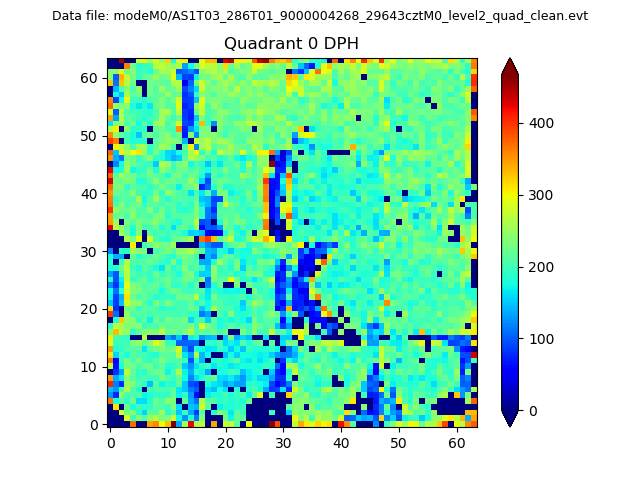 |
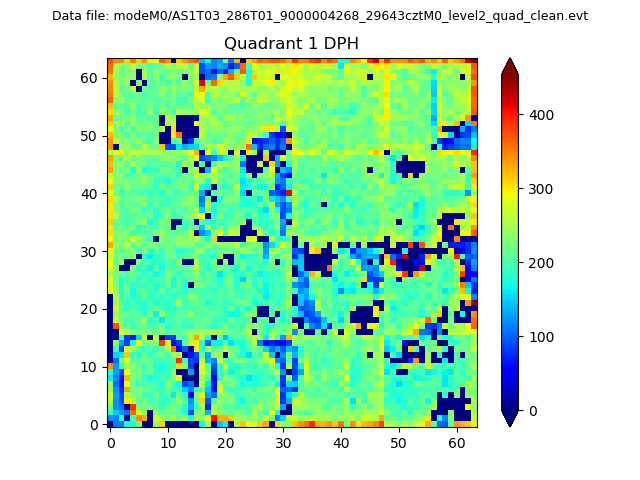 |
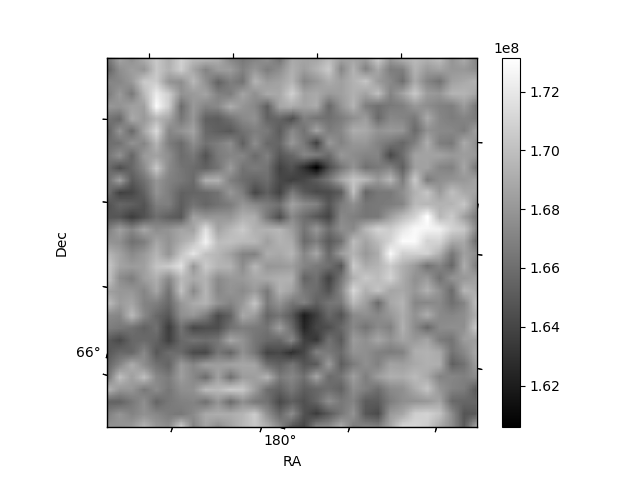
Quadrant B |
|---|---|---|---|
| Quadrant D | 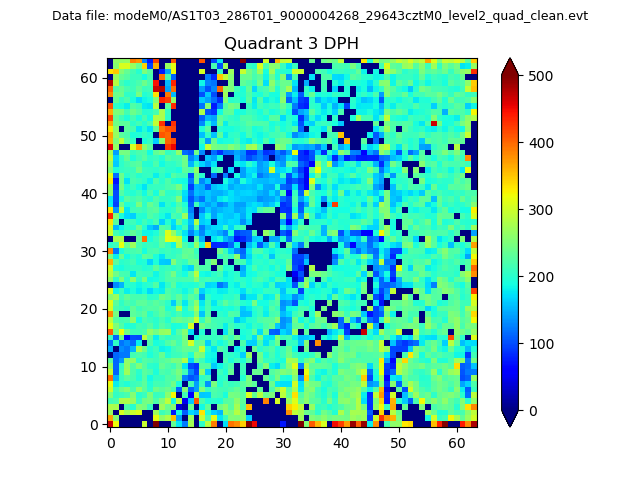 |
 |
Quadrant C |
| Plot type | Count rate plots | Images |
|---|---|---|
| Comparison with Poisson distribution Blue bars denote a histogram of data divided into 1 sec bins. Red curve is a Poisson curve with rate = median count rate of data. |
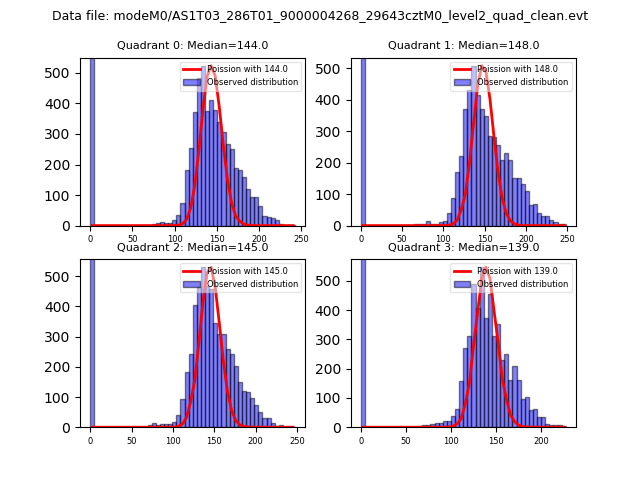 |
 |
| Quadrant-wise count rates Data is divided into 100 sec bins |
 |
|
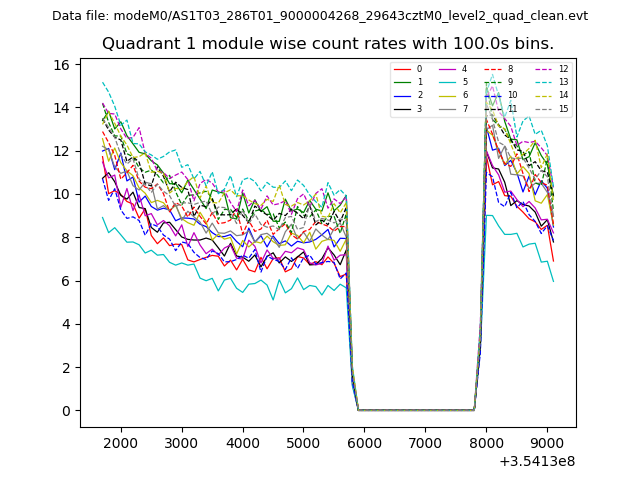
| Module-wise count rates for Quadrant A Data is divided into 100 sec bins |
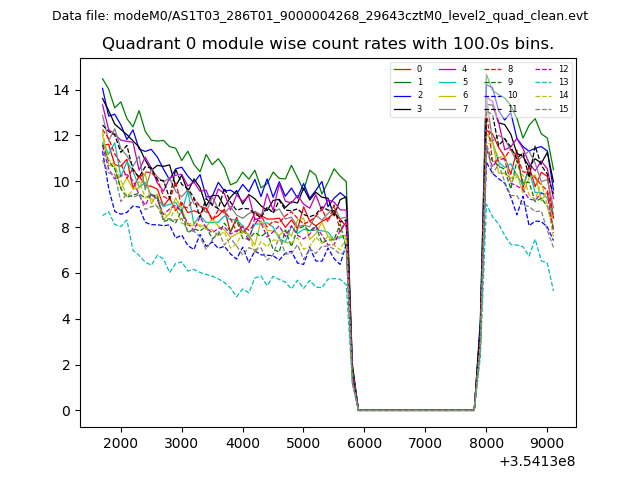 |
 |
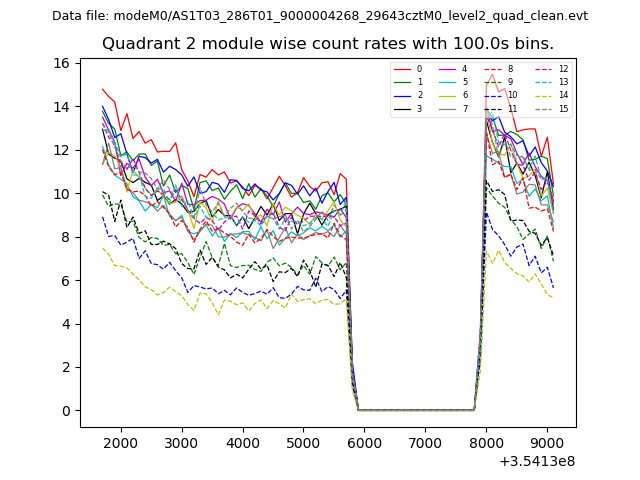
| Module-wise count rates for Quadrant B Data is divided into 100 sec bins |
 |
 |
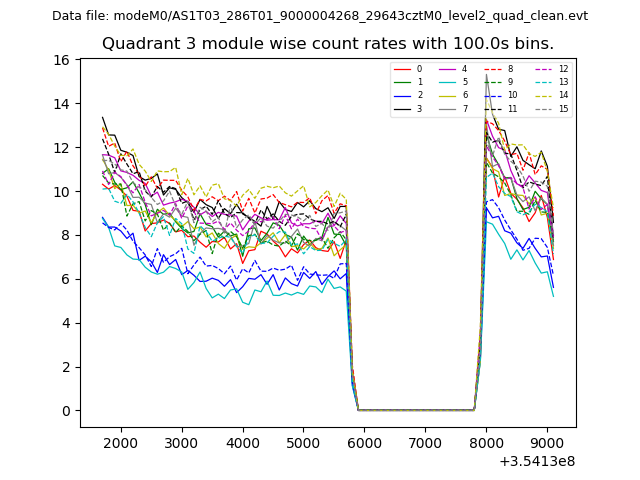
| Module-wise count rates for Quadrant C Data is divided into 100 sec bins |
 |
 |
| Module-wise count rates for Quadrant D Data is divided into 100 sec bins |
 |
 |
| Parameter | Plot |
|---|---|
| CZT HV Monitor | 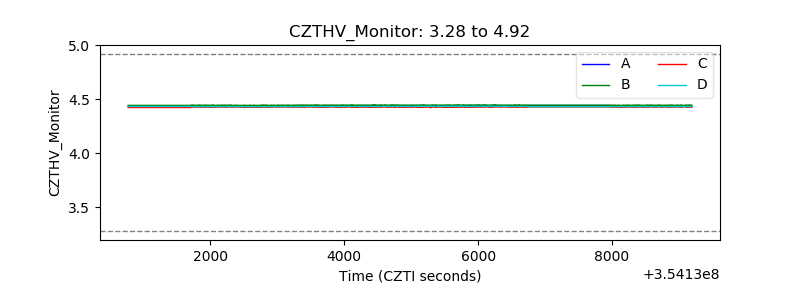 |
| D_VDD | 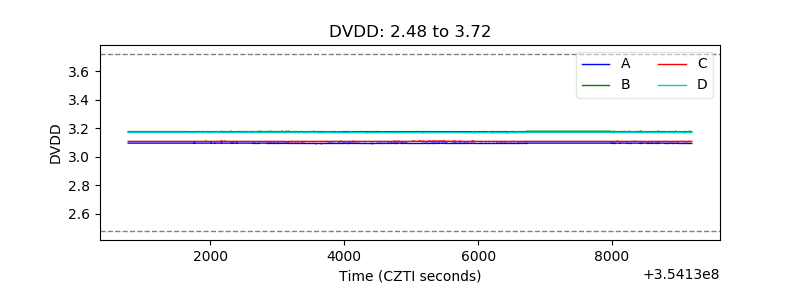 |
| Temperature 1 |  |
| Veto HV Monitor | 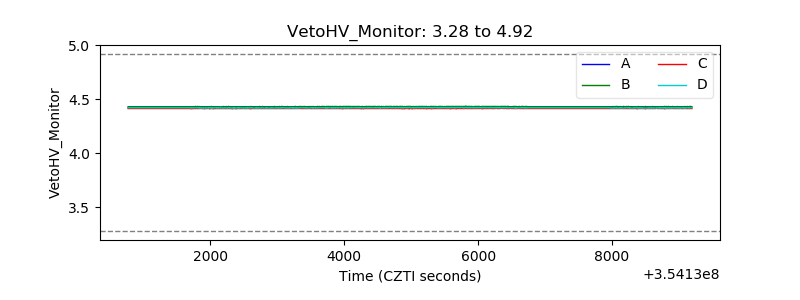 |
| Veto LLD | 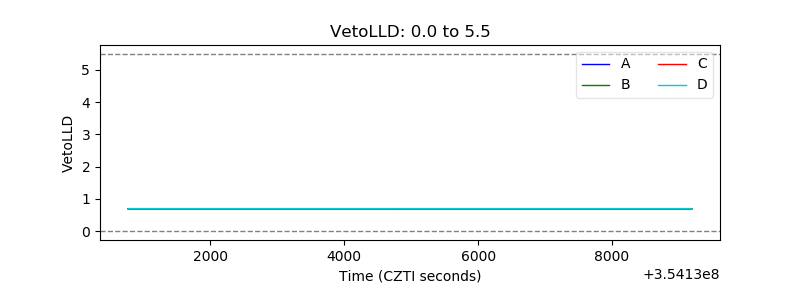 |
| Alpha Counter | 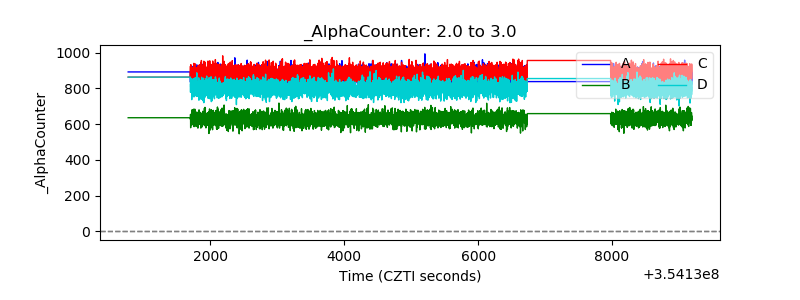 |
| _CPM_Rate | 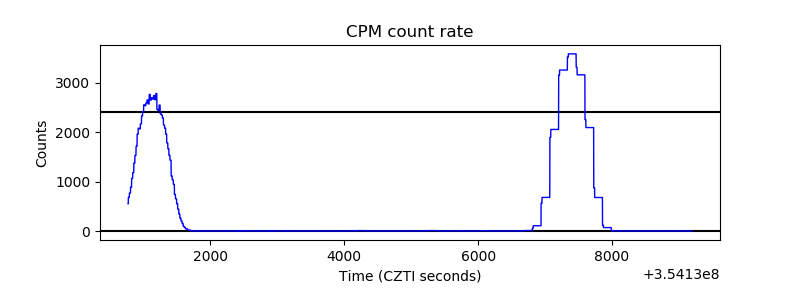 |
| CZT Counter | 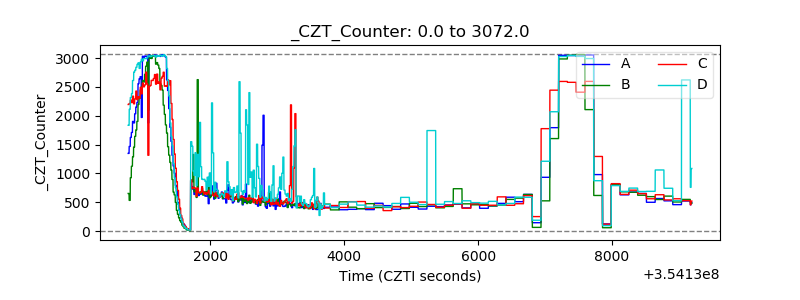 |
| +2.5 Volts monitor |  |
| +5 Volts monitor |  |
| _ROLL_ROT | 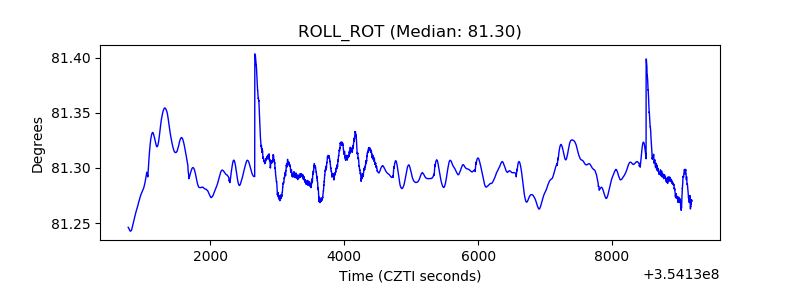 |
| _Roll_DEC | 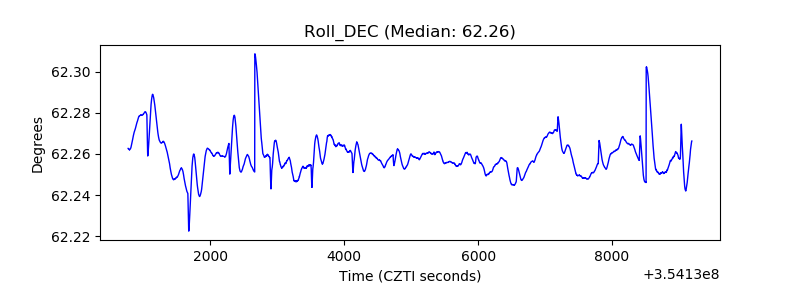 |
| _Roll_RA | 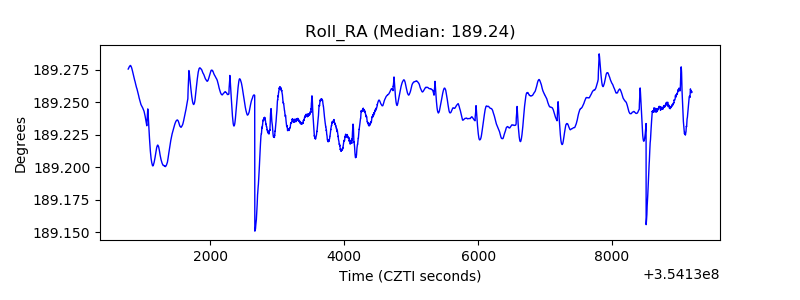 |
| Veto Counter | 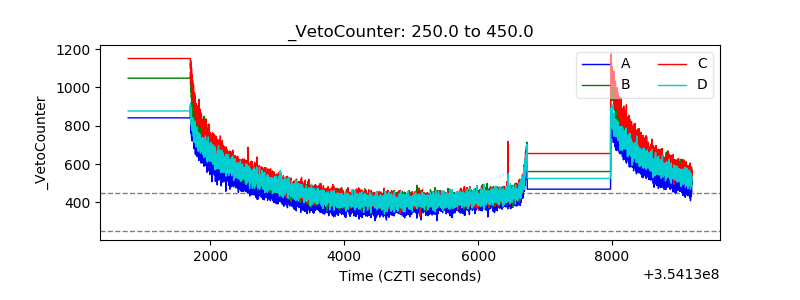 |