| Param | Original file | Final file |
|---|---|---|
| Filename | modeM0/AS1T03_286T01_9000004268_29644cztM0_level2.evt | modeM0/AS1T03_286T01_9000004268_29644cztM0_level2_quad_clean.evt |
| Size (bytes) | 492,932,160 | 112,608,000 |
| Size | 470.1 MB | 107.4 MB |
| Events in quadrant A | 3,048,693 | 741,301 |
| Events in quadrant B | 3,235,651 | 778,826 |
| Events in quadrant C | 3,338,021 | 757,397 |
| Events in quadrant D | 4,889,270 | 704,082 |
| Mode M9 | |||
|---|---|---|---|
| Quadrant | BADHDUFLAG | Total packets | Discarded packets |
| A | 0 | 19 | 0 |
| B | 0 | 20 | 0 |
| C | 0 | 20 | 0 |
| D | 0 | 20 | 0 |
| Mode SS | |||
|---|---|---|---|
| Quadrant | BADHDUFLAG | Total packets | Discarded packets |
| A | 0 | 124 | 0 |
| B | 0 | 124 | 0 |
| C | 0 | 124 | 0 |
| D | 0 | 124 | 0 |
| Mode M0 | |||
|---|---|---|---|
| Quadrant | BADHDUFLAG | Total packets | Discarded packets |
| A | 0 | 13120 | 2 |
| B | 0 | 13582 | 2 |
| C | 0 | 13959 | 2 |
| D | 0 | 18752 | 2 |
| Quadrant | Total seconds | Saturated seconds | Saturation percentage |
|---|---|---|---|
| A | 6146 | 45 | 0.732184% |
| B | 6145 | 87 | 1.415785% |
| C | 6145 | 134 | 2.180635% |
| D | 6145 | 418 | 6.802278% |
Noise dominated data is calculated using 1-second bins in cleaned event files. If a bin has >2000 counts, and if more than 50% of those come from <1% of pixels, then it is considered to be noise-dominated and hence unusable.
| Quadrant | # 1 sec bins | Bins with >0 counts | Bins with >2000 counts | High rate bins dominated by noise | Noise dominated (total time) | Noise dominated (detector-on time) | Marked lightcurve |
|---|---|---|---|---|---|---|---|
| A | 7416 | 6147 | 0 | 0 | 0.00% | 0.00% | 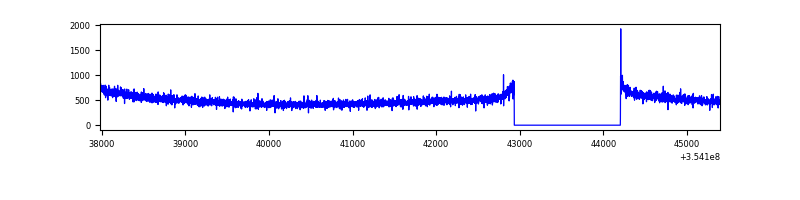 |
| B | 7415 | 6145 | 10 | 10 | 0.13% | 0.16% | 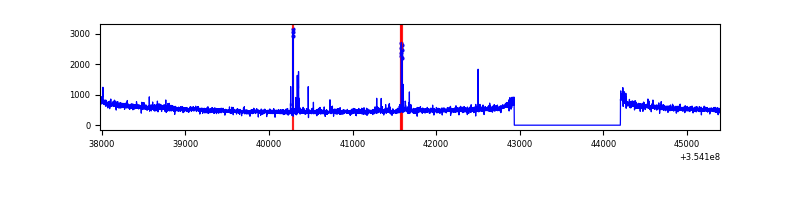 |
| C | 7415 | 6145 | 7 | 7 | 0.09% | 0.11% | 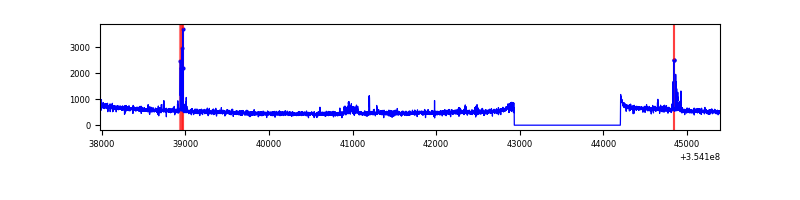 |
| D | 7415 | 6145 | 306 | 306 | 4.13% | 4.98% | 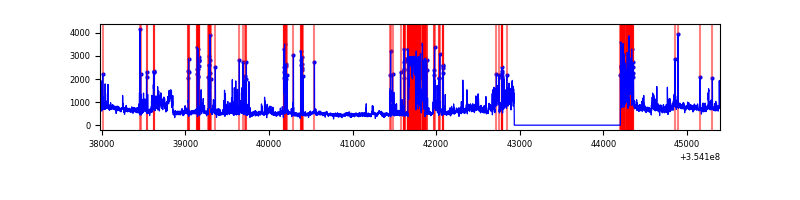 |
Top three noisy pixels from each quadrant. If the there are fewer than three noisy pixels in the level2.evt file, extra rows are filled as -1
| Pixel properties | Quadrant properties | ||||||
|---|---|---|---|---|---|---|---|
| Quadrant | DetID | PixID | Counts | Sigma | Mean | Median | Sigma |
| A | 13 | 254 | 11355 | 67.56 | 789 | 774 | 156.6 |
| A | 3 | 137 | 7524 | 43.1 | 789 | 774 | 156.6 |
| A | 0 | 226 | 6543 | 36.84 | 789 | 774 | 156.6 |
| B | 15 | 33 | 64852 | 435.53 | 801 | 781 | 147.1 |
| B | 12 | 111 | 17559 | 114.05 | 801 | 781 | 147.1 |
| B | 11 | 111 | 15899 | 102.77 | 801 | 781 | 147.1 |
| C | 14 | 238 | 128259 | 701.14 | 788 | 796 | 181.8 |
| C | 10 | 22 | 80046 | 435.94 | 788 | 796 | 181.8 |
| C | 15 | 208 | 38473 | 207.25 | 788 | 796 | 181.8 |
| D | 7 | 80 | 1033646 | 5812.73 | 757 | 739 | 177.7 |
| D | 8 | 195 | 506723 | 2847.45 | 757 | 739 | 177.7 |
| D | 2 | 250 | 149163 | 835.26 | 757 | 739 | 177.7 |
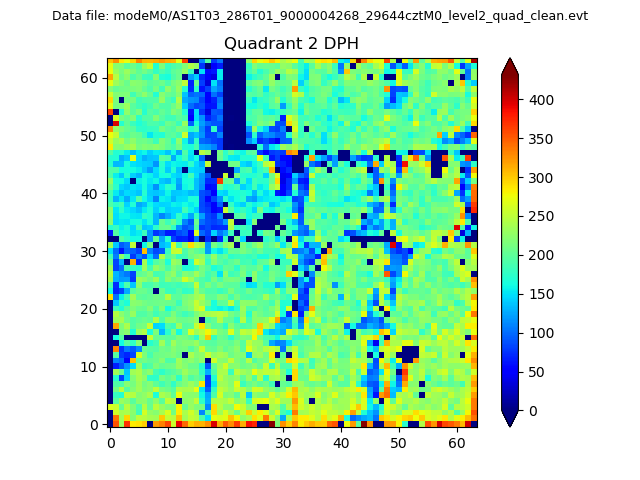
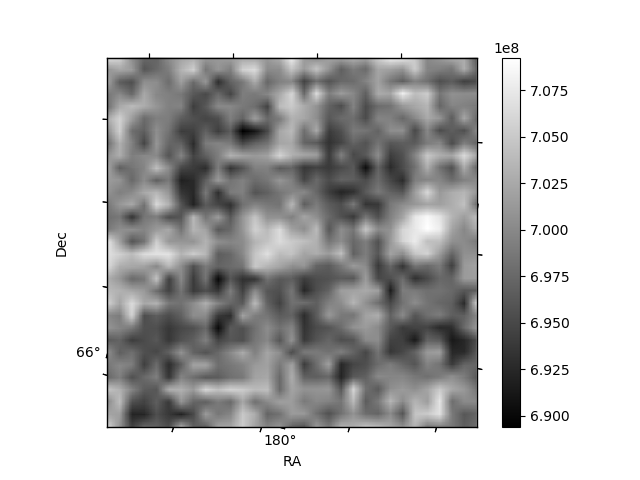
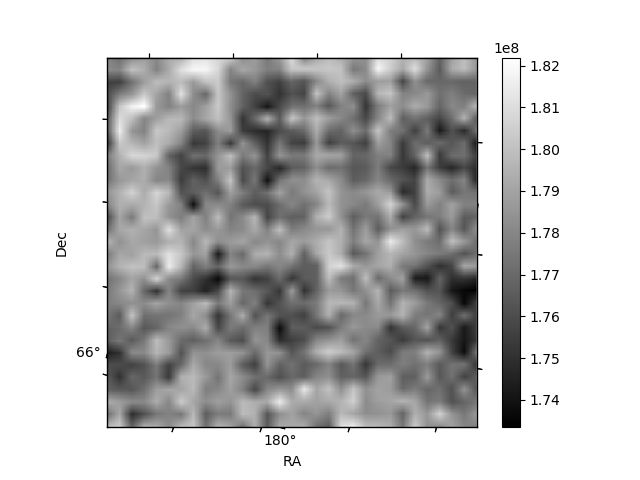
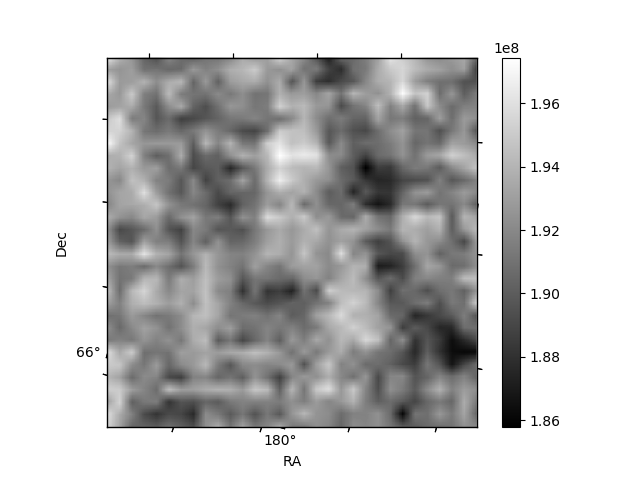
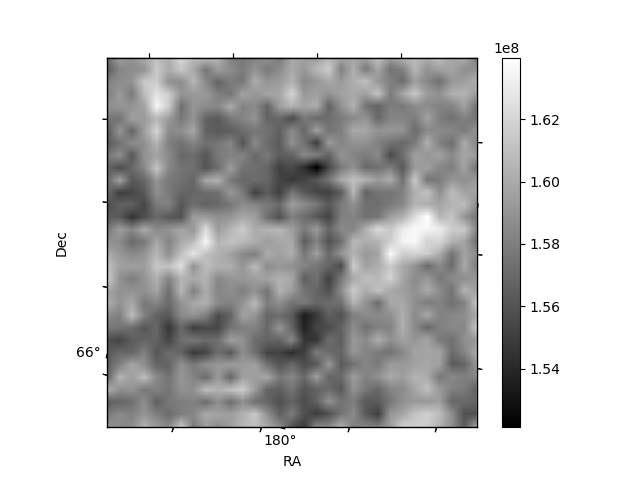
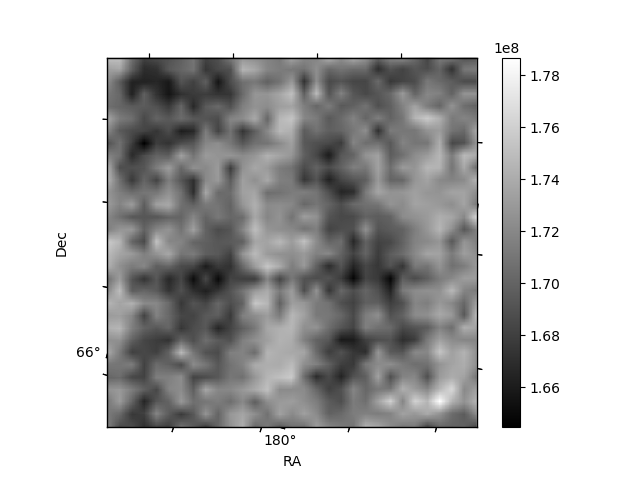
Histogram calculated using DETX and DETY for each event in the final _common_clean file
| Quadrant A | 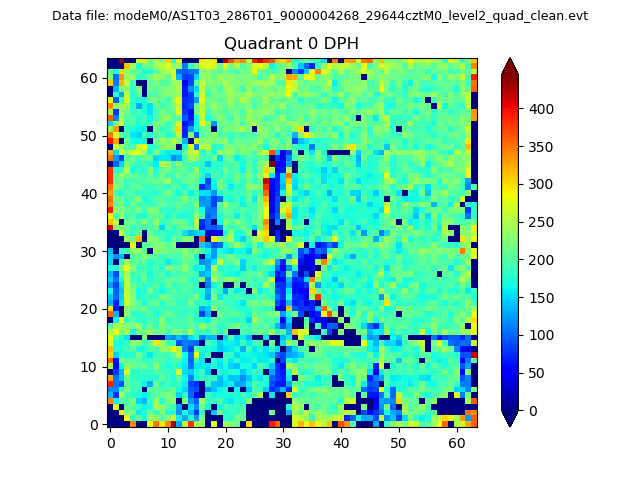 |
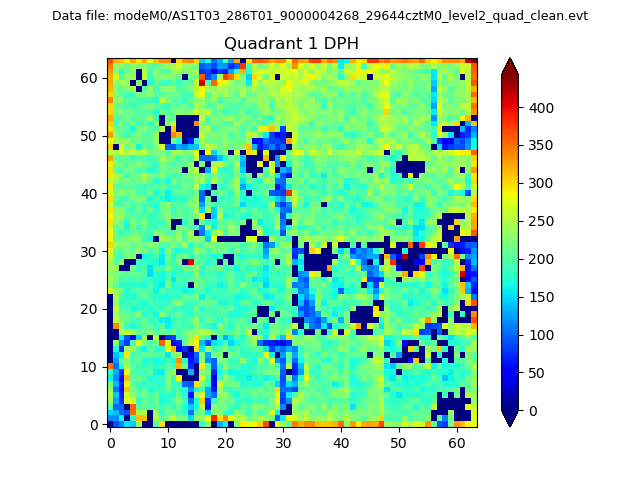 |
Quadrant B |
|---|---|---|---|
| Quadrant D | 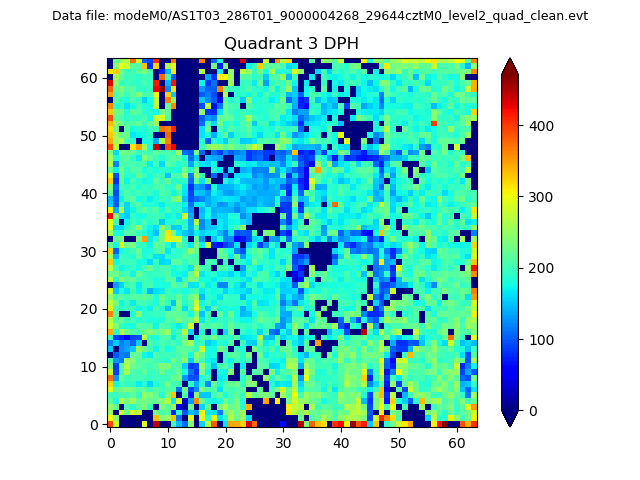 |
 |
Quadrant C |
| Plot type | Count rate plots | Images |
|---|---|---|
| Comparison with Poisson distribution Blue bars denote a histogram of data divided into 1 sec bins. Red curve is a Poisson curve with rate = median count rate of data. |
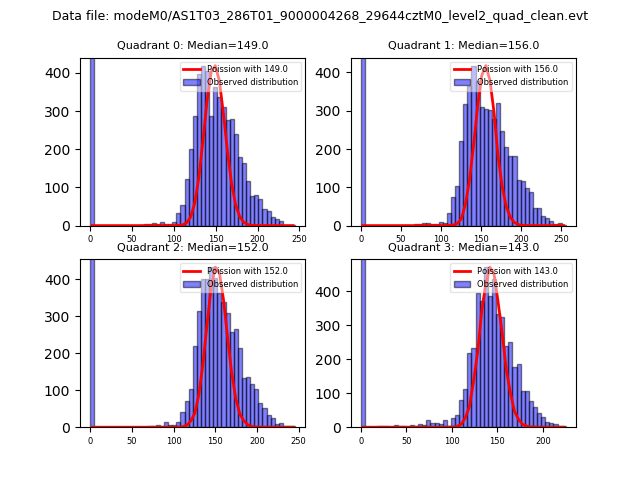 |
 |
| Quadrant-wise count rates Data is divided into 100 sec bins |
 |
|
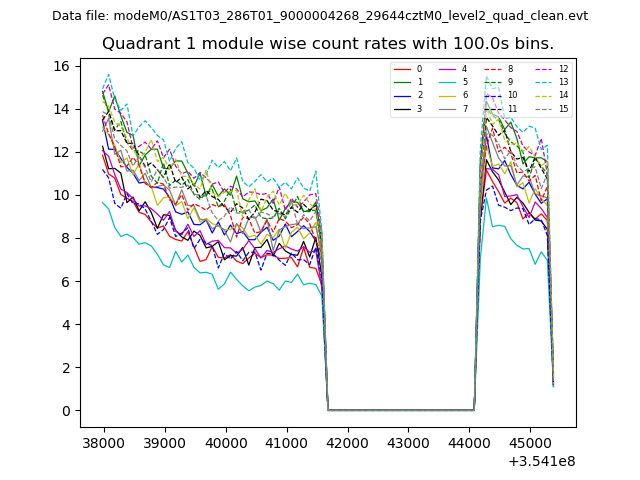
| Module-wise count rates for Quadrant A Data is divided into 100 sec bins |
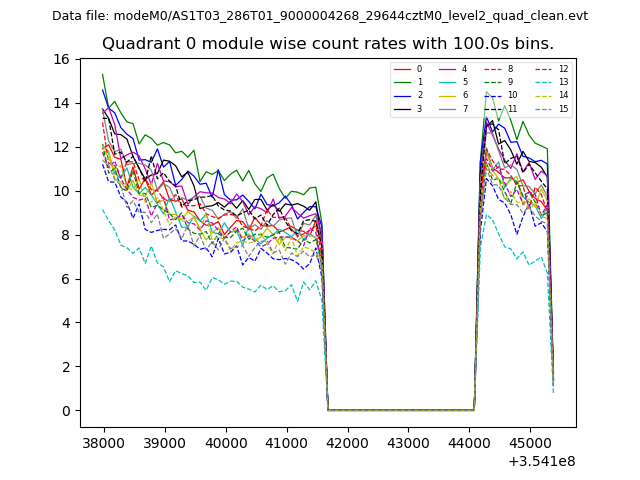 |
 |
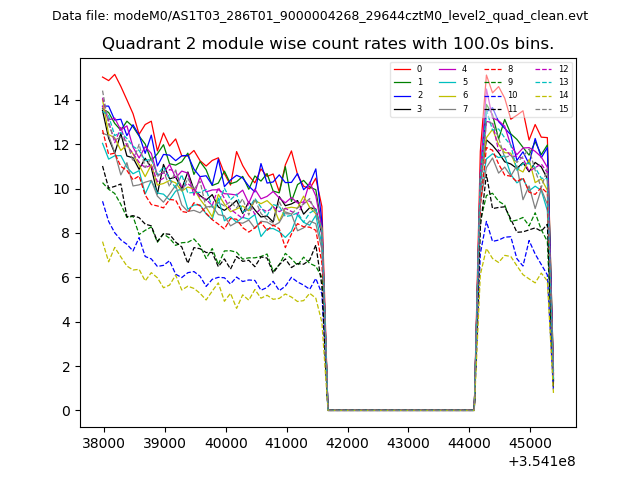
| Module-wise count rates for Quadrant B Data is divided into 100 sec bins |
 |
 |
| Module-wise count rates for Quadrant C Data is divided into 100 sec bins |
 |
 |
| Module-wise count rates for Quadrant D Data is divided into 100 sec bins |
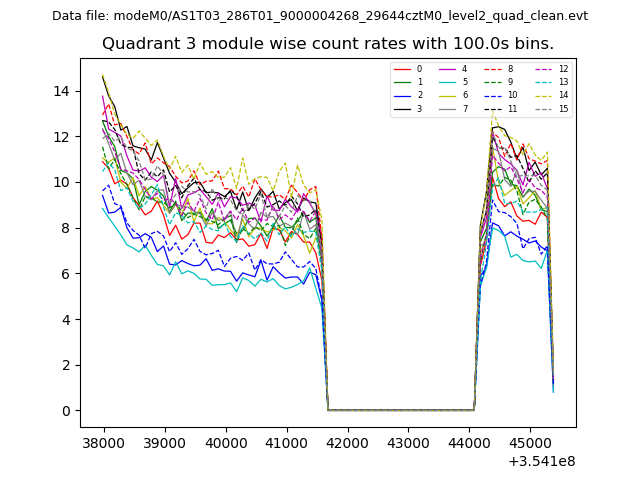 |
 |
| Parameter | Plot |
|---|---|
| CZT HV Monitor | 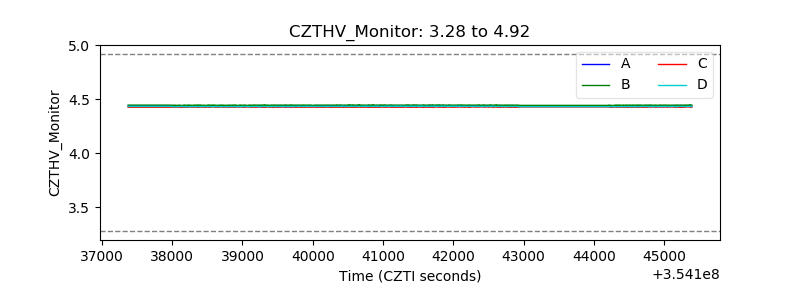 |
| D_VDD | 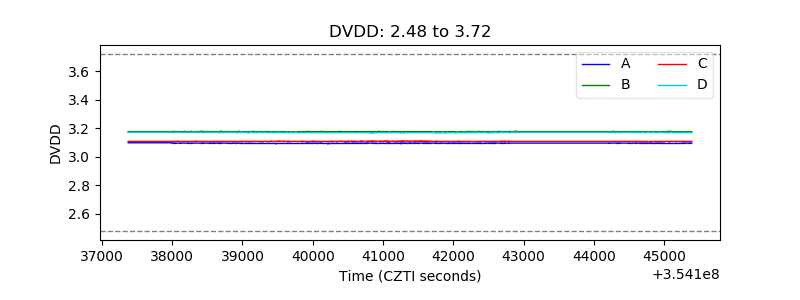 |
| Temperature 1 | 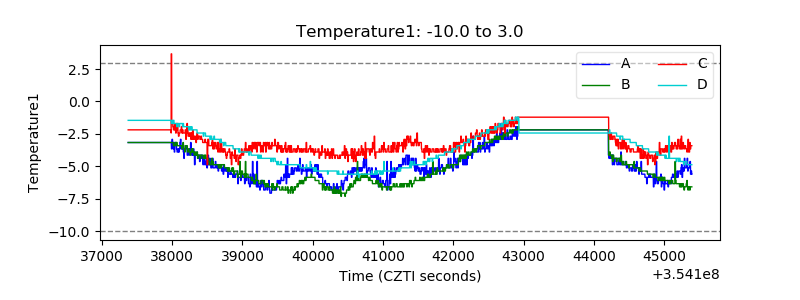 |
| Veto HV Monitor | 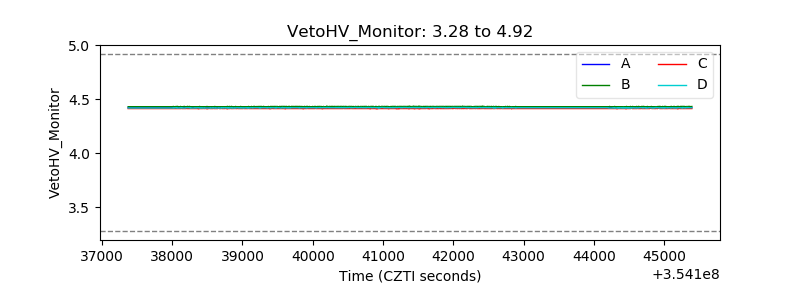 |
| Veto LLD | 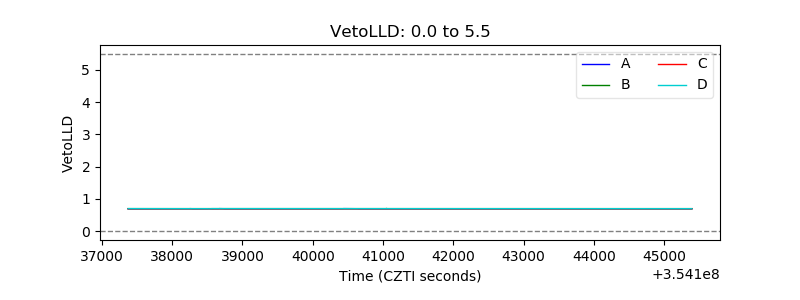 |
| Alpha Counter | 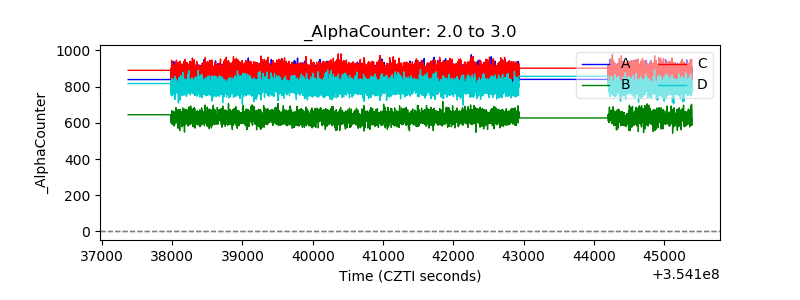 |
| _CPM_Rate | 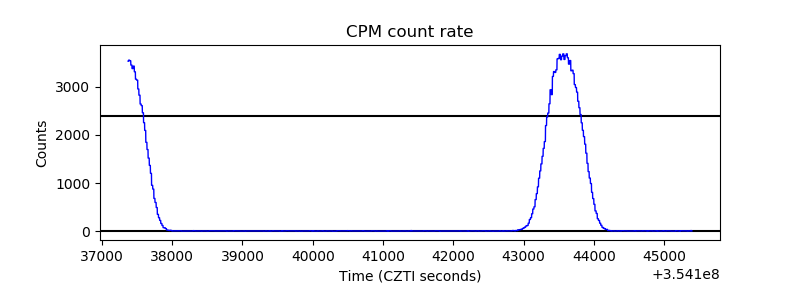 |
| CZT Counter | 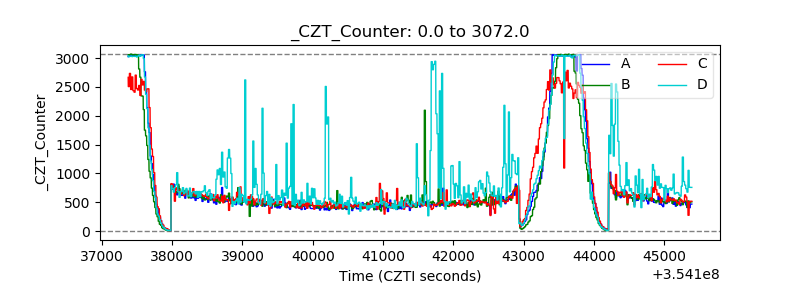 |
| +2.5 Volts monitor |  |
| +5 Volts monitor |  |
| _ROLL_ROT | 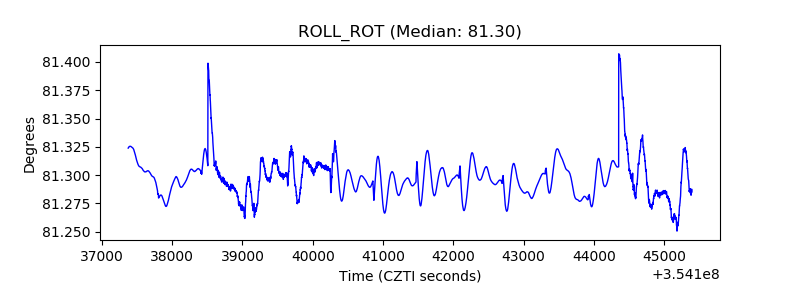 |
| _Roll_DEC | 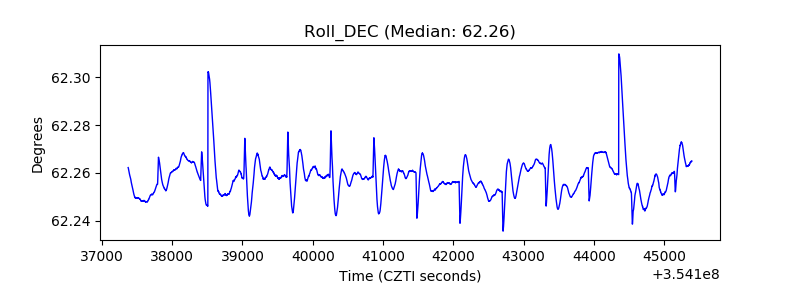 |
| _Roll_RA | 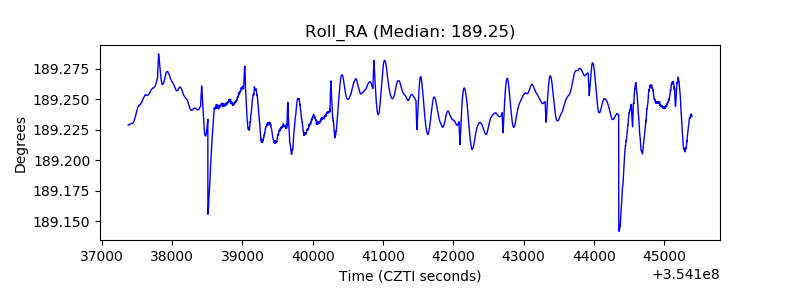 |
| Veto Counter | 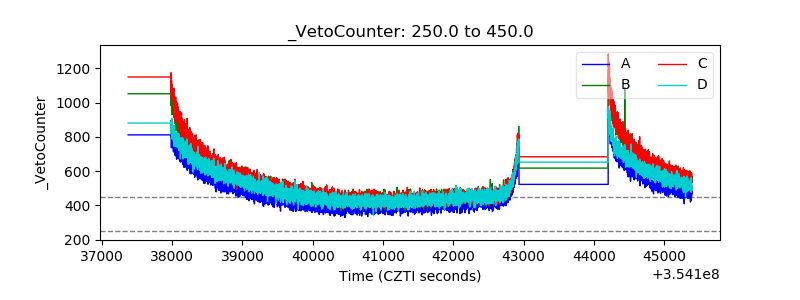 |