| Param | Original file | Final file |
|---|---|---|
| Filename | modeM0/AS1T03_286T01_9000004268_29646cztM0_level2.evt | modeM0/AS1T03_286T01_9000004268_29646cztM0_level2_quad_clean.evt |
| Size (bytes) | 359,182,080 | 74,105,280 |
| Size | 342.5 MB | 70.7 MB |
| Events in quadrant A | 2,328,197 | 475,673 |
| Events in quadrant B | 2,459,530 | 495,958 |
| Events in quadrant C | 2,453,918 | 477,746 |
| Events in quadrant D | 3,300,132 | 448,493 |
| Mode M9 | |||
|---|---|---|---|
| Quadrant | BADHDUFLAG | Total packets | Discarded packets |
| A | 0 | 10 | 0 |
| B | 0 | 11 | 0 |
| C | 0 | 11 | 0 |
| D | 0 | 11 | 0 |
| Mode SS | |||
|---|---|---|---|
| Quadrant | BADHDUFLAG | Total packets | Discarded packets |
| A | 0 | 100 | 0 |
| B | 0 | 100 | 0 |
| C | 0 | 100 | 0 |
| D | 0 | 100 | 0 |
| Mode M0 | |||
|---|---|---|---|
| Quadrant | BADHDUFLAG | Total packets | Discarded packets |
| A | 0 | 10146 | 1 |
| B | 0 | 10427 | 1 |
| C | 0 | 10414 | 1 |
| D | 0 | 13266 | 1 |
| Quadrant | Total seconds | Saturated seconds | Saturation percentage |
|---|---|---|---|
| A | 4931 | 10 | 0.202799% |
| B | 4931 | 21 | 0.425877% |
| C | 4931 | 51 | 1.034273% |
| D | 4931 | 129 | 2.616102% |
Noise dominated data is calculated using 1-second bins in cleaned event files. If a bin has >2000 counts, and if more than 50% of those come from <1% of pixels, then it is considered to be noise-dominated and hence unusable.
| Quadrant | # 1 sec bins | Bins with >0 counts | Bins with >2000 counts | High rate bins dominated by noise | Noise dominated (total time) | Noise dominated (detector-on time) | Marked lightcurve |
|---|---|---|---|---|---|---|---|
| A | 4931 | 4931 | 0 | 0 | 0.00% | 0.00% | 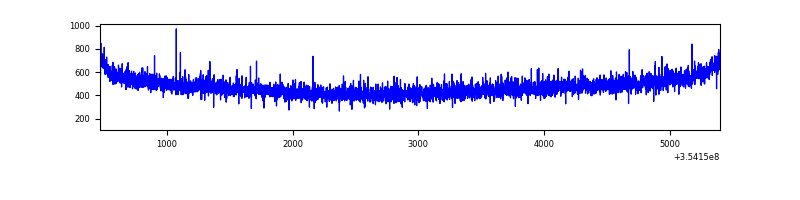 |
| B | 4931 | 4931 | 8 | 8 | 0.16% | 0.16% | 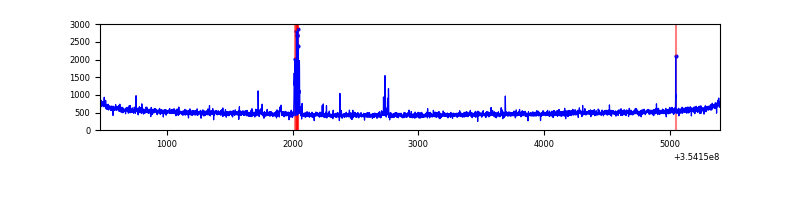 |
| C | 4931 | 4931 | 0 | 0 | 0.00% | 0.00% | 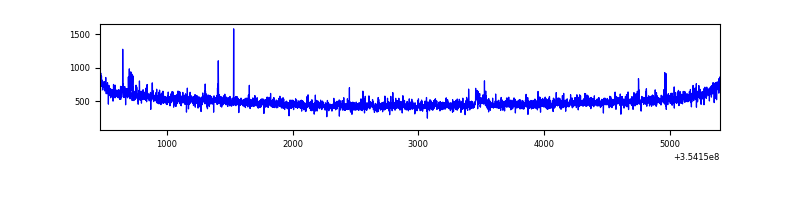 |
| D | 4931 | 4931 | 112 | 112 | 2.27% | 2.27% | 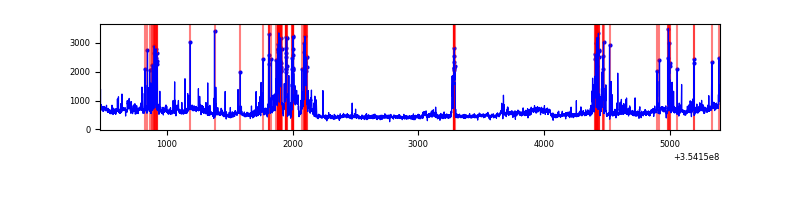 |
Top three noisy pixels from each quadrant. If the there are fewer than three noisy pixels in the level2.evt file, extra rows are filled as -1
| Pixel properties | Quadrant properties | ||||||
|---|---|---|---|---|---|---|---|
| Quadrant | DetID | PixID | Counts | Sigma | Mean | Median | Sigma |
| A | 13 | 254 | 9362 | 72.55 | 603 | 590 | 120.9 |
| A | 3 | 137 | 5700 | 42.26 | 603 | 590 | 120.9 |
| A | 0 | 226 | 5050 | 36.89 | 603 | 590 | 120.9 |
| B | 15 | 33 | 56099 | 485.83 | 609 | 593 | 114.3 |
| B | 12 | 111 | 13880 | 116.3 | 609 | 593 | 114.3 |
| B | 11 | 111 | 12389 | 103.25 | 609 | 593 | 114.3 |
| C | 14 | 238 | 97611 | 713.49 | 590 | 595 | 136.0 |
| C | 3 | 233 | 22779 | 163.15 | 590 | 595 | 136.0 |
| C | 7 | 247 | 12536 | 87.82 | 590 | 595 | 136.0 |
| D | 13 | 153 | 485890 | 3579.72 | 577 | 562 | 135.6 |
| D | 8 | 195 | 340155 | 2504.8 | 577 | 562 | 135.6 |
| D | 2 | 250 | 148303 | 1089.72 | 577 | 562 | 135.6 |
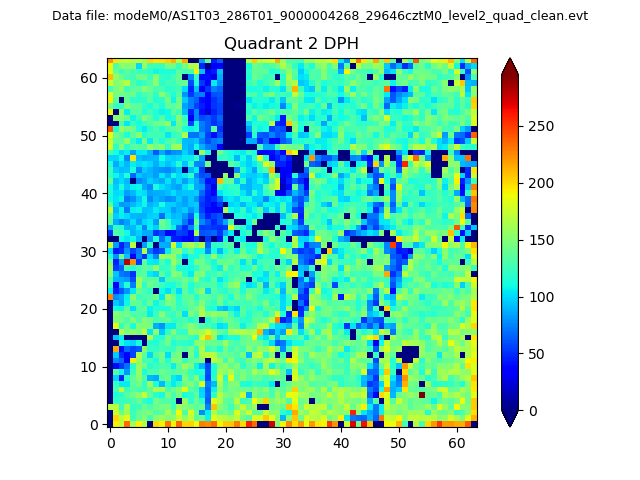
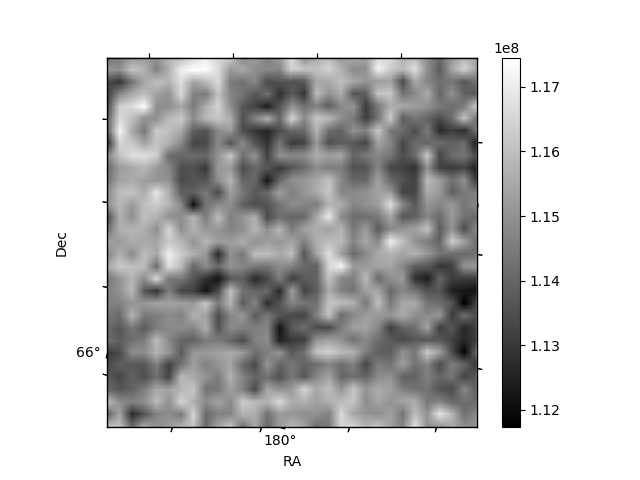
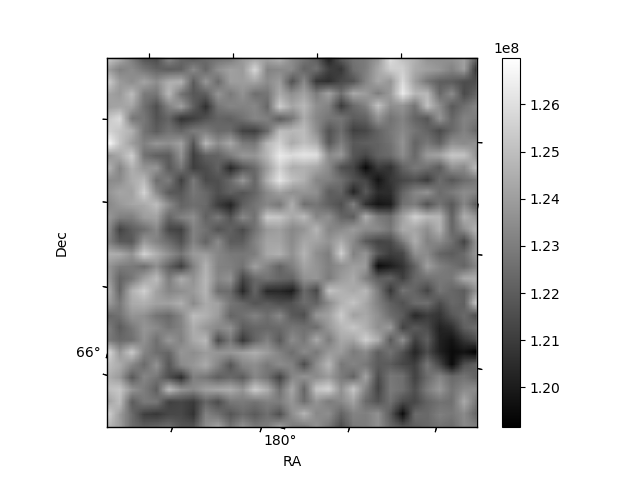
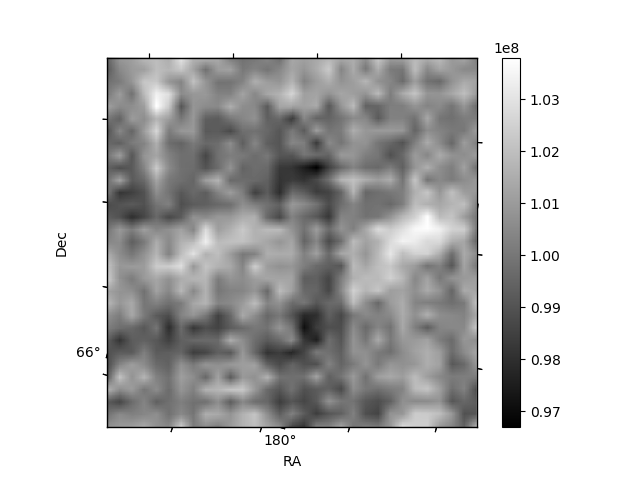
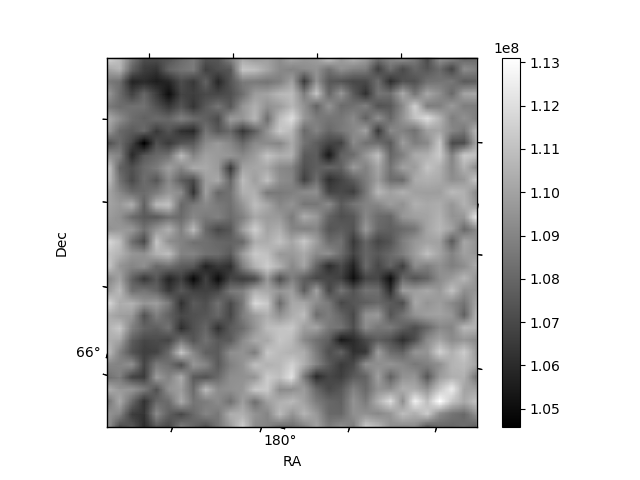
Histogram calculated using DETX and DETY for each event in the final _common_clean file
| Quadrant A | 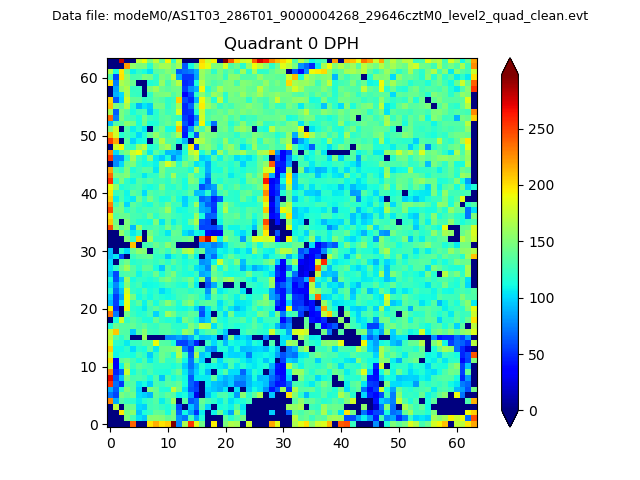 |
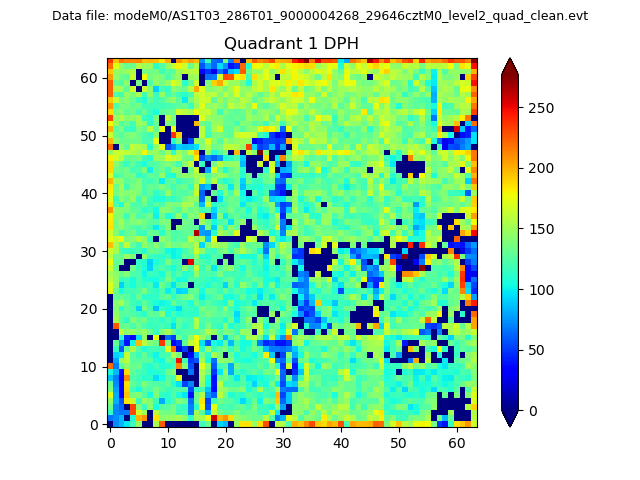 |
Quadrant B |
|---|---|---|---|
| Quadrant D | 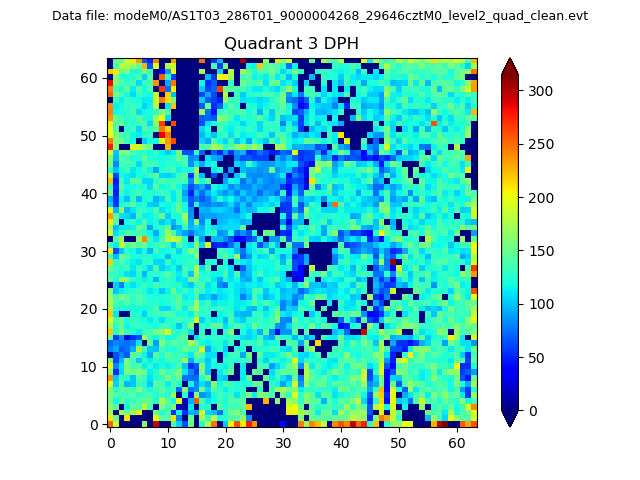 |
 |
Quadrant C |
| Plot type | Count rate plots | Images |
|---|---|---|
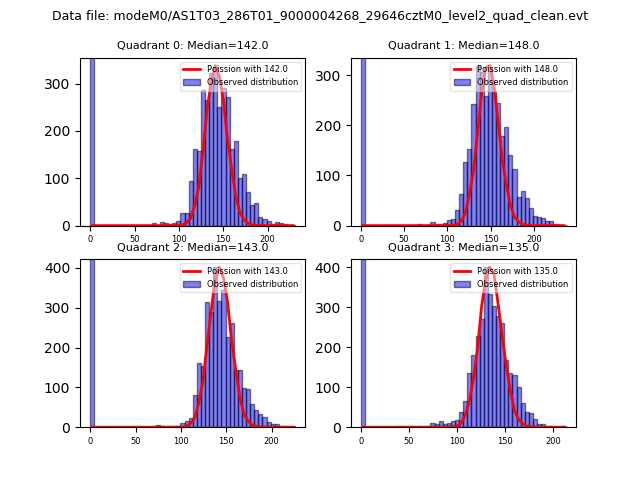
| Comparison with Poisson distribution Blue bars denote a histogram of data divided into 1 sec bins. Red curve is a Poisson curve with rate = median count rate of data. |
 |
 |
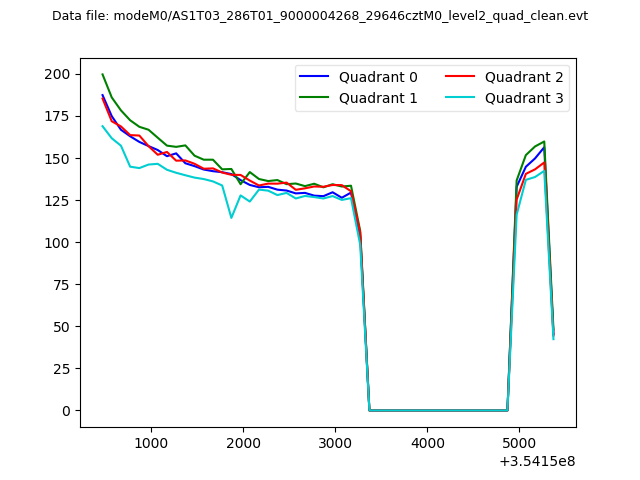
| Quadrant-wise count rates Data is divided into 100 sec bins |
 |
|
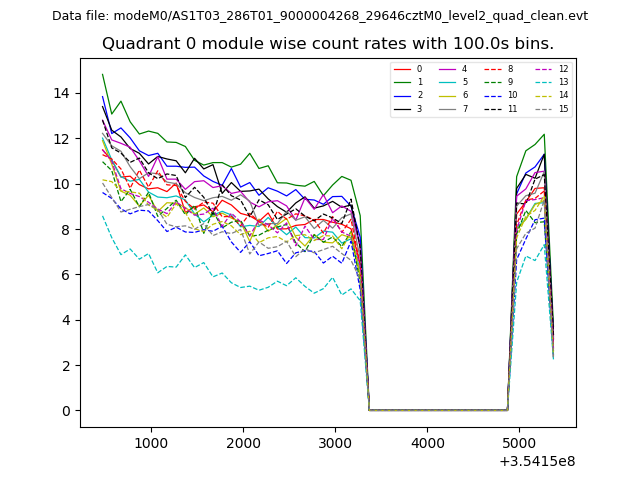
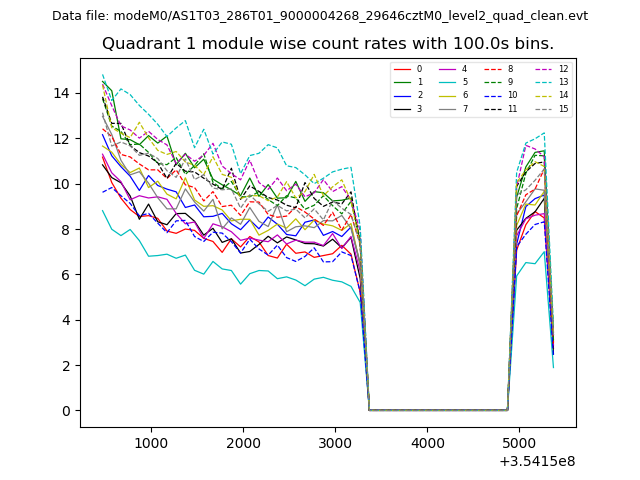
| Module-wise count rates for Quadrant A Data is divided into 100 sec bins |
 |
 |
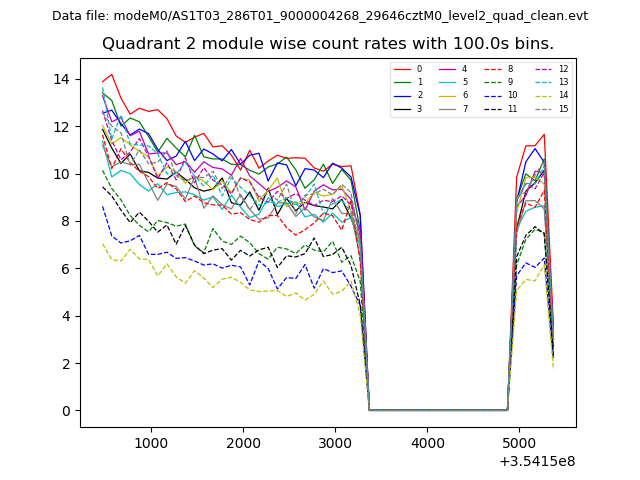
| Module-wise count rates for Quadrant B Data is divided into 100 sec bins |
 |
 |
| Module-wise count rates for Quadrant C Data is divided into 100 sec bins |
 |
 |
| Module-wise count rates for Quadrant D Data is divided into 100 sec bins |
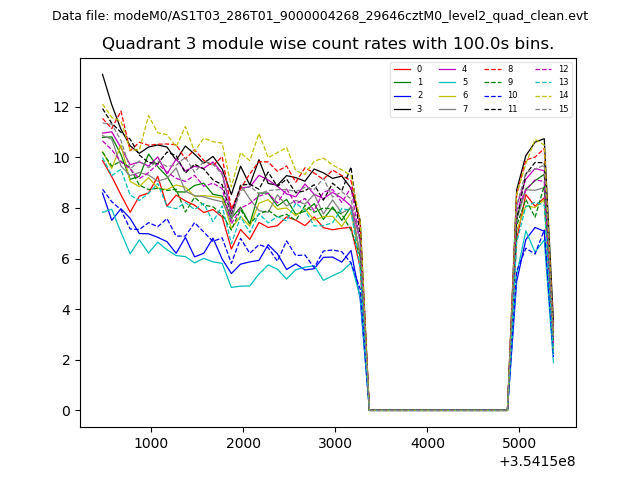 |
 |
| Parameter | Plot |
|---|---|
| CZT HV Monitor | 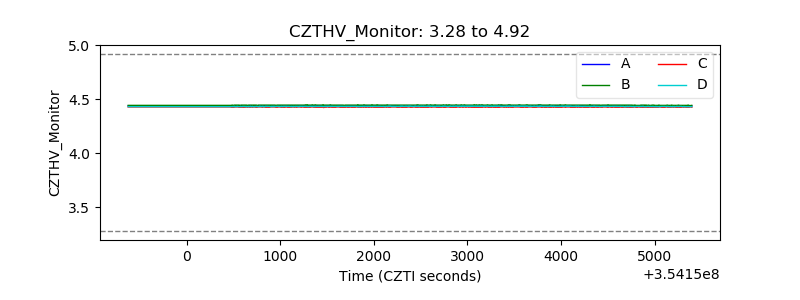 |
| D_VDD | 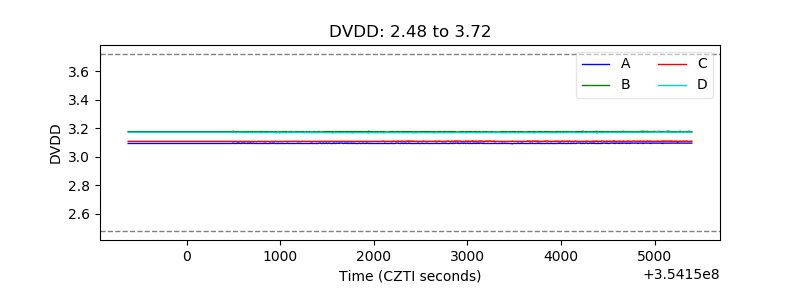 |
| Temperature 1 | 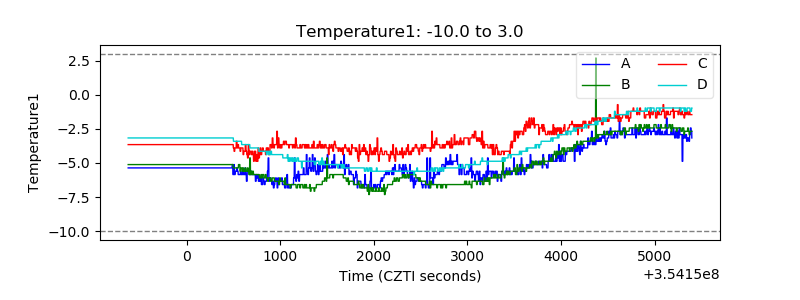 |
| Veto HV Monitor | 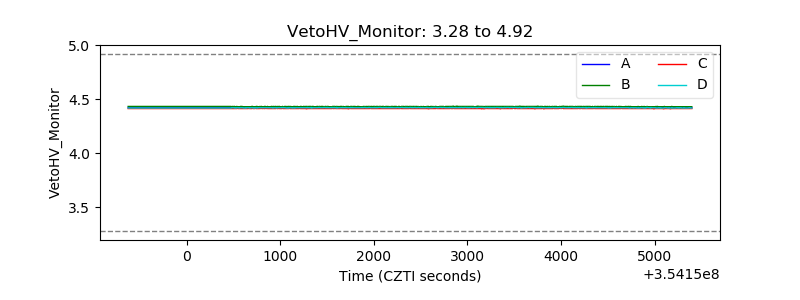 |
| Veto LLD | 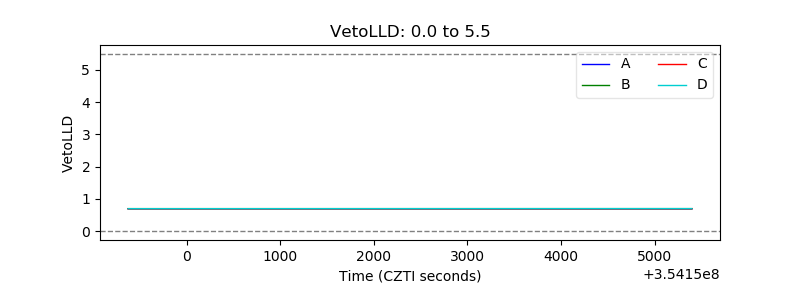 |
| Alpha Counter |  |
| _CPM_Rate | 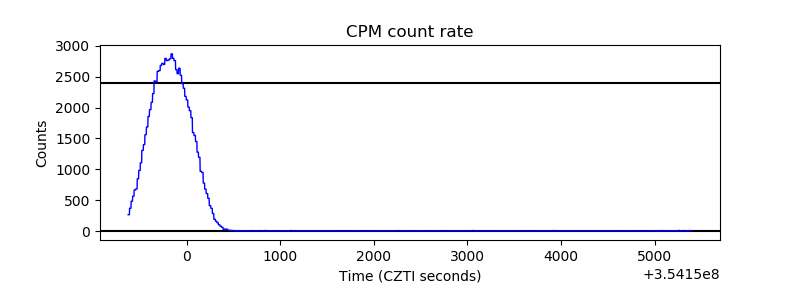 |
| CZT Counter | 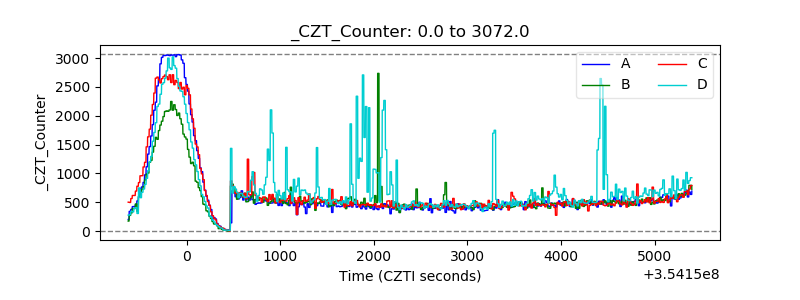 |
| +2.5 Volts monitor |  |
| +5 Volts monitor |  |
| _ROLL_ROT | 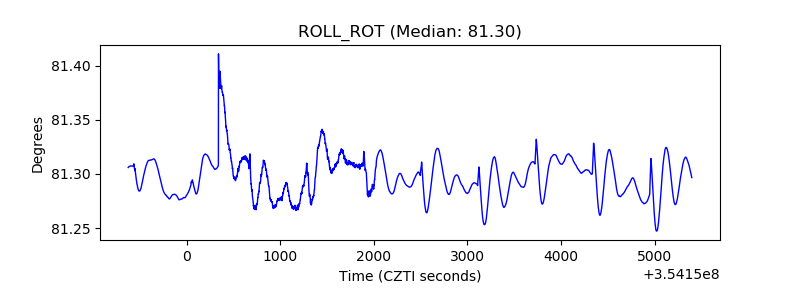 |
| _Roll_DEC | 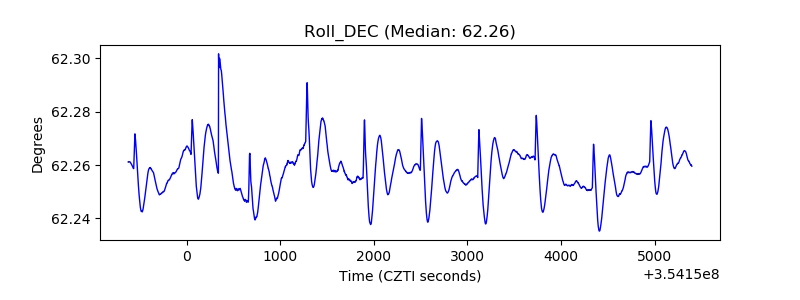 |
| _Roll_RA | 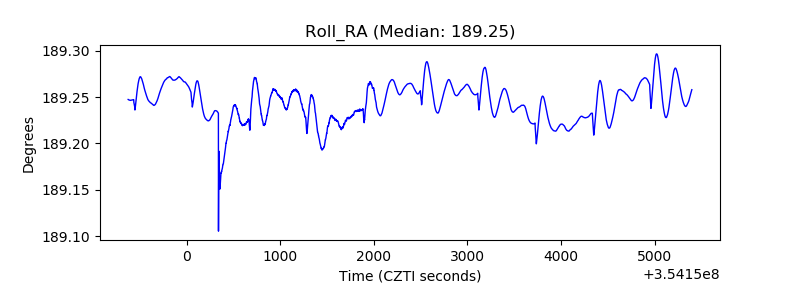 |
| Veto Counter | 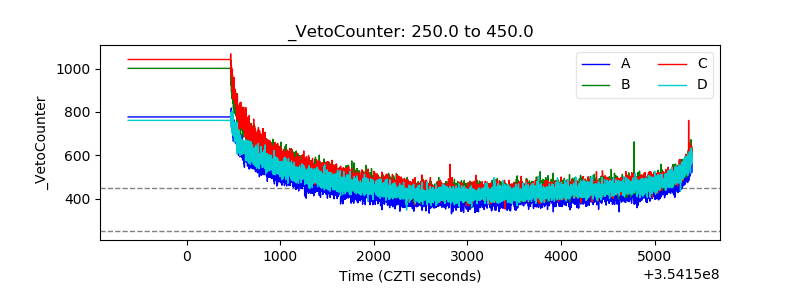 |