| Param | Original file | Final file |
|---|---|---|
| Filename | modeM0/AS1C05_019T01_9000004270_29646cztM0_level2.evt | modeM0/AS1C05_019T01_9000004270_29646cztM0_level2_quad_clean.evt |
| Size (bytes) | 97,637,760 | 28,892,160 |
| Size | 93.1 MB | 27.6 MB |
| Events in quadrant A | 635,598 | 193,230 |
| Events in quadrant B | 664,860 | 201,545 |
| Events in quadrant C | 677,484 | 194,532 |
| Events in quadrant D | 883,195 | 183,013 |
| Mode M9 | |||
|---|---|---|---|
| Quadrant | BADHDUFLAG | Total packets | Discarded packets |
| A | 0 | 9 | 0 |
| B | 0 | 9 | 0 |
| C | 0 | 9 | 0 |
| D | 0 | 9 | 0 |
| Mode SS | |||
|---|---|---|---|
| Quadrant | BADHDUFLAG | Total packets | Discarded packets |
| A | 0 | 28 | 0 |
| B | 0 | 28 | 0 |
| C | 0 | 28 | 0 |
| D | 0 | 28 | 0 |
| Mode M0 | |||
|---|---|---|---|
| Quadrant | BADHDUFLAG | Total packets | Discarded packets |
| A | 0 | 2785 | 1 |
| B | 0 | 2799 | 1 |
| C | 0 | 2847 | 1 |
| D | 0 | 3494 | 1 |
| Quadrant | Total seconds | Saturated seconds | Saturation percentage |
|---|---|---|---|
| A | 1364 | 2 | 0.146628% |
| B | 1364 | 2 | 0.146628% |
| C | 1364 | 5 | 0.366569% |
| D | 1364 | 35 | 2.565982% |
Noise dominated data is calculated using 1-second bins in cleaned event files. If a bin has >2000 counts, and if more than 50% of those come from <1% of pixels, then it is considered to be noise-dominated and hence unusable.
| Quadrant | # 1 sec bins | Bins with >0 counts | Bins with >2000 counts | High rate bins dominated by noise | Noise dominated (total time) | Noise dominated (detector-on time) | Marked lightcurve |
|---|---|---|---|---|---|---|---|
| A | 1364 | 1364 | 0 | 0 | 0.00% | 0.00% | 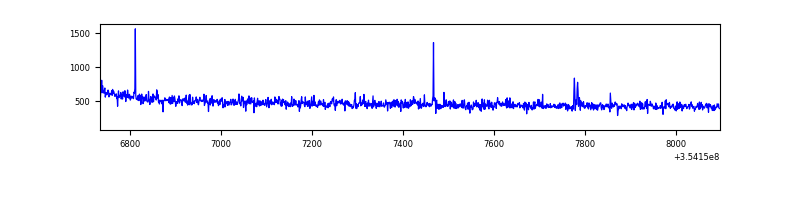 |
| B | 1364 | 1364 | 0 | 0 | 0.00% | 0.00% | 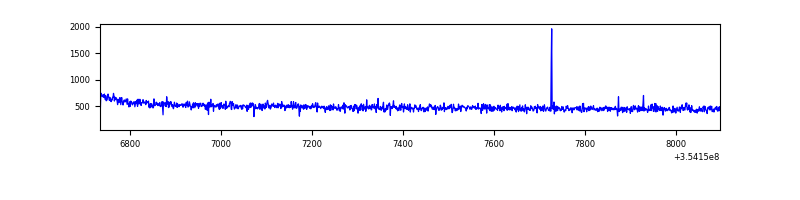 |
| C | 1364 | 1364 | 0 | 0 | 0.00% | 0.00% | 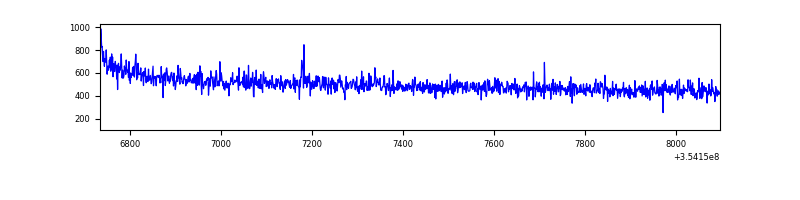 |
| D | 1364 | 1364 | 29 | 29 | 2.13% | 2.13% | 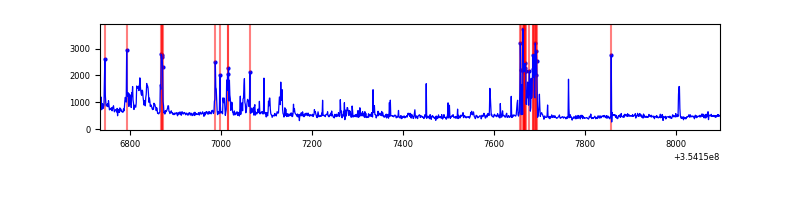 |
Top three noisy pixels from each quadrant. If the there are fewer than three noisy pixels in the level2.evt file, extra rows are filled as -1
| Pixel properties | Quadrant properties | ||||||
|---|---|---|---|---|---|---|---|
| Quadrant | DetID | PixID | Counts | Sigma | Mean | Median | Sigma |
| A | 12 | 96 | 4622 | 129.86 | 163 | 160 | 34.4 |
| A | 13 | 254 | 2619 | 71.57 | 163 | 160 | 34.4 |
| A | 0 | 13 | 1596 | 41.79 | 163 | 160 | 34.4 |
| B | 12 | 111 | 3753 | 108.75 | 168 | 164 | 33.0 |
| B | 11 | 111 | 3442 | 99.32 | 168 | 164 | 33.0 |
| B | 14 | 111 | 3320 | 95.63 | 168 | 164 | 33.0 |
| C | 14 | 238 | 26242 | 645.42 | 165 | 166 | 40.4 |
| C | 2 | 114 | 3223 | 75.67 | 165 | 166 | 40.4 |
| C | 3 | 233 | 2526 | 58.41 | 165 | 166 | 40.4 |
| D | 13 | 153 | 74223 | 1882.66 | 158 | 154 | 39.3 |
| D | 8 | 195 | 58485 | 1482.64 | 158 | 154 | 39.3 |
| D | 13 | 104 | 56718 | 1437.73 | 158 | 154 | 39.3 |
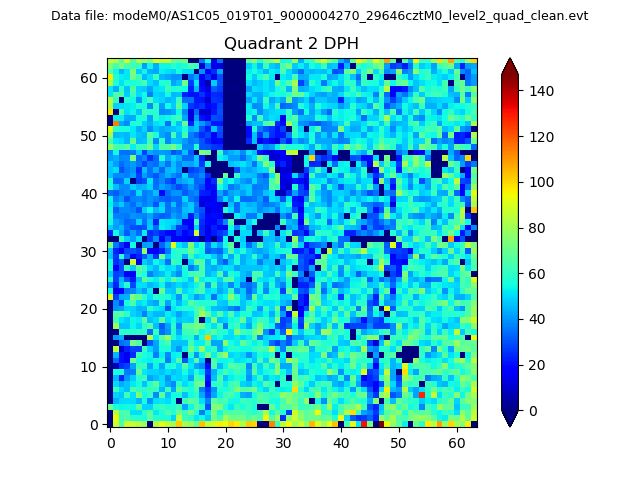
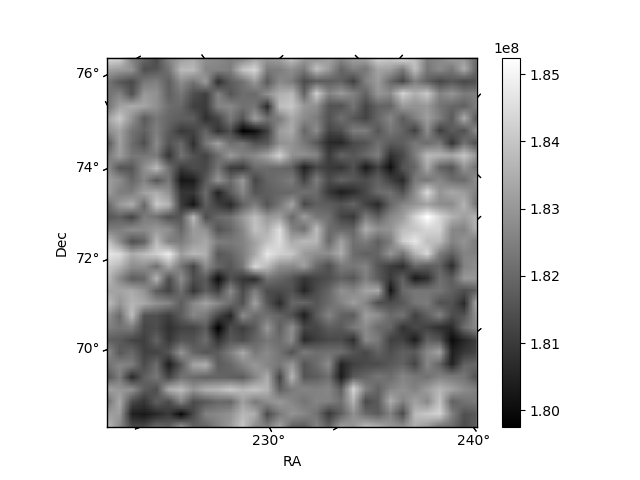
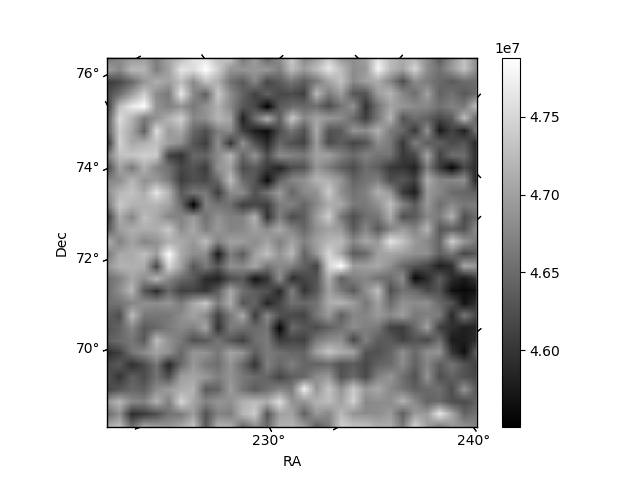
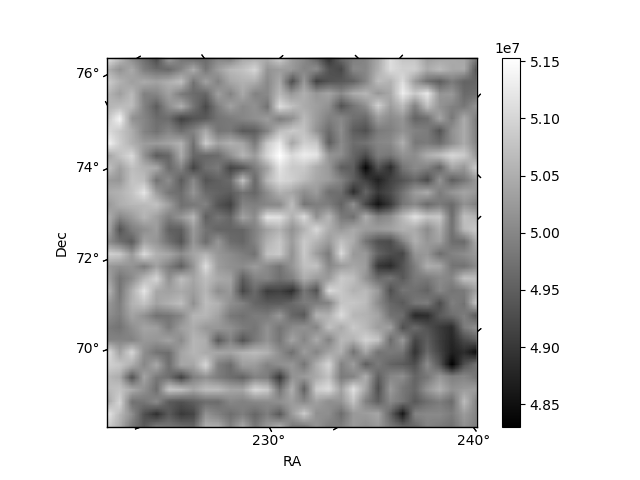
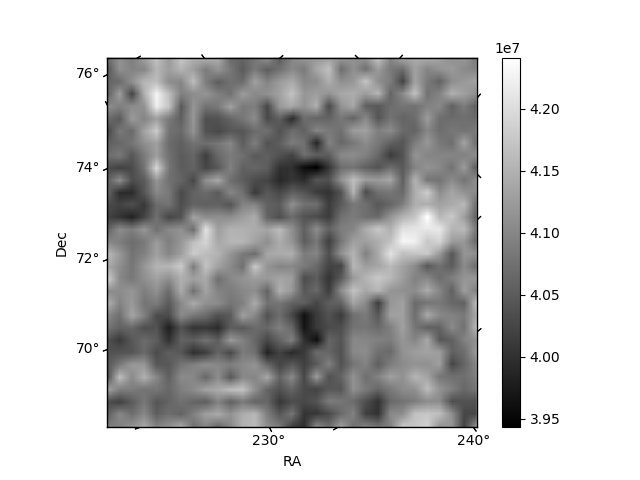
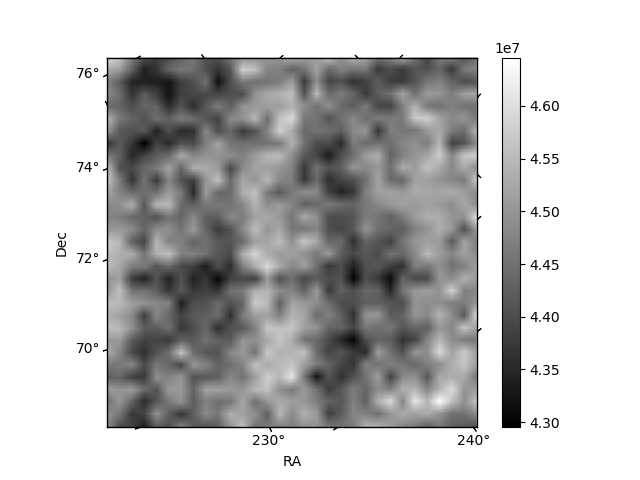
Histogram calculated using DETX and DETY for each event in the final _common_clean file
| Quadrant A | 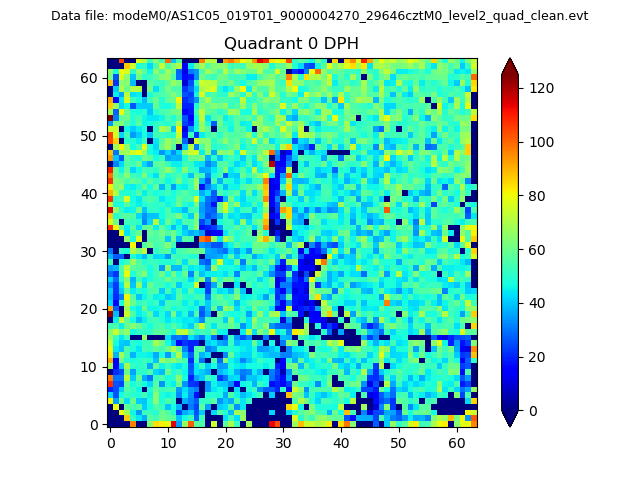 |
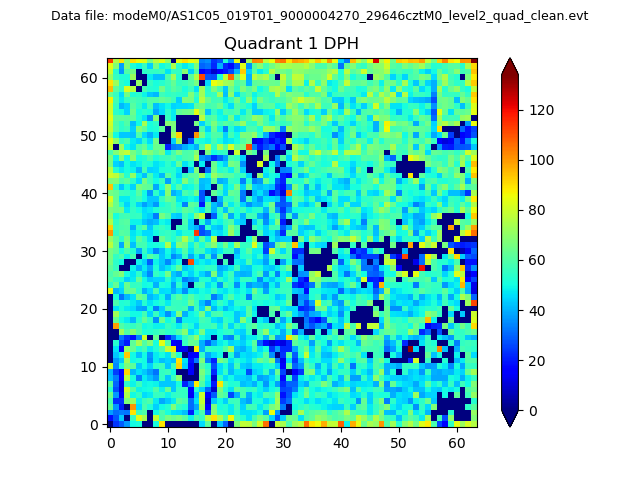 |
Quadrant B |
|---|---|---|---|
| Quadrant D | 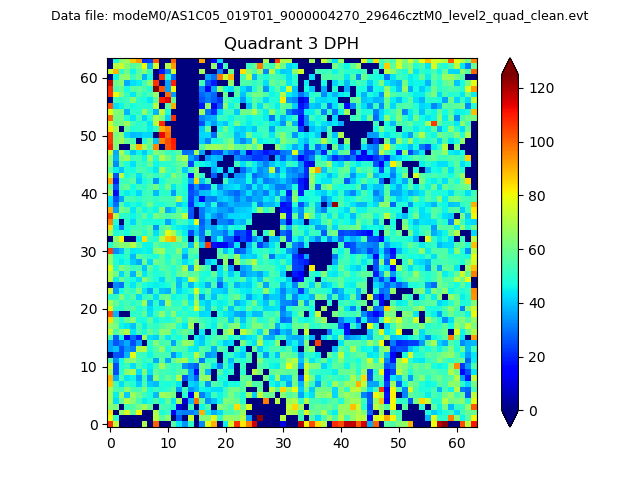 |
 |
Quadrant C |
| Plot type | Count rate plots | Images |
|---|---|---|
| Comparison with Poisson distribution Blue bars denote a histogram of data divided into 1 sec bins. Red curve is a Poisson curve with rate = median count rate of data. |
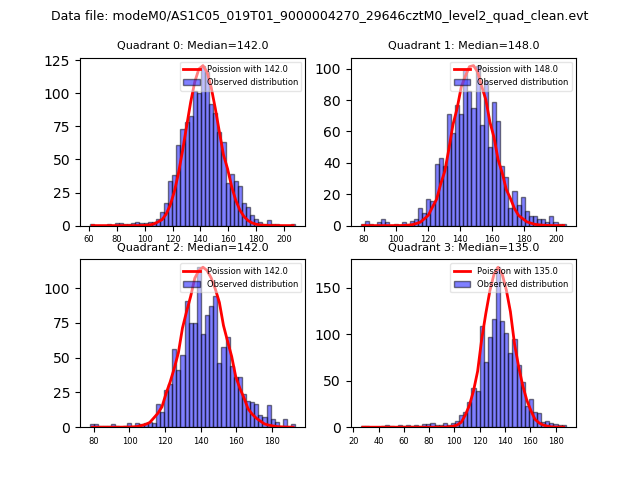 |
 |
| Quadrant-wise count rates Data is divided into 100 sec bins |
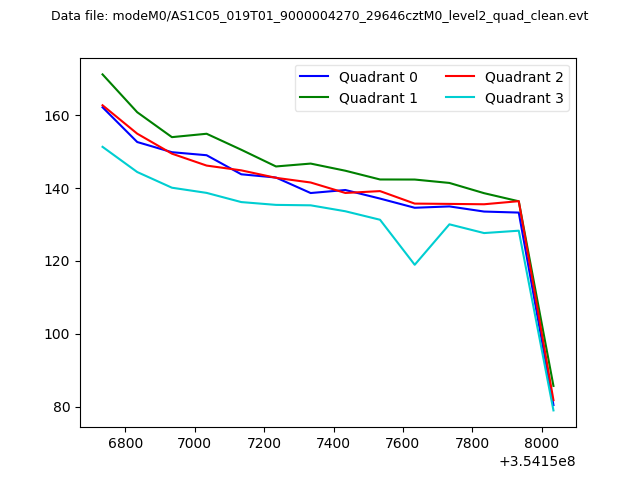 |
|
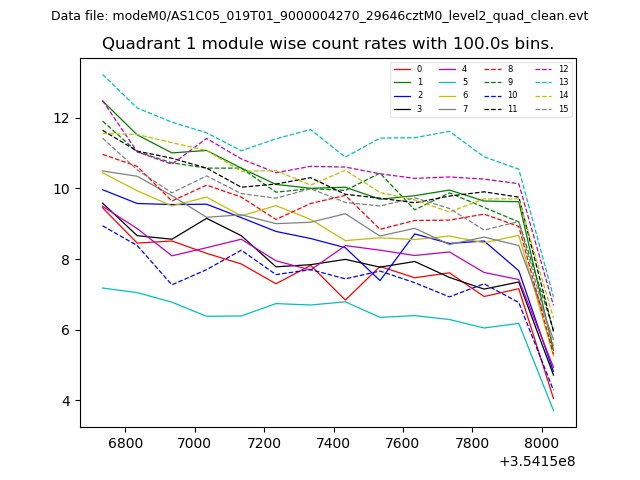
| Module-wise count rates for Quadrant A Data is divided into 100 sec bins |
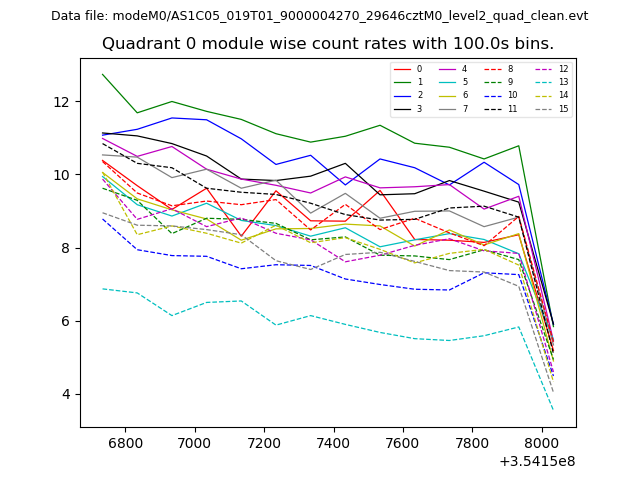 |
 |
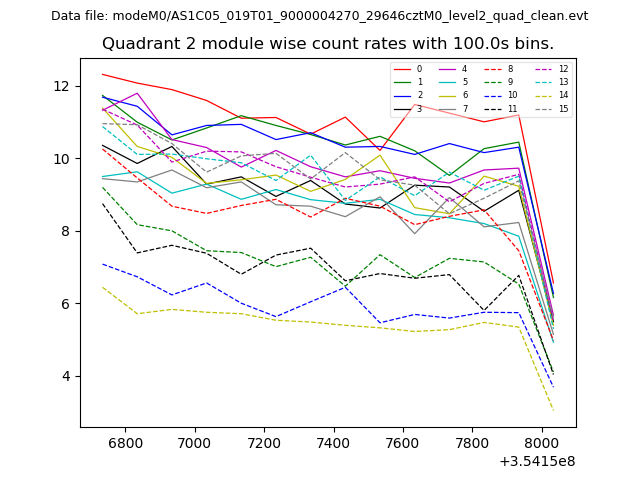
| Module-wise count rates for Quadrant B Data is divided into 100 sec bins |
 |
 |
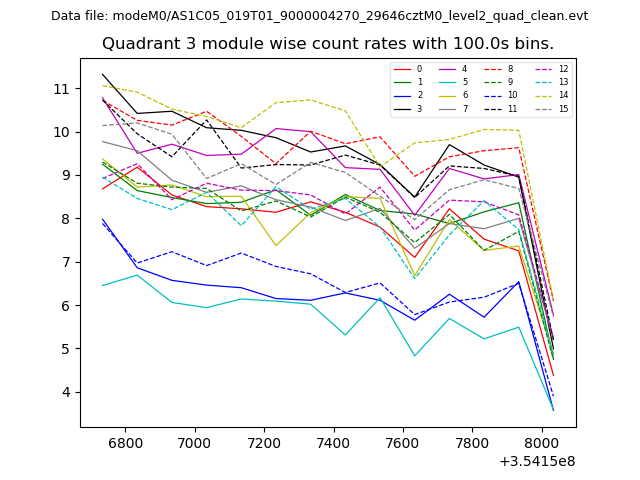
| Module-wise count rates for Quadrant C Data is divided into 100 sec bins |
 |
 |
| Module-wise count rates for Quadrant D Data is divided into 100 sec bins |
 |
 |
| Parameter | Plot |
|---|---|
| CZT HV Monitor | 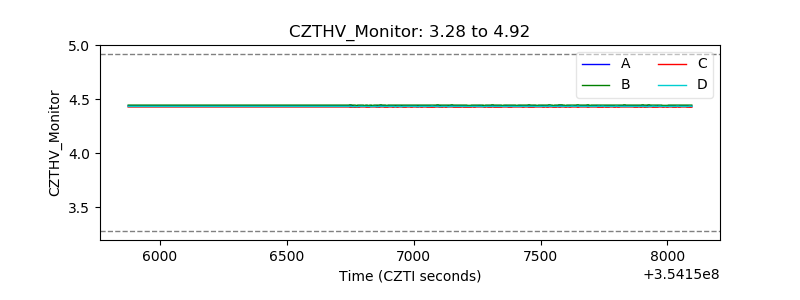 |
| D_VDD | 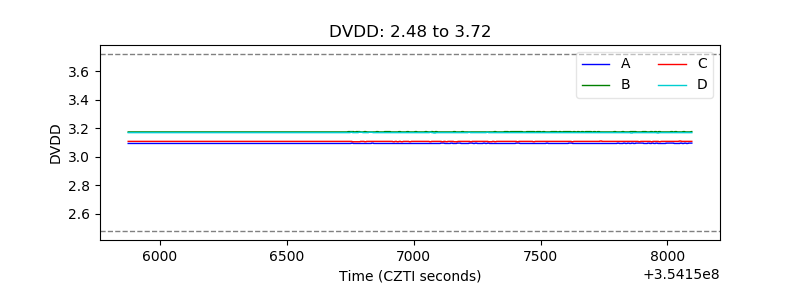 |
| Temperature 1 | 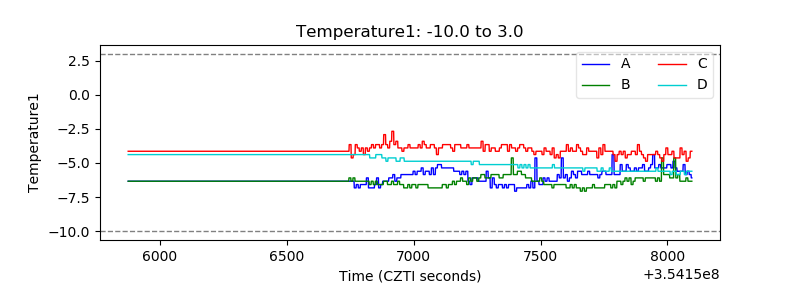 |
| Veto HV Monitor | 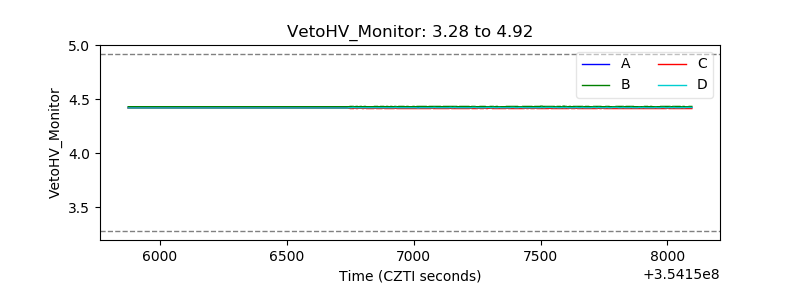 |
| Veto LLD | 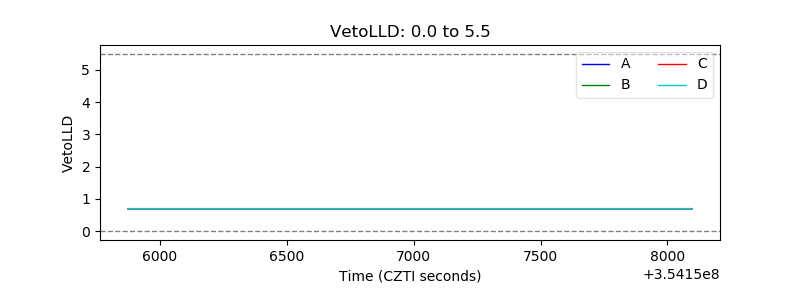 |
| Alpha Counter | 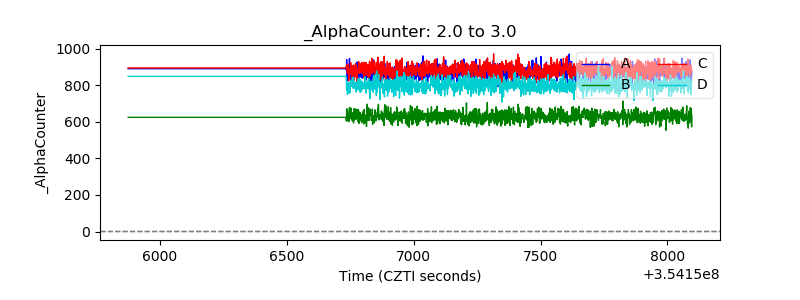 |
| _CPM_Rate | 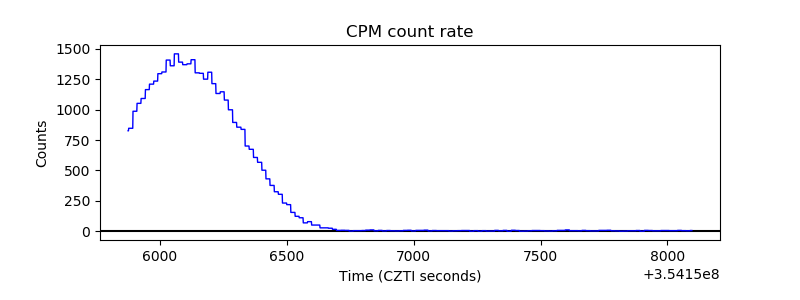 |
| CZT Counter | 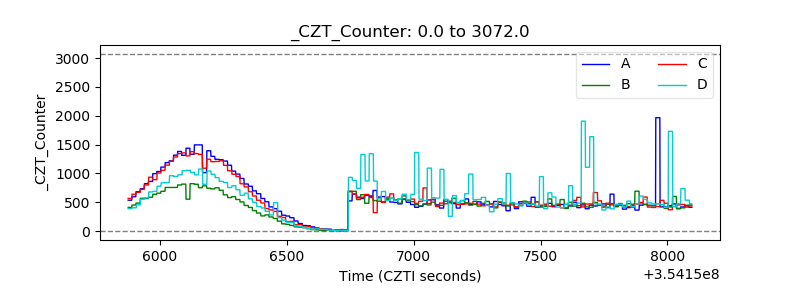 |
| +2.5 Volts monitor |  |
| +5 Volts monitor |  |
| _ROLL_ROT | 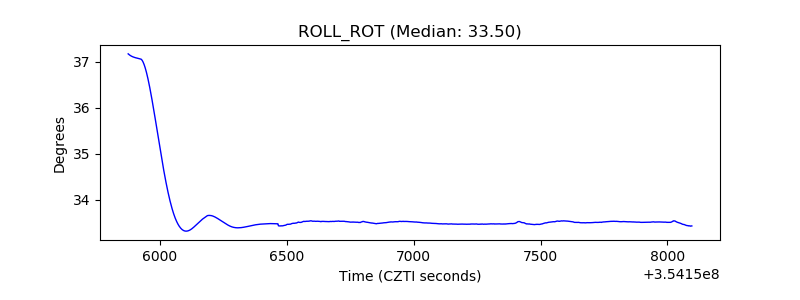 |
| _Roll_DEC | 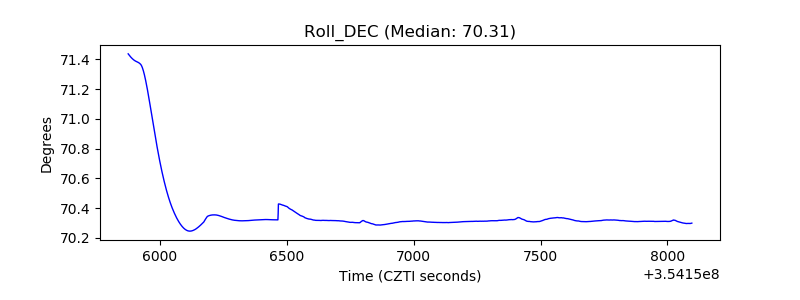 |
| _Roll_RA | 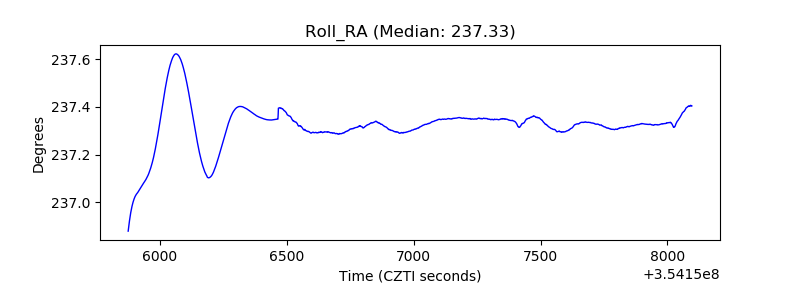 |
| Veto Counter | 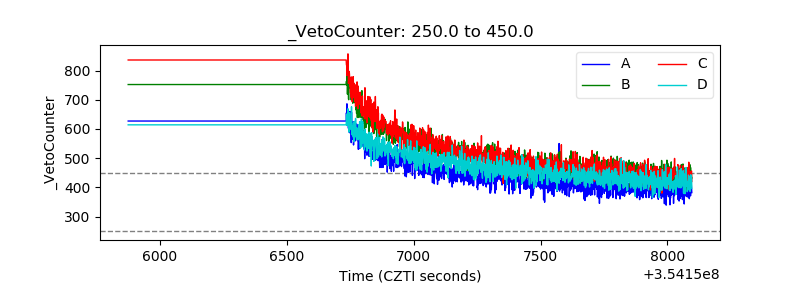 |