| Param | Original file | Final file |
|---|---|---|
| Filename | modeM0/AS1C05_019T01_9000004270_29647cztM0_level2.evt | modeM0/AS1C05_019T01_9000004270_29647cztM0_level2_quad_clean.evt |
| Size (bytes) | 460,157,760 | 112,815,360 |
| Size | 438.8 MB | 107.6 MB |
| Events in quadrant A | 3,098,274 | 735,613 |
| Events in quadrant B | 3,271,059 | 760,172 |
| Events in quadrant C | 3,234,763 | 739,909 |
| Events in quadrant D | 3,868,007 | 705,510 |
| Mode M9 | |||
|---|---|---|---|
| Quadrant | BADHDUFLAG | Total packets | Discarded packets |
| A | 0 | 15 | 0 |
| B | 0 | 16 | 0 |
| C | 0 | 16 | 0 |
| D | 0 | 16 | 0 |
| Mode SS | |||
|---|---|---|---|
| Quadrant | BADHDUFLAG | Total packets | Discarded packets |
| A | 0 | 138 | 0 |
| B | 0 | 138 | 0 |
| C | 0 | 138 | 0 |
| D | 0 | 138 | 0 |
| Mode M0 | |||
|---|---|---|---|
| Quadrant | BADHDUFLAG | Total packets | Discarded packets |
| A | 0 | 13920 | 2 |
| B | 0 | 14248 | 2 |
| C | 0 | 14115 | 2 |
| D | 0 | 16008 | 2 |
| Quadrant | Total seconds | Saturated seconds | Saturation percentage |
|---|---|---|---|
| A | 6828 | 11 | 0.161101% |
| B | 6828 | 44 | 0.644405% |
| C | 6828 | 67 | 0.981254% |
| D | 6828 | 71 | 1.039836% |
Noise dominated data is calculated using 1-second bins in cleaned event files. If a bin has >2000 counts, and if more than 50% of those come from <1% of pixels, then it is considered to be noise-dominated and hence unusable.
| Quadrant | # 1 sec bins | Bins with >0 counts | Bins with >2000 counts | High rate bins dominated by noise | Noise dominated (total time) | Noise dominated (detector-on time) | Marked lightcurve |
|---|---|---|---|---|---|---|---|
| A | 7823 | 6829 | 0 | 0 | 0.00% | 0.00% | 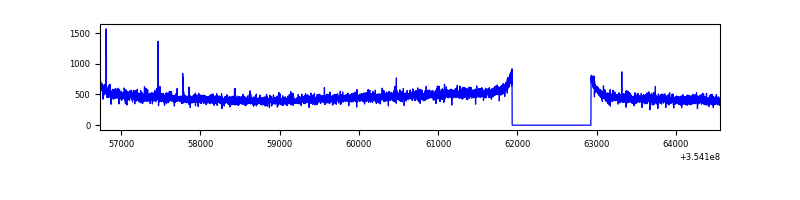 |
| B | 7823 | 6829 | 9 | 9 | 0.12% | 0.13% | 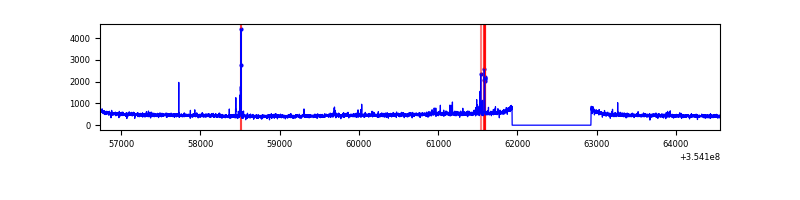 |
| C | 7823 | 6829 | 2 | 2 | 0.03% | 0.03% |  |
| D | 7823 | 6829 | 54 | 54 | 0.69% | 0.79% | 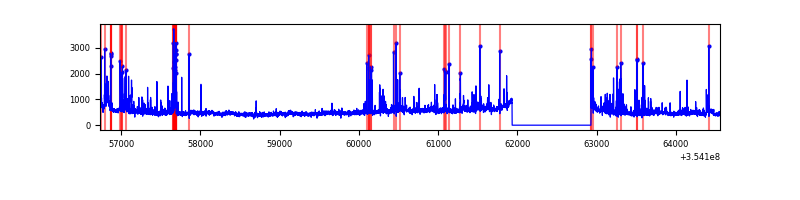 |
Top three noisy pixels from each quadrant. If the there are fewer than three noisy pixels in the level2.evt file, extra rows are filled as -1
| Pixel properties | Quadrant properties | ||||||
|---|---|---|---|---|---|---|---|
| Quadrant | DetID | PixID | Counts | Sigma | Mean | Median | Sigma |
| A | 13 | 254 | 13250 | 78.18 | 801 | 784 | 159.5 |
| A | 3 | 137 | 7689 | 43.3 | 801 | 784 | 159.5 |
| A | 0 | 226 | 6656 | 36.83 | 801 | 784 | 159.5 |
| B | 0 | 229 | 50888 | 329.33 | 810 | 788 | 152.1 |
| B | 15 | 33 | 27122 | 173.1 | 810 | 788 | 152.1 |
| B | 12 | 111 | 19015 | 119.81 | 810 | 788 | 152.1 |
| C | 14 | 238 | 128318 | 703.23 | 784 | 788 | 181.3 |
| C | 7 | 247 | 26452 | 141.52 | 784 | 788 | 181.3 |
| C | 2 | 114 | 15986 | 83.81 | 784 | 788 | 181.3 |
| D | 8 | 195 | 418408 | 2314.6 | 772 | 751 | 180.4 |
| D | 13 | 153 | 196631 | 1085.54 | 772 | 751 | 180.4 |
| D | 2 | 250 | 145709 | 803.34 | 772 | 751 | 180.4 |
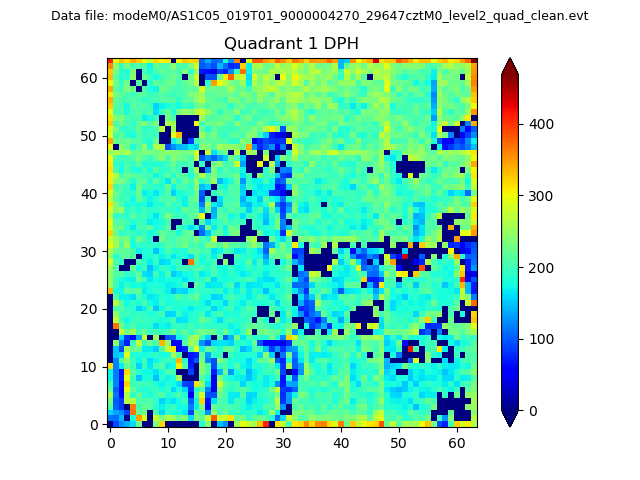
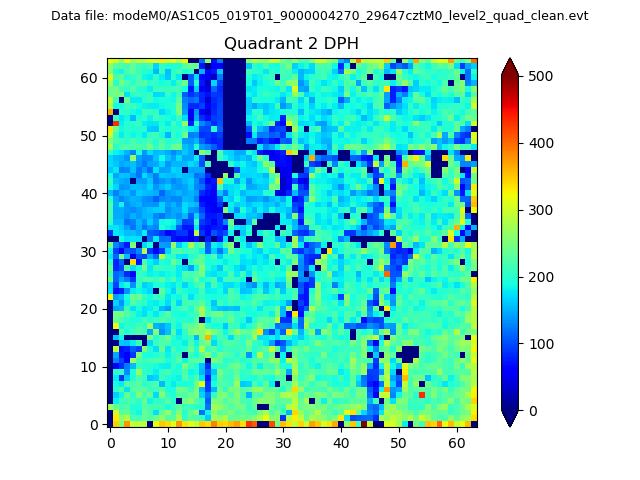
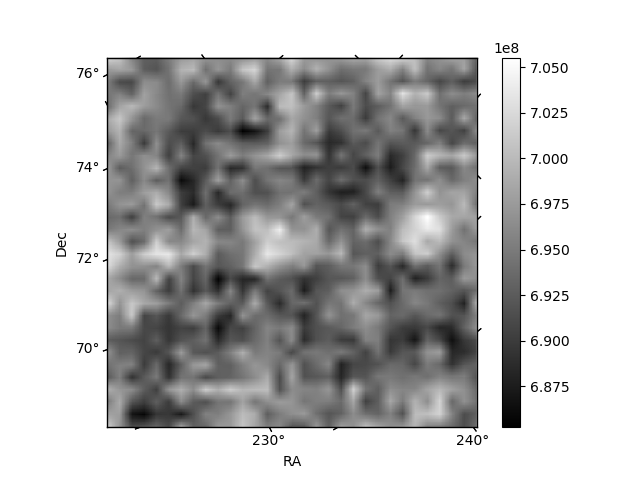
Histogram calculated using DETX and DETY for each event in the final _common_clean file
| Quadrant A | 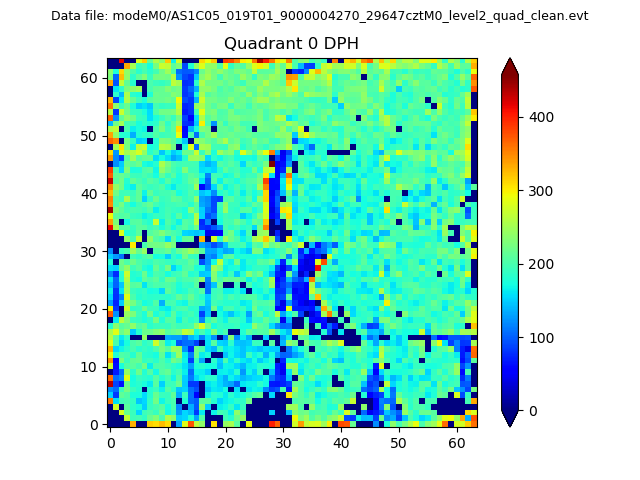 |
 |
Quadrant B |
|---|---|---|---|
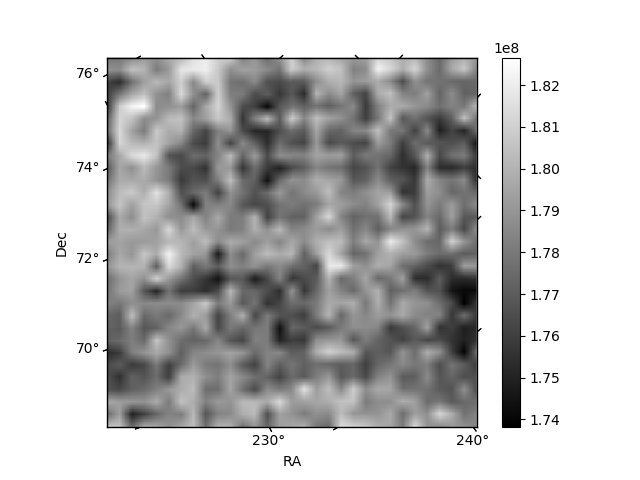
| Quadrant D | 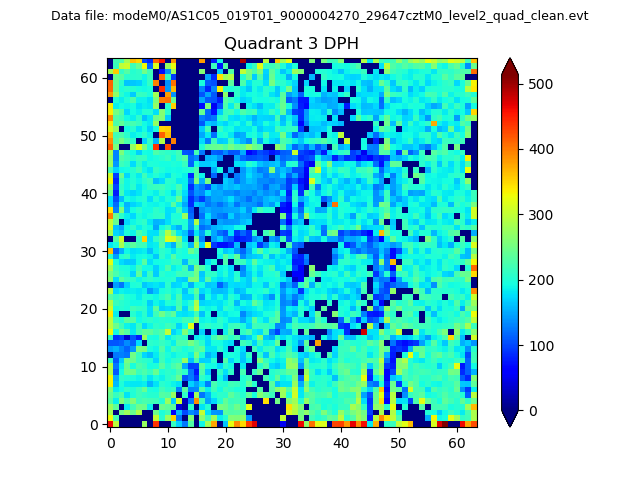 |
 |
Quadrant C |
| Plot type | Count rate plots | Images |
|---|---|---|
| Comparison with Poisson distribution Blue bars denote a histogram of data divided into 1 sec bins. Red curve is a Poisson curve with rate = median count rate of data. |
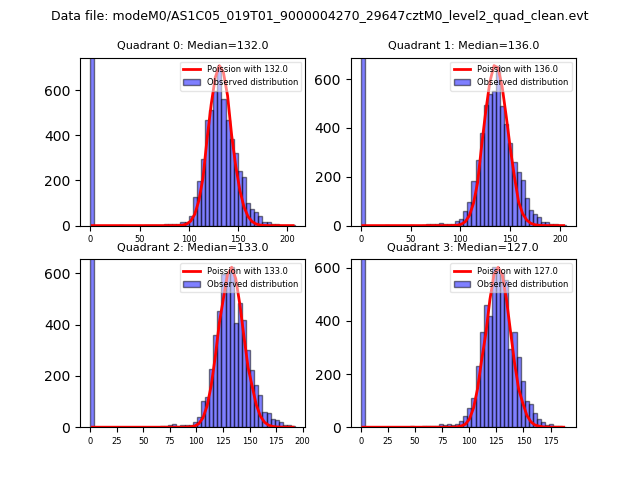 |
 |
| Quadrant-wise count rates Data is divided into 100 sec bins |
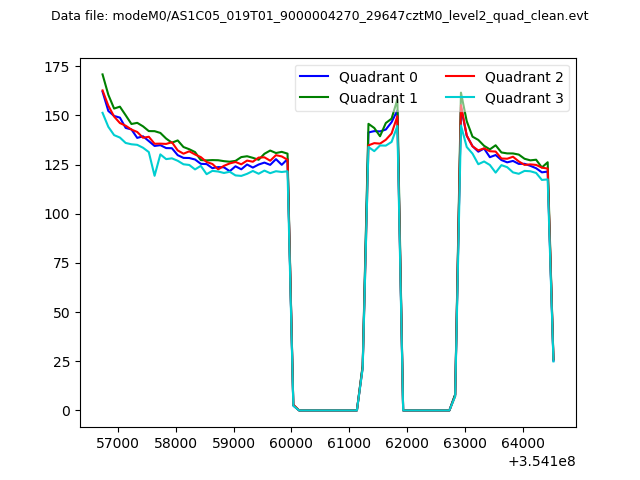 |
|
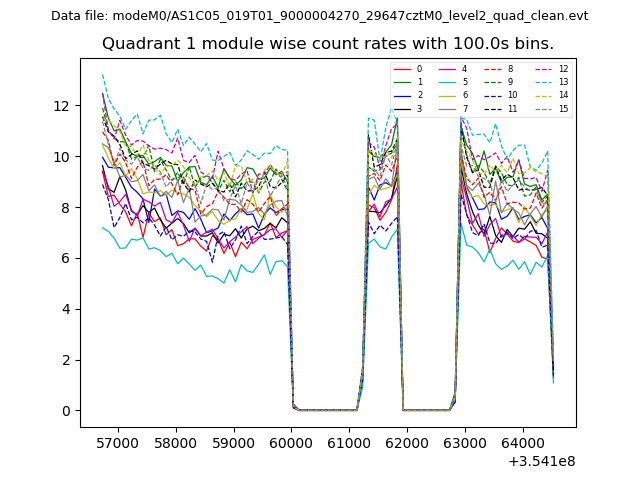
| Module-wise count rates for Quadrant A Data is divided into 100 sec bins |
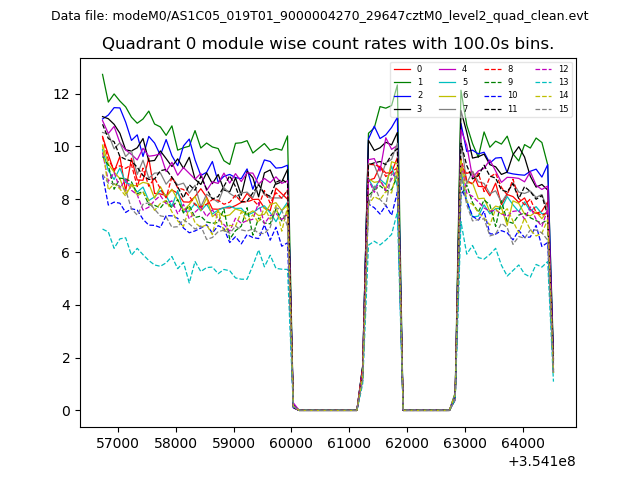 |
 |
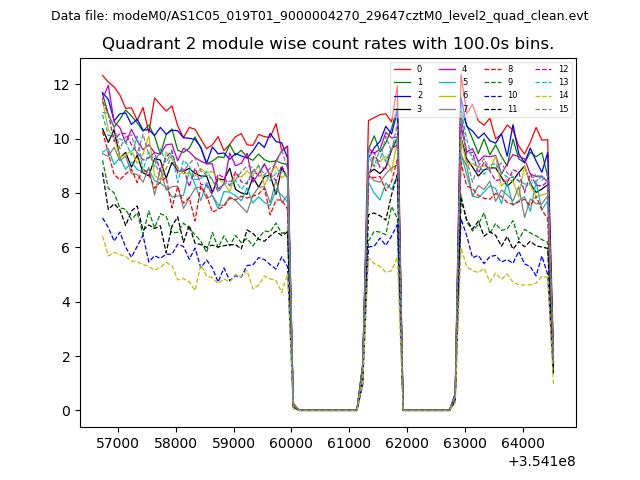
| Module-wise count rates for Quadrant B Data is divided into 100 sec bins |
 |
 |
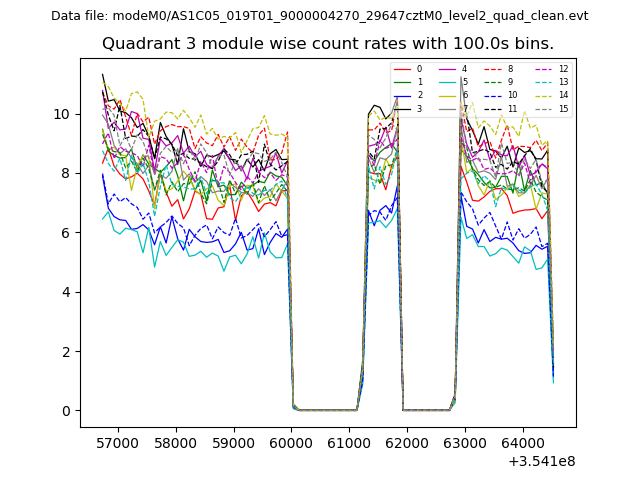
| Module-wise count rates for Quadrant C Data is divided into 100 sec bins |
 |
 |
| Module-wise count rates for Quadrant D Data is divided into 100 sec bins |
 |
 |
| Parameter | Plot |
|---|---|
| CZT HV Monitor | 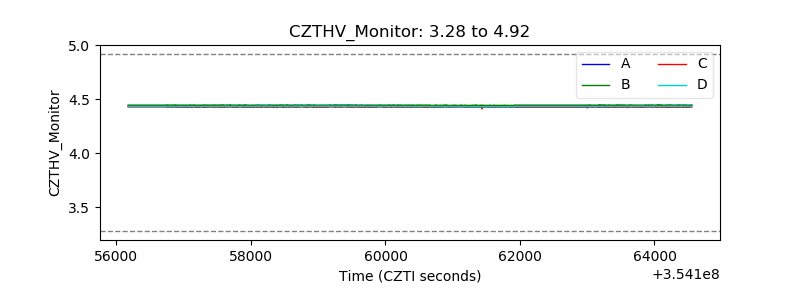 |
| D_VDD | 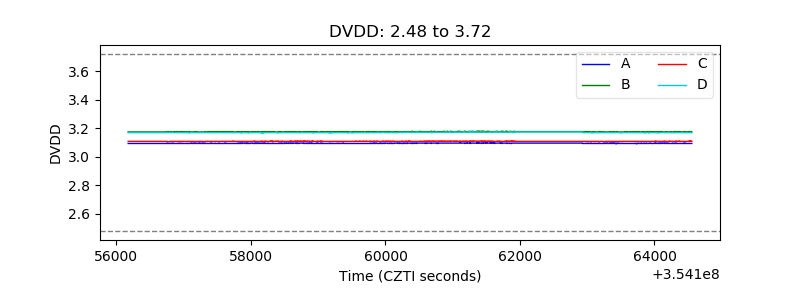 |
| Temperature 1 | 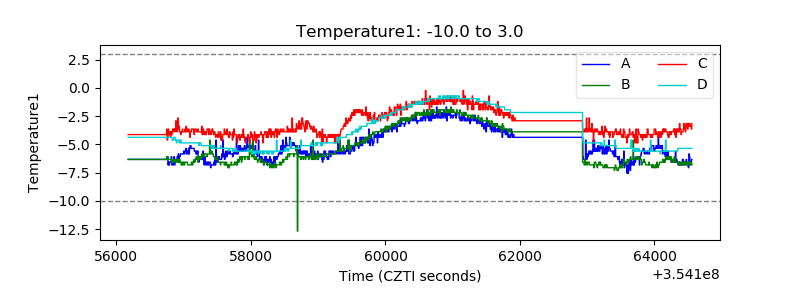 |
| Veto HV Monitor | 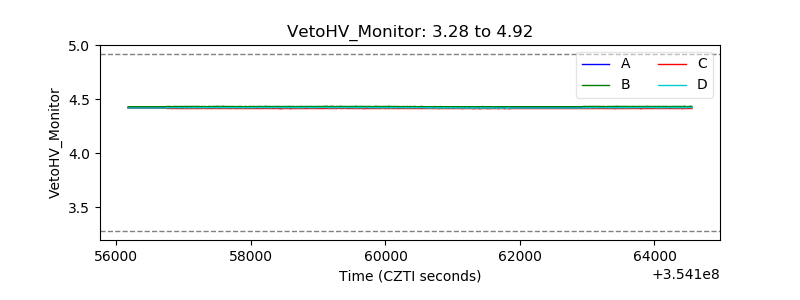 |
| Veto LLD | 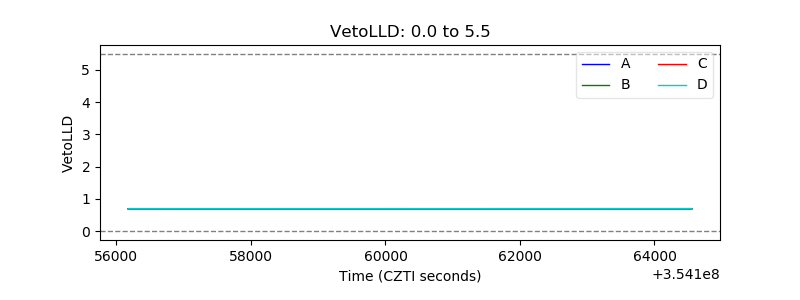 |
| Alpha Counter | 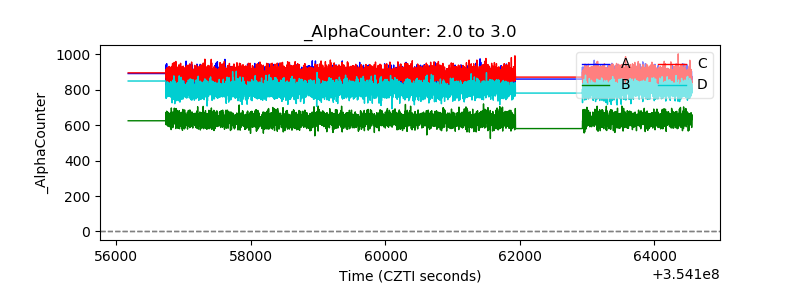 |
| _CPM_Rate | 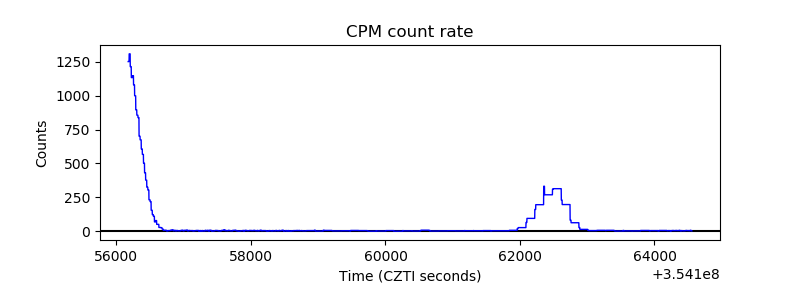 |
| CZT Counter | 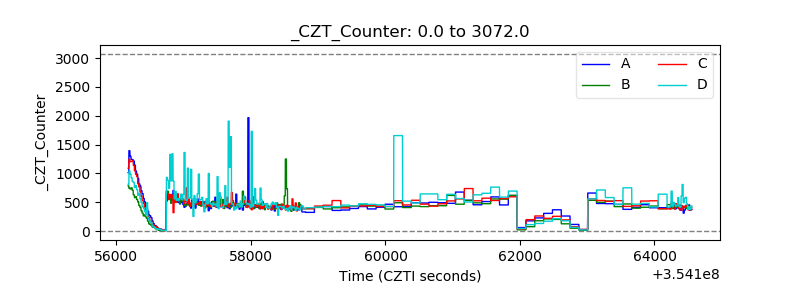 |
| +2.5 Volts monitor |  |
| +5 Volts monitor | 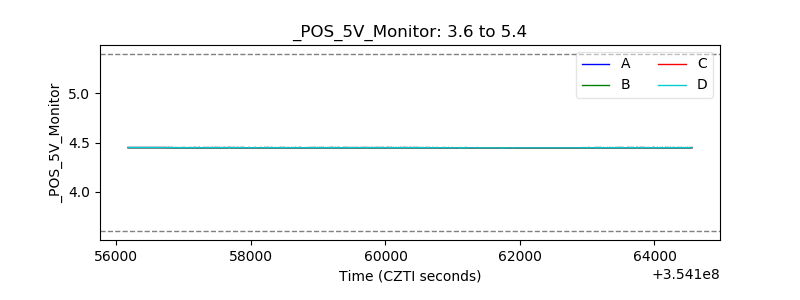 |
| _ROLL_ROT | 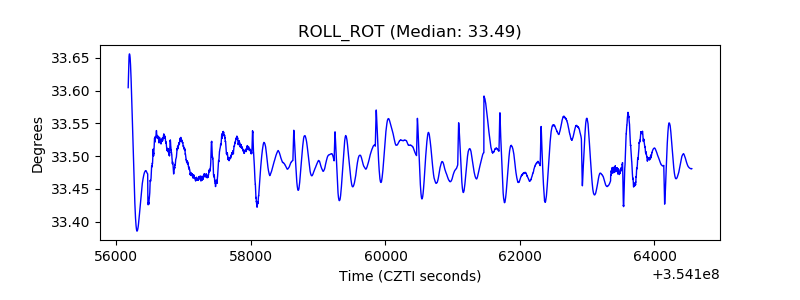 |
| _Roll_DEC | 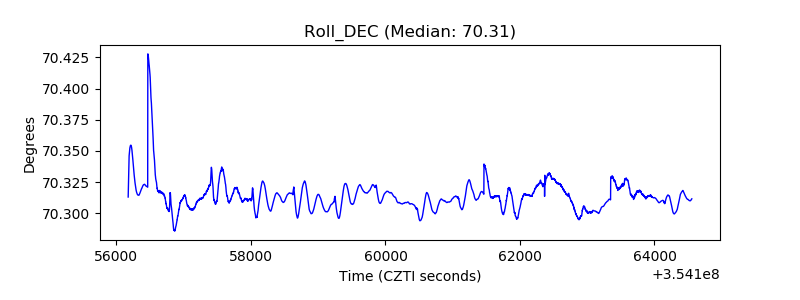 |
| _Roll_RA | 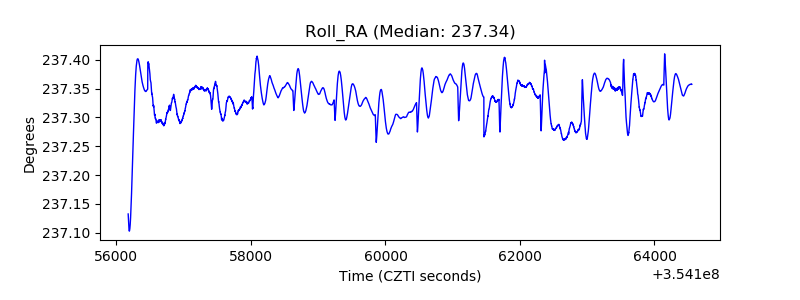 |
| Veto Counter | 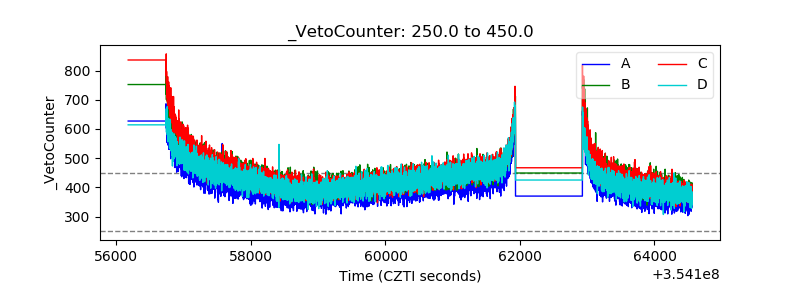 |