| Param | Original file | Final file |
|---|---|---|
| Filename | modeM0/AS1C05_019T01_9000004270_29648cztM0_level2.evt | modeM0/AS1C05_019T01_9000004270_29648cztM0_level2_quad_clean.evt |
| Size (bytes) | 525,507,840 | 115,669,440 |
| Size | 501.2 MB | 110.3 MB |
| Events in quadrant A | 3,248,363 | 754,118 |
| Events in quadrant B | 3,425,251 | 778,719 |
| Events in quadrant C | 3,669,141 | 754,729 |
| Events in quadrant D | 5,081,457 | 712,375 |
| Mode M9 | |||
|---|---|---|---|
| Quadrant | BADHDUFLAG | Total packets | Discarded packets |
| A | 0 | 6 | 0 |
| B | 0 | 6 | 0 |
| C | 0 | 6 | 0 |
| D | 0 | 6 | 0 |
| Mode SS | |||
|---|---|---|---|
| Quadrant | BADHDUFLAG | Total packets | Discarded packets |
| A | 0 | 146 | 0 |
| B | 0 | 146 | 0 |
| C | 0 | 146 | 0 |
| D | 0 | 146 | 0 |
| Mode M0 | |||
|---|---|---|---|
| Quadrant | BADHDUFLAG | Total packets | Discarded packets |
| A | 0 | 14716 | 1 |
| B | 0 | 15070 | 1 |
| C | 0 | 15671 | 1 |
| D | 0 | 20008 | 1 |
| Quadrant | Total seconds | Saturated seconds | Saturation percentage |
|---|---|---|---|
| A | 7230 | 38 | 0.525588% |
| B | 7230 | 86 | 1.189488% |
| C | 7231 | 156 | 2.157378% |
| D | 7231 | 293 | 4.051998% |
Noise dominated data is calculated using 1-second bins in cleaned event files. If a bin has >2000 counts, and if more than 50% of those come from <1% of pixels, then it is considered to be noise-dominated and hence unusable.
| Quadrant | # 1 sec bins | Bins with >0 counts | Bins with >2000 counts | High rate bins dominated by noise | Noise dominated (total time) | Noise dominated (detector-on time) | Marked lightcurve |
|---|---|---|---|---|---|---|---|
| A | 7785 | 7231 | 0 | 0 | 0.00% | 0.00% | 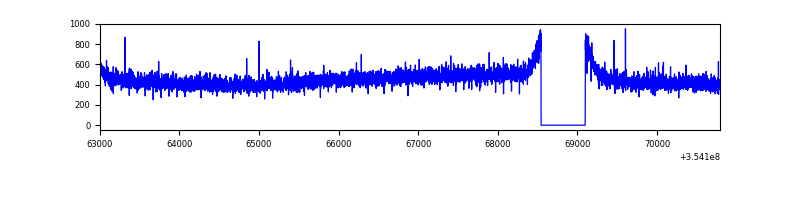 |
| B | 7785 | 7231 | 11 | 11 | 0.14% | 0.15% | 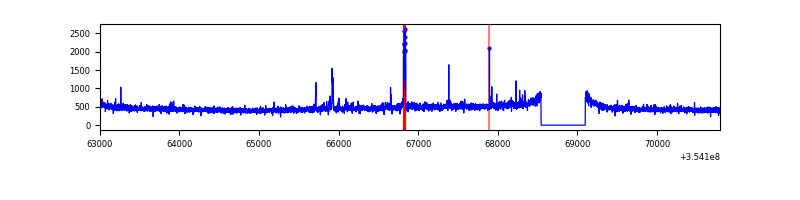 |
| C | 7786 | 7232 | 29 | 29 | 0.37% | 0.40% |  |
| D | 7786 | 7232 | 211 | 211 | 2.71% | 2.92% | 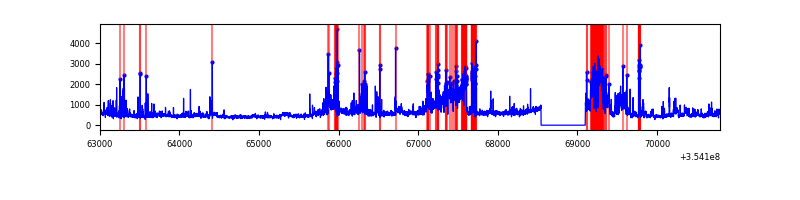 |
Top three noisy pixels from each quadrant. If the there are fewer than three noisy pixels in the level2.evt file, extra rows are filled as -1
| Pixel properties | Quadrant properties | ||||||
|---|---|---|---|---|---|---|---|
| Quadrant | DetID | PixID | Counts | Sigma | Mean | Median | Sigma |
| A | 13 | 254 | 14078 | 78.38 | 841 | 821 | 169.1 |
| A | 3 | 137 | 8261 | 43.99 | 841 | 821 | 169.1 |
| A | 0 | 226 | 7019 | 36.64 | 841 | 821 | 169.1 |
| B | 0 | 189 | 66681 | 414.46 | 842 | 821 | 158.9 |
| B | 0 | 190 | 21132 | 127.82 | 842 | 821 | 158.9 |
| B | 12 | 111 | 20144 | 121.6 | 842 | 821 | 158.9 |
| C | 3 | 233 | 214461 | 1132.44 | 813 | 816 | 188.7 |
| C | 14 | 238 | 132536 | 698.19 | 813 | 816 | 188.7 |
| C | 10 | 22 | 113673 | 598.2 | 813 | 816 | 188.7 |
| D | 7 | 80 | 882701 | 4688.74 | 799 | 776 | 188.1 |
| D | 8 | 195 | 569379 | 3022.97 | 799 | 776 | 188.1 |
| D | 7 | 238 | 172511 | 913.03 | 799 | 776 | 188.1 |
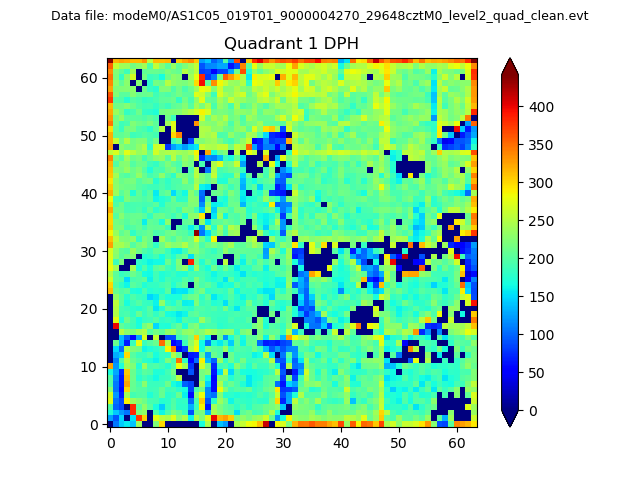
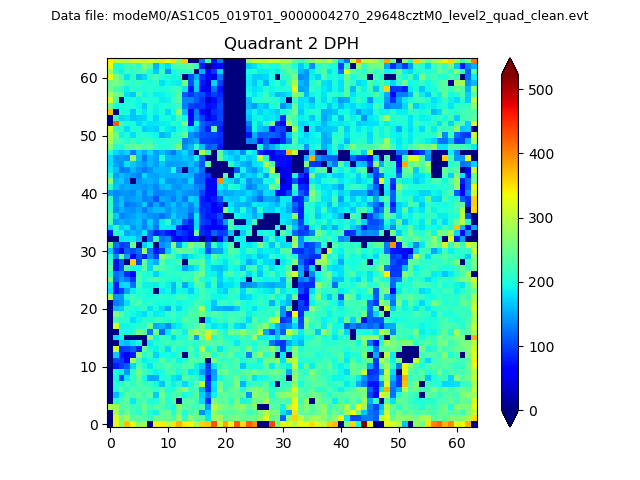
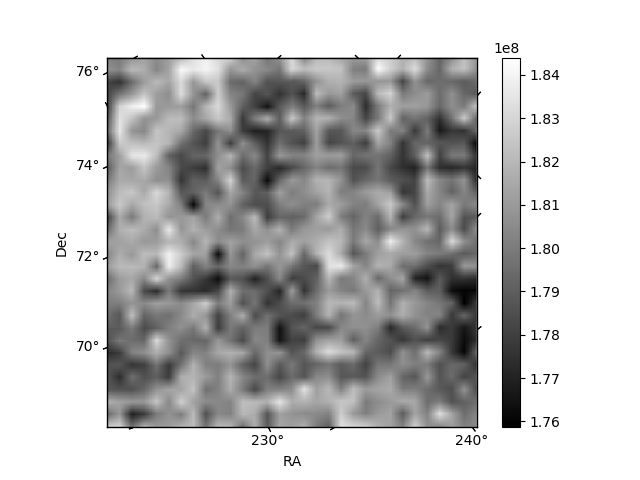
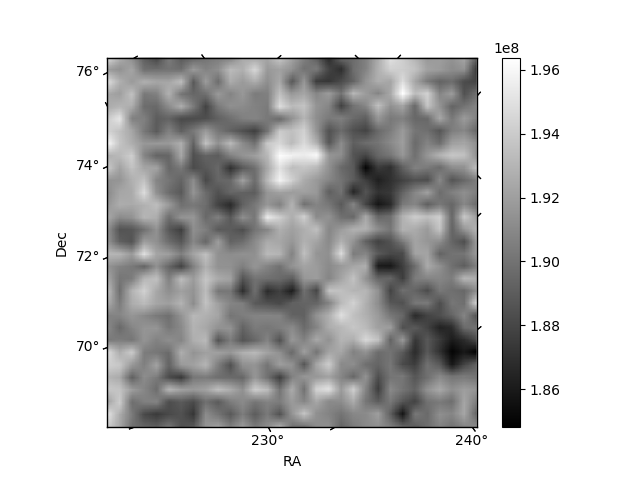
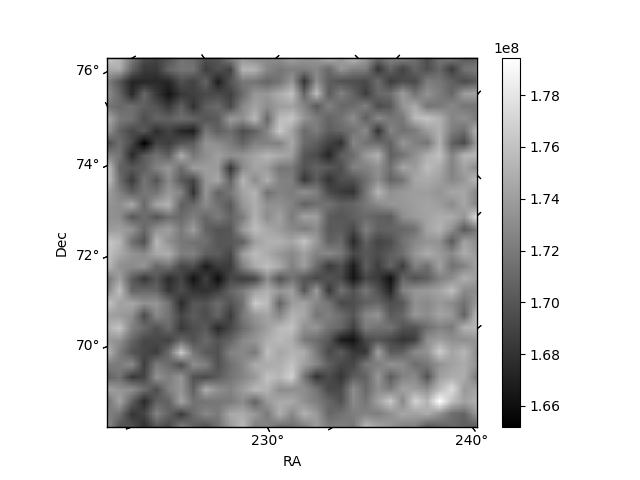
Histogram calculated using DETX and DETY for each event in the final _common_clean file
| Quadrant A | 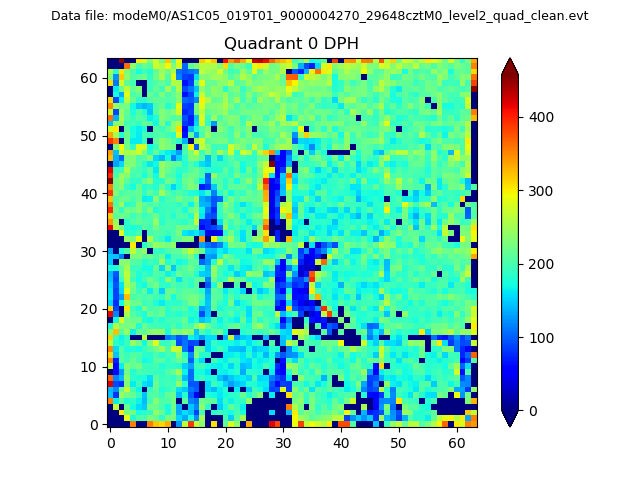 |
 |
Quadrant B |
|---|---|---|---|
| Quadrant D |  |
 |
Quadrant C |
| Plot type | Count rate plots | Images |
|---|---|---|
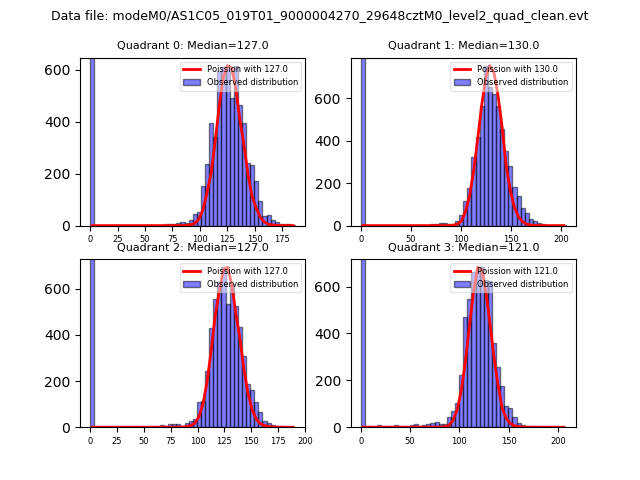
| Comparison with Poisson distribution Blue bars denote a histogram of data divided into 1 sec bins. Red curve is a Poisson curve with rate = median count rate of data. |
 |
 |
| Quadrant-wise count rates Data is divided into 100 sec bins |
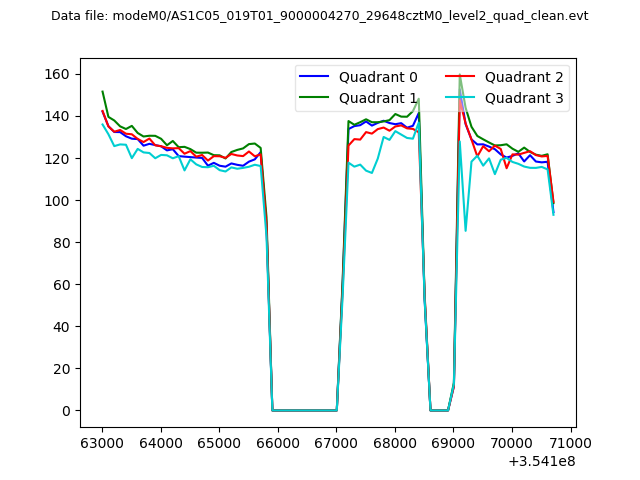 |
|
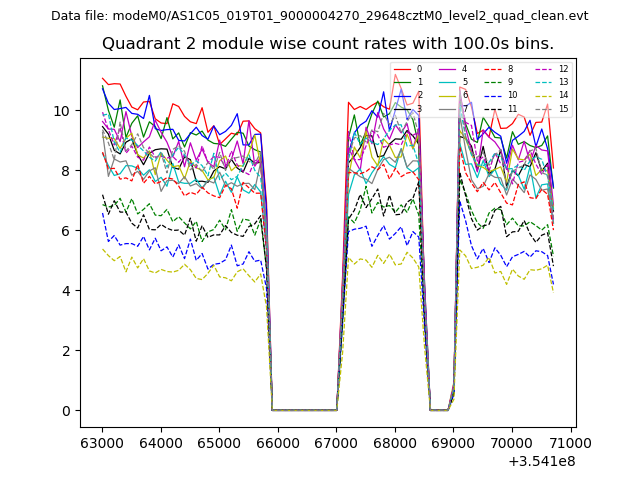
| Module-wise count rates for Quadrant A Data is divided into 100 sec bins |
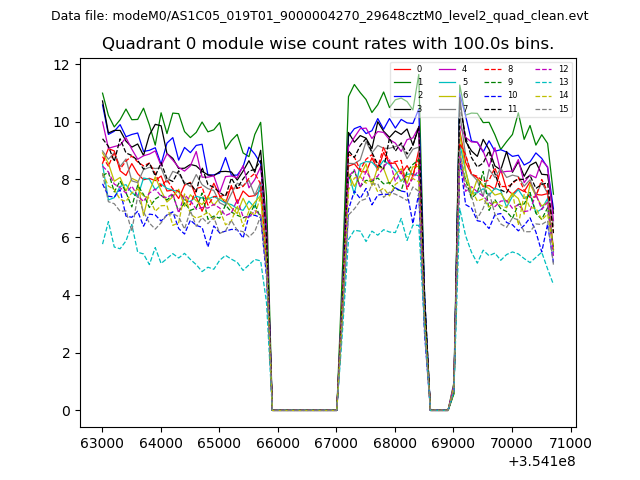 |
 |
| Module-wise count rates for Quadrant B Data is divided into 100 sec bins |
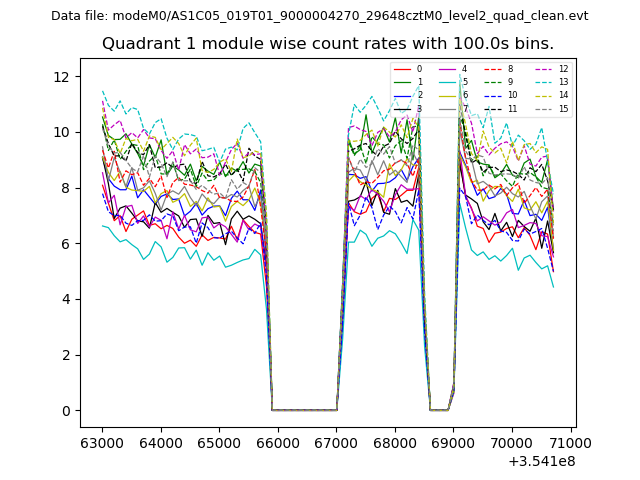 |
 |
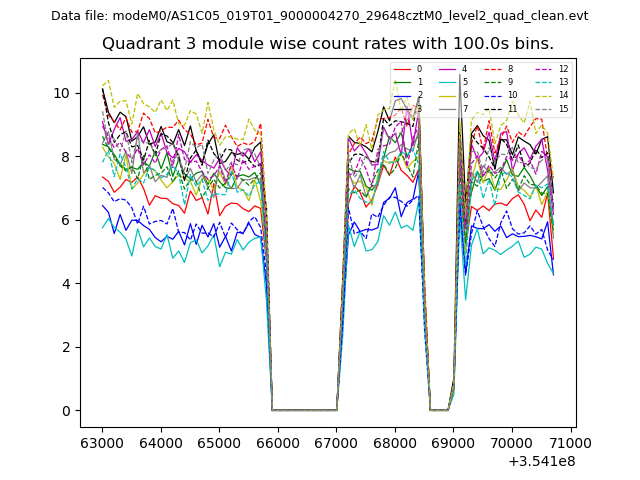
| Module-wise count rates for Quadrant C Data is divided into 100 sec bins |
 |
 |
| Module-wise count rates for Quadrant D Data is divided into 100 sec bins |
 |
 |
| Parameter | Plot |
|---|---|
| CZT HV Monitor | 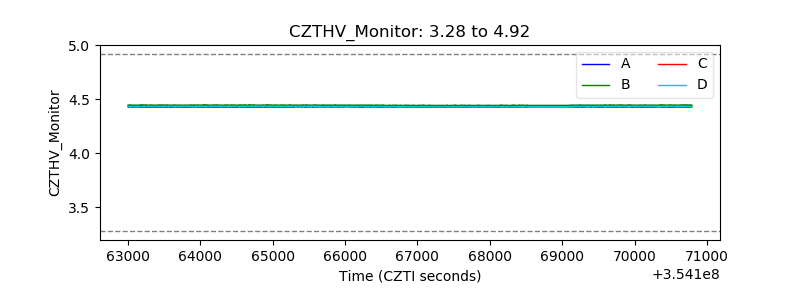 |
| D_VDD | 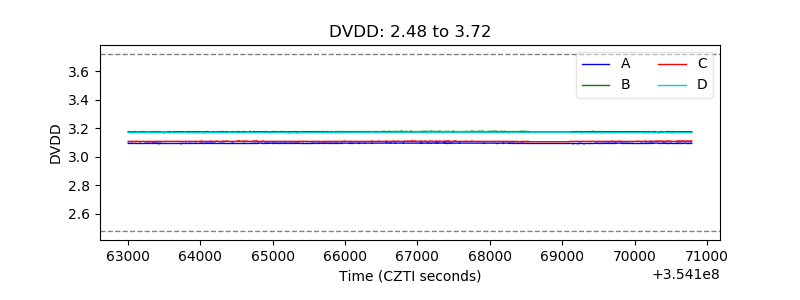 |
| Temperature 1 | 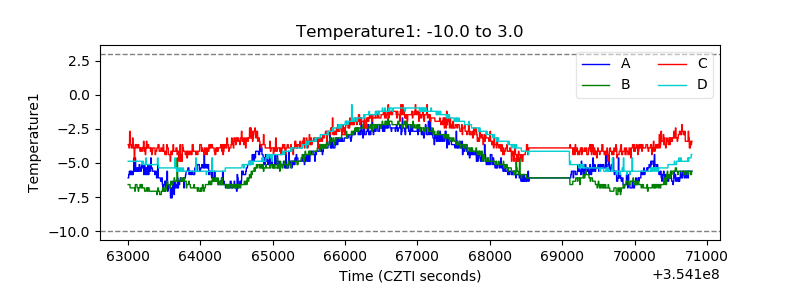 |
| Veto HV Monitor | 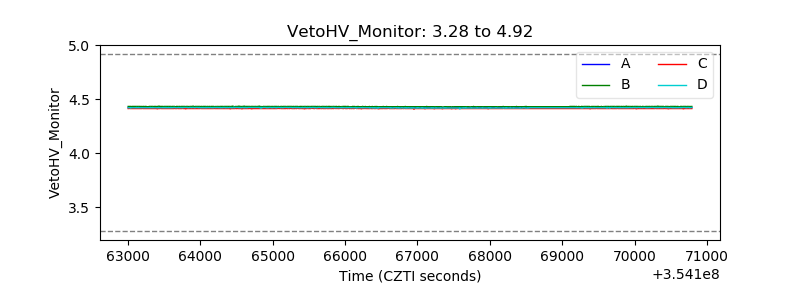 |
| Veto LLD | 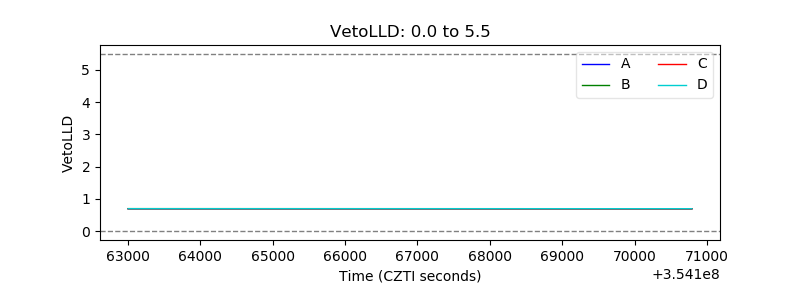 |
| Alpha Counter | 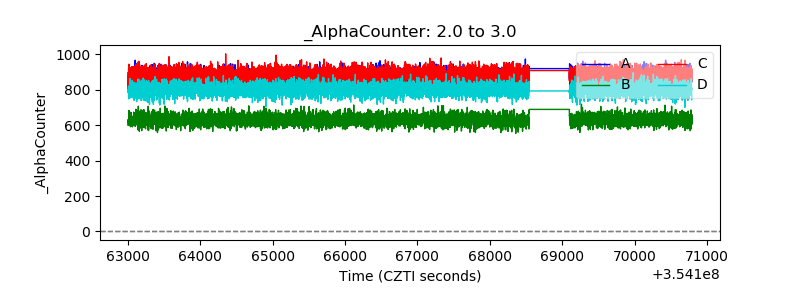 |
| _CPM_Rate | 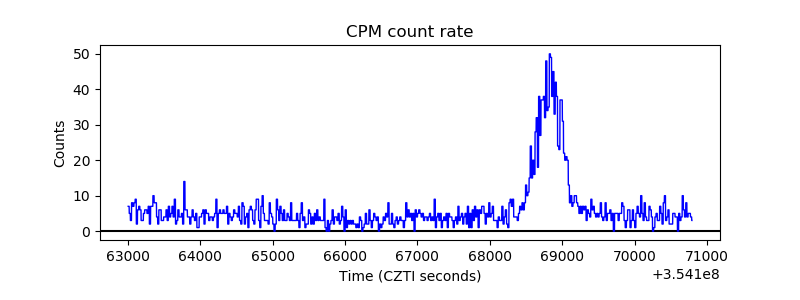 |
| CZT Counter | 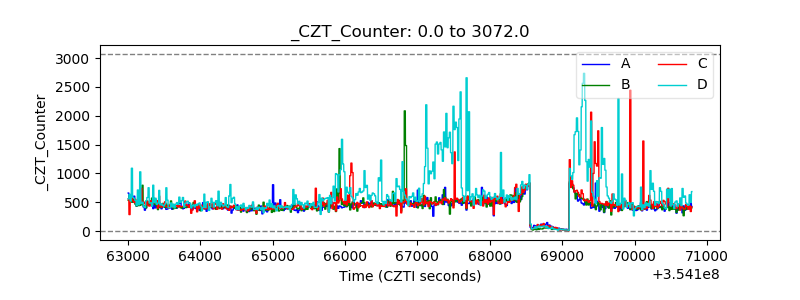 |
| +2.5 Volts monitor | 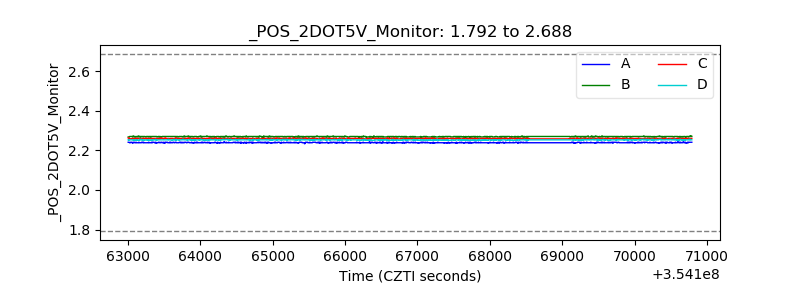 |
| +5 Volts monitor |  |
| _ROLL_ROT | 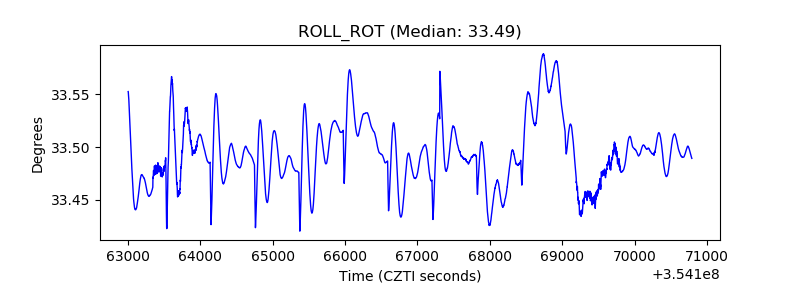 |
| _Roll_DEC | 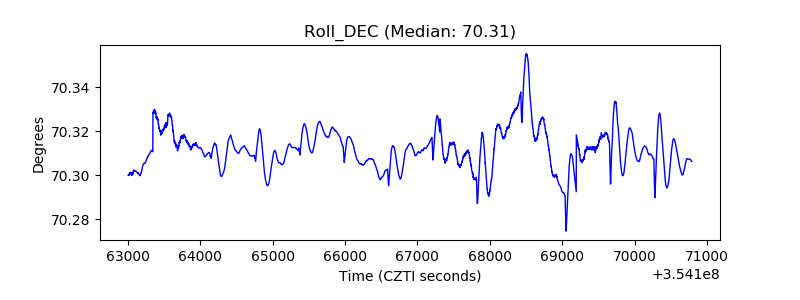 |
| _Roll_RA | 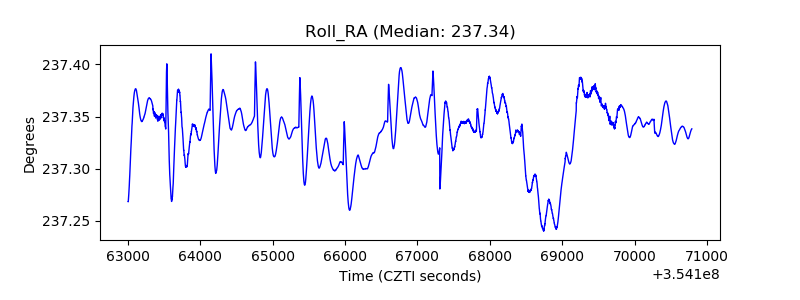 |
| Veto Counter | 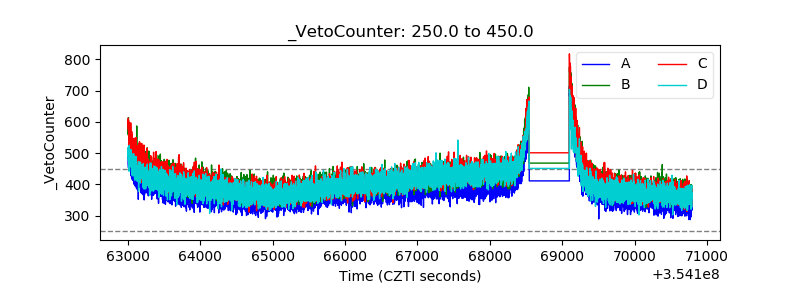 |