| Param | Original file | Final file |
|---|---|---|
| Filename | modeM0/AS1C05_019T01_9000004270_29649cztM0_level2.evt | modeM0/AS1C05_019T01_9000004270_29649cztM0_level2_quad_clean.evt |
| Size (bytes) | 554,538,240 | 112,795,200 |
| Size | 528.8 MB | 107.6 MB |
| Events in quadrant A | 3,229,042 | 730,442 |
| Events in quadrant B | 3,448,155 | 753,422 |
| Events in quadrant C | 3,573,536 | 734,082 |
| Events in quadrant D | 6,055,510 | 697,564 |
| Mode M9 | |||
|---|---|---|---|
| Quadrant | BADHDUFLAG | Total packets | Discarded packets |
| A | 0 | 1 | 0 |
| B | 0 | 1 | 0 |
| C | 0 | 1 | 0 |
| D | 0 | 1 | 0 |
| Mode SS | |||
|---|---|---|---|
| Quadrant | BADHDUFLAG | Total packets | Discarded packets |
| A | 0 | 148 | 0 |
| B | 0 | 148 | 0 |
| C | 0 | 148 | 0 |
| D | 0 | 148 | 0 |
| Mode M0 | |||
|---|---|---|---|
| Quadrant | BADHDUFLAG | Total packets | Discarded packets |
| A | 0 | 14667 | 4 |
| B | 0 | 15182 | 2 |
| C | 0 | 15331 | 2 |
| D | 0 | 22935 | 2 |
| Quadrant | Total seconds | Saturated seconds | Saturation percentage |
|---|---|---|---|
| A | 7180 | 100 | 1.392758% |
| B | 7181 | 145 | 2.019217% |
| C | 7181 | 147 | 2.047069% |
| D | 7181 | 671 | 9.344102% |
Noise dominated data is calculated using 1-second bins in cleaned event files. If a bin has >2000 counts, and if more than 50% of those come from <1% of pixels, then it is considered to be noise-dominated and hence unusable.
| Quadrant | # 1 sec bins | Bins with >0 counts | Bins with >2000 counts | High rate bins dominated by noise | Noise dominated (total time) | Noise dominated (detector-on time) | Marked lightcurve |
|---|---|---|---|---|---|---|---|
| A | 7355 | 7183 | 0 | 0 | 0.00% | 0.00% | 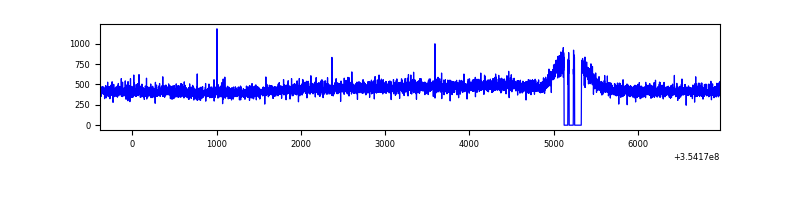 |
| B | 7356 | 7183 | 14 | 14 | 0.19% | 0.19% | 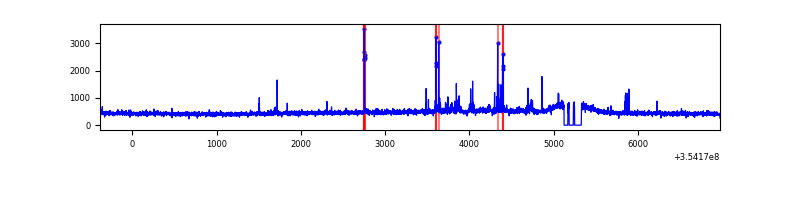 |
| C | 7356 | 7184 | 20 | 20 | 0.27% | 0.28% | 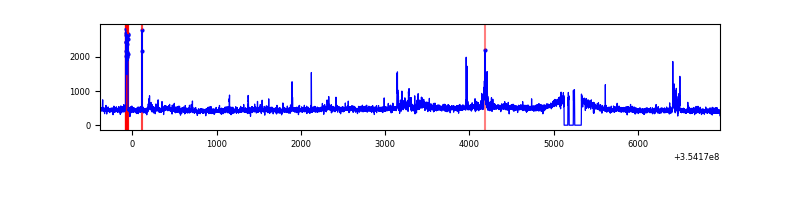 |
| D | 7356 | 7184 | 543 | 543 | 7.38% | 7.56% | 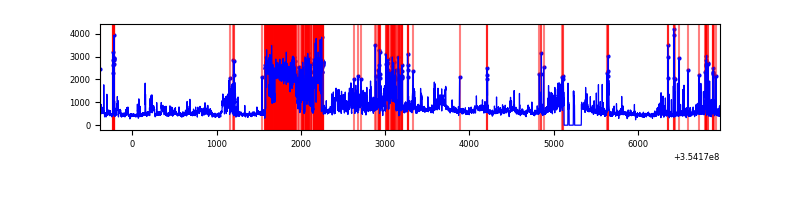 |
Top three noisy pixels from each quadrant. If the there are fewer than three noisy pixels in the level2.evt file, extra rows are filled as -1
| Pixel properties | Quadrant properties | ||||||
|---|---|---|---|---|---|---|---|
| Quadrant | DetID | PixID | Counts | Sigma | Mean | Median | Sigma |
| A | 13 | 254 | 13068 | 72.85 | 834 | 816 | 168.2 |
| A | 3 | 137 | 8535 | 45.9 | 834 | 816 | 168.2 |
| A | 0 | 13 | 8028 | 42.88 | 834 | 816 | 168.2 |
| B | 10 | 245 | 128954 | 797.89 | 834 | 812 | 160.6 |
| B | 12 | 111 | 20617 | 123.32 | 834 | 812 | 160.6 |
| B | 11 | 111 | 18147 | 107.94 | 834 | 812 | 160.6 |
| C | 3 | 233 | 197586 | 1046.14 | 806 | 810 | 188.1 |
| C | 14 | 238 | 129484 | 684.08 | 806 | 810 | 188.1 |
| C | 7 | 247 | 60750 | 318.66 | 806 | 810 | 188.1 |
| D | 7 | 80 | 1241762 | 6659.8 | 781 | 760 | 186.3 |
| D | 7 | 238 | 971803 | 5211.07 | 781 | 760 | 186.3 |
| D | 8 | 195 | 630504 | 3379.5 | 781 | 760 | 186.3 |
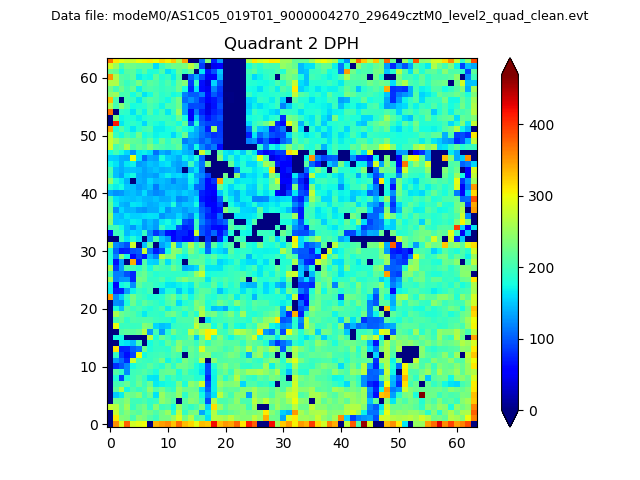
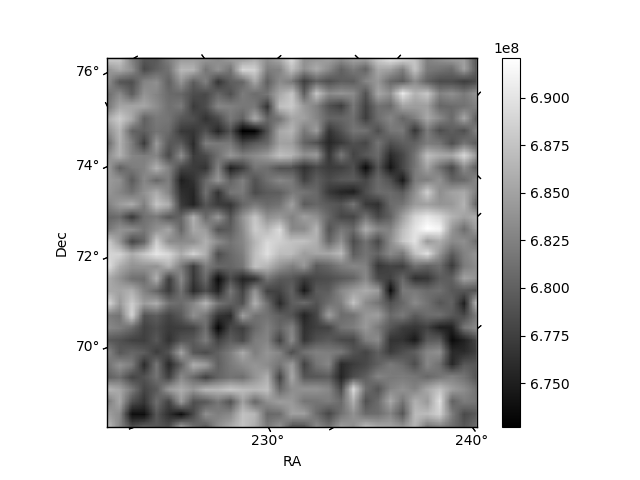
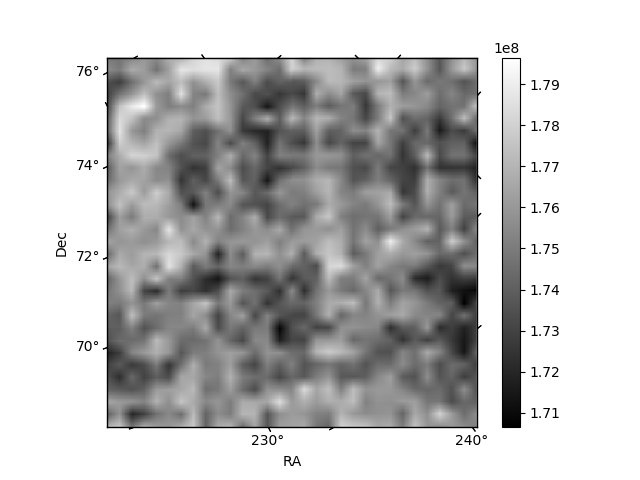
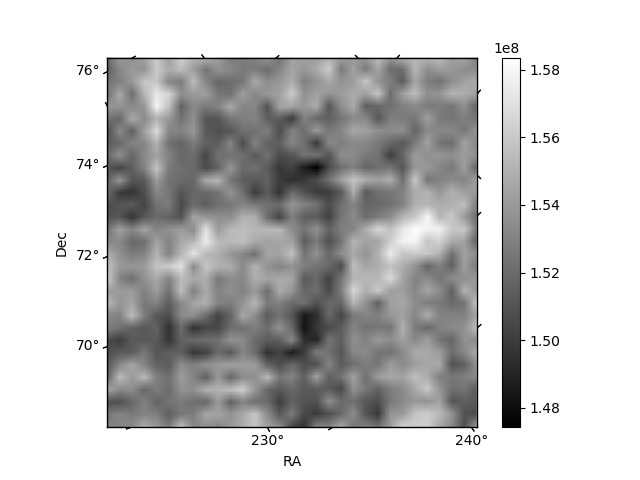
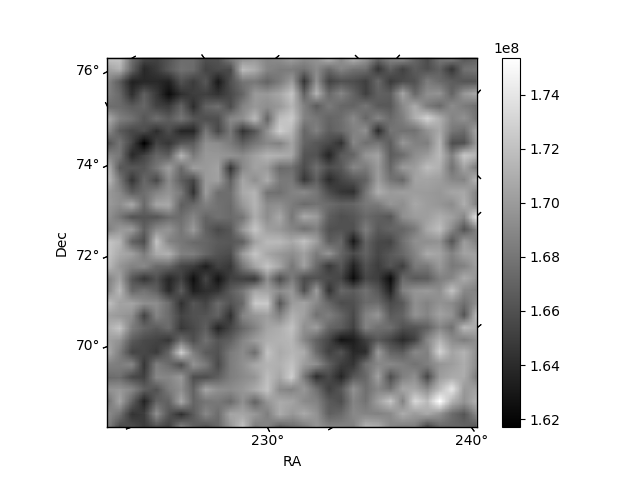
Histogram calculated using DETX and DETY for each event in the final _common_clean file
| Quadrant A | 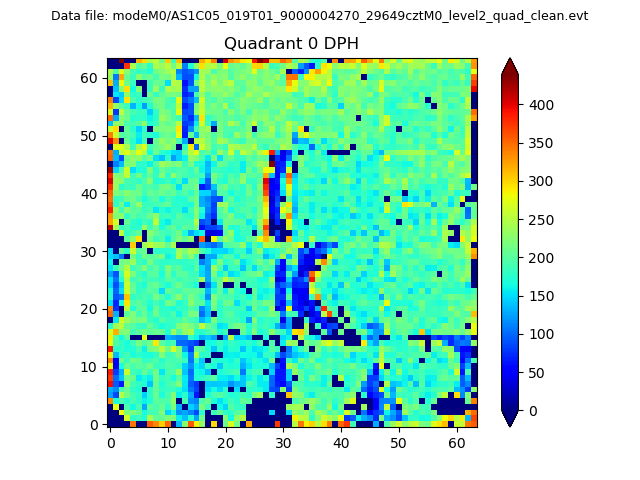 |
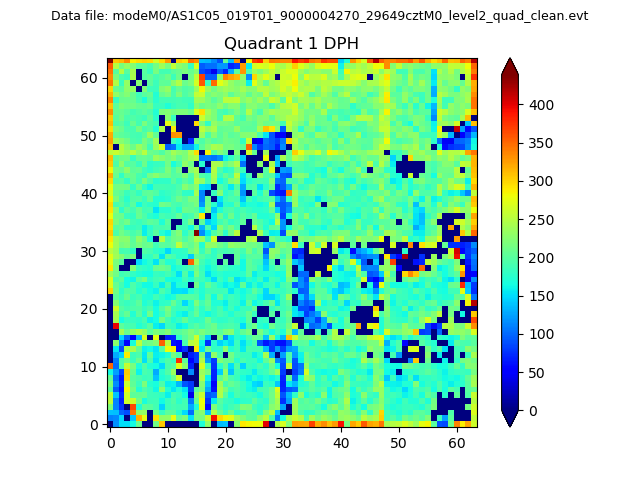 |
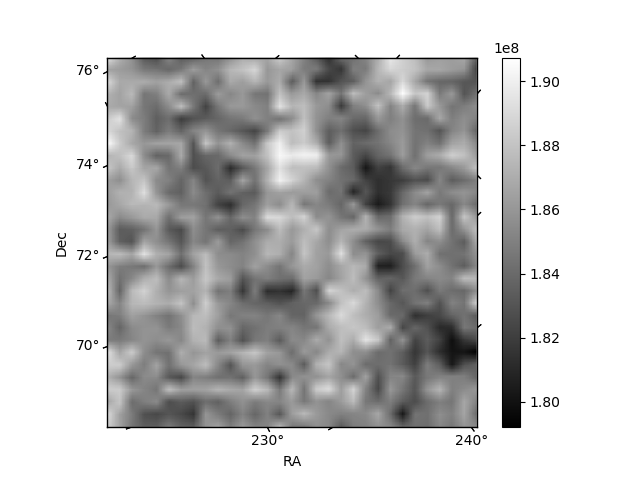
Quadrant B |
|---|---|---|---|
| Quadrant D | 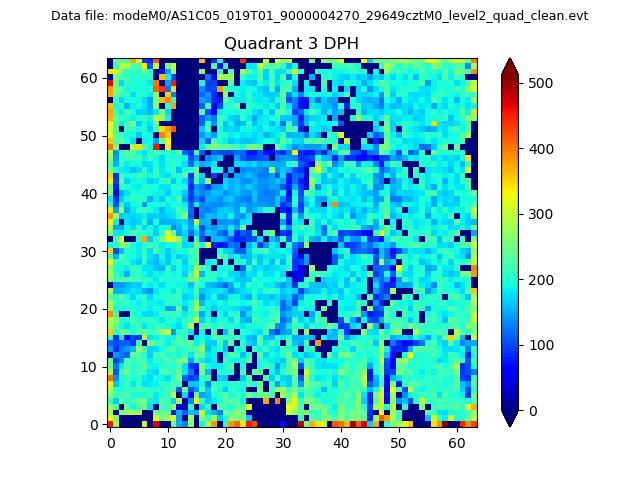 |
 |
Quadrant C |
| Plot type | Count rate plots | Images |
|---|---|---|
| Comparison with Poisson distribution Blue bars denote a histogram of data divided into 1 sec bins. Red curve is a Poisson curve with rate = median count rate of data. |
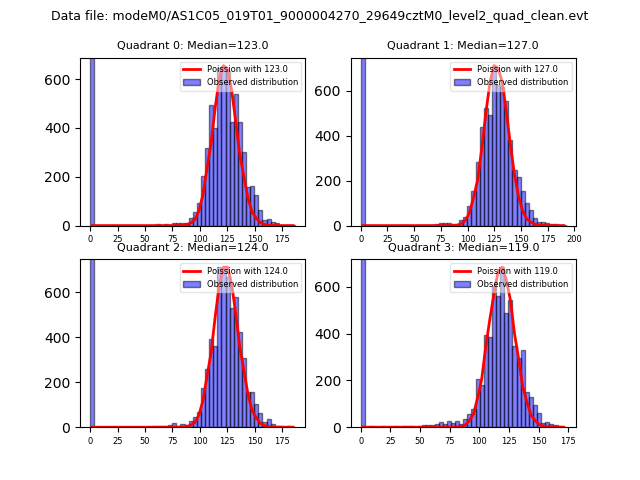 |
 |
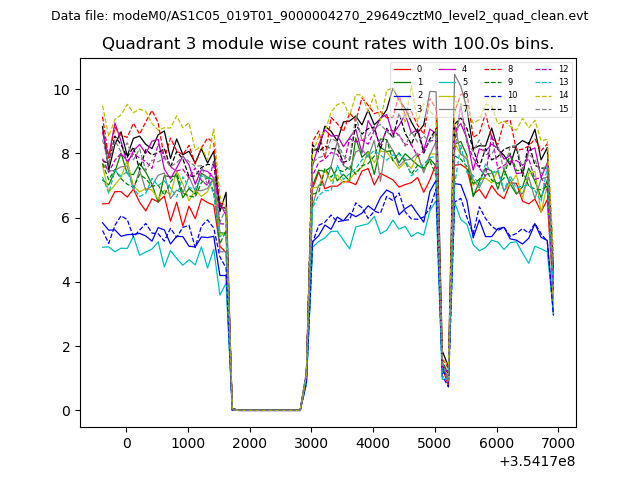
| Quadrant-wise count rates Data is divided into 100 sec bins |
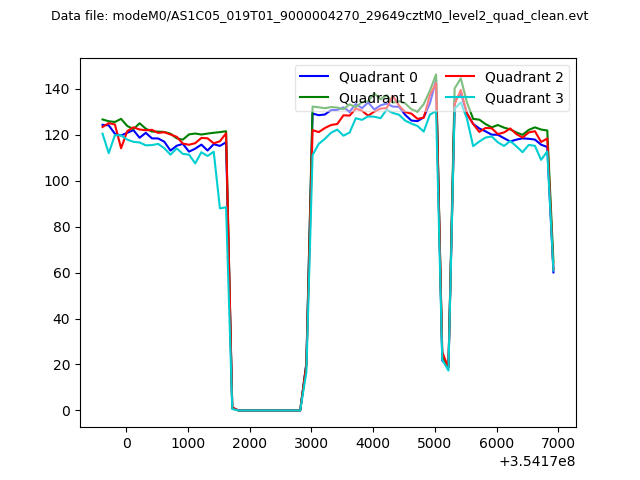 |
|
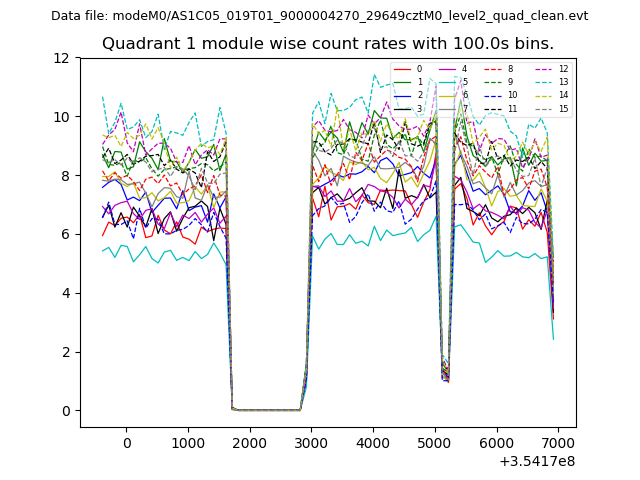
| Module-wise count rates for Quadrant A Data is divided into 100 sec bins |
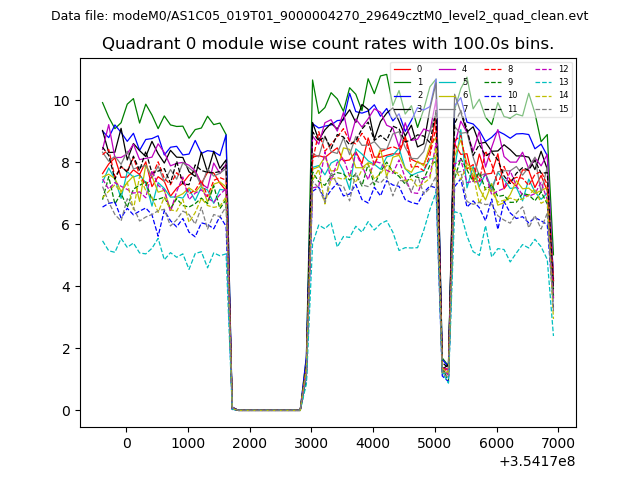 |
 |
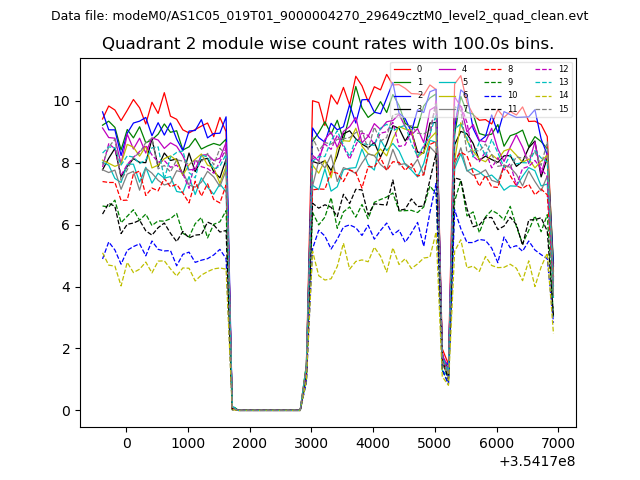
| Module-wise count rates for Quadrant B Data is divided into 100 sec bins |
 |
 |
| Module-wise count rates for Quadrant C Data is divided into 100 sec bins |
 |
 |
| Module-wise count rates for Quadrant D Data is divided into 100 sec bins |
 |
 |
| Parameter | Plot |
|---|---|
| CZT HV Monitor | 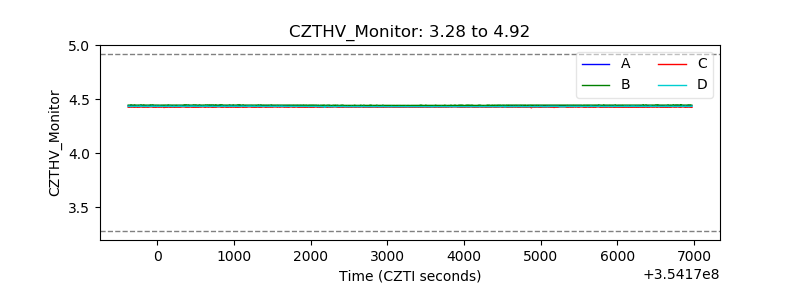 |
| D_VDD | 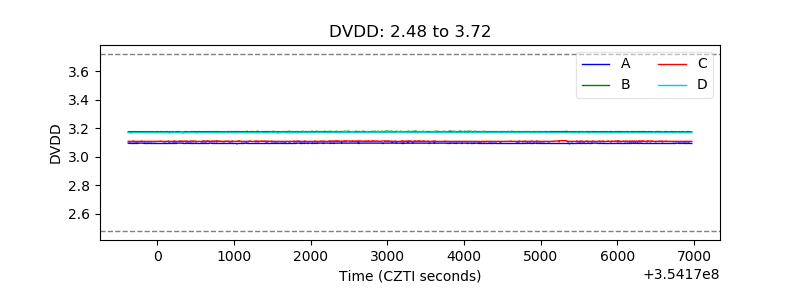 |
| Temperature 1 | 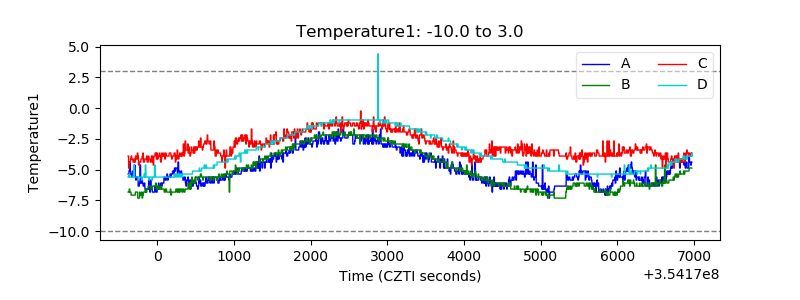 |
| Veto HV Monitor |  |
| Veto LLD | 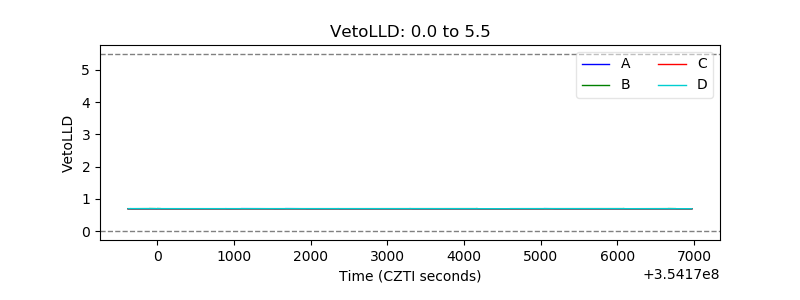 |
| Alpha Counter | 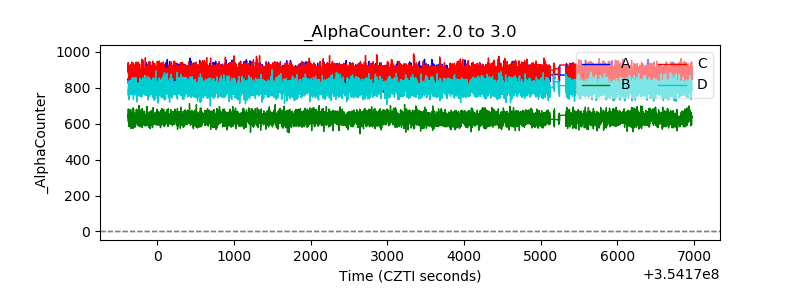 |
| _CPM_Rate | 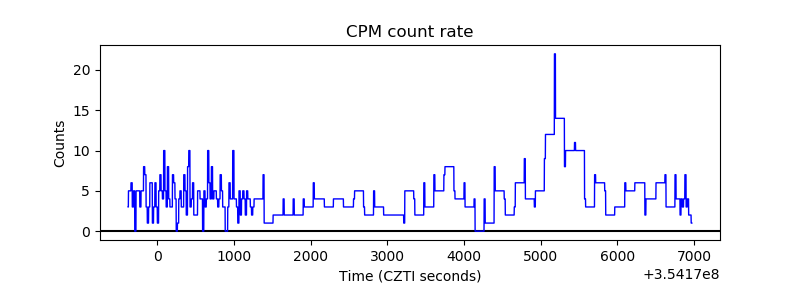 |
| CZT Counter | 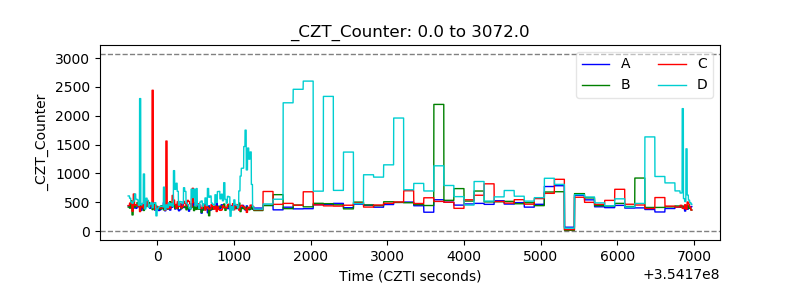 |
| +2.5 Volts monitor |  |
| +5 Volts monitor |  |
| _ROLL_ROT | 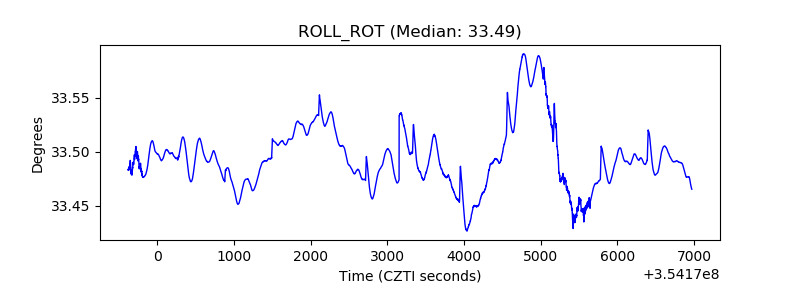 |
| _Roll_DEC | 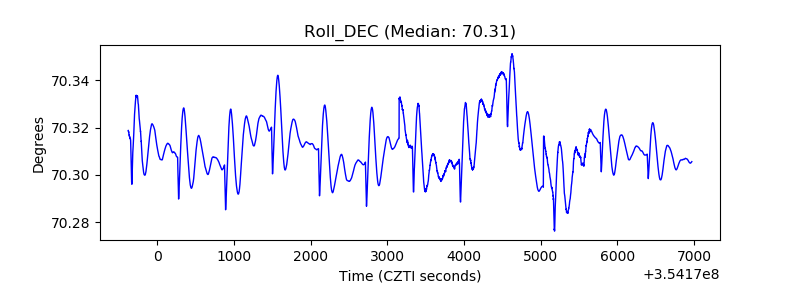 |
| _Roll_RA | 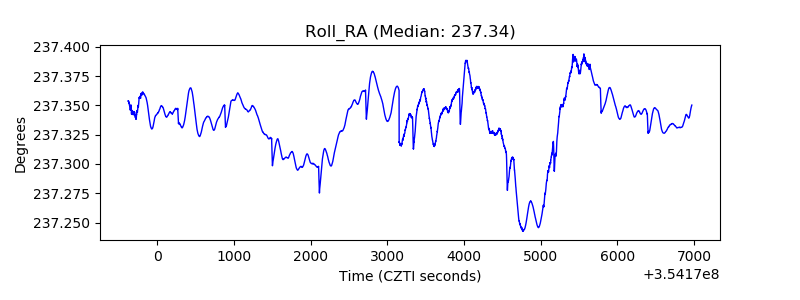 |
| Veto Counter | 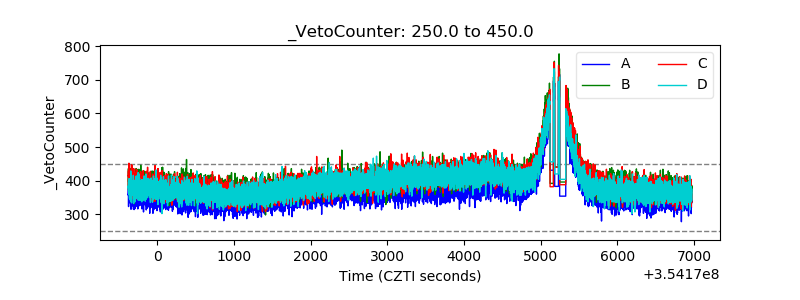 |