| Param | Original file | Final file |
|---|---|---|
| Filename | modeM0/AS1C05_019T01_9000004270_29650cztM0_level2.evt | modeM0/AS1C05_019T01_9000004270_29650cztM0_level2_quad_clean.evt |
| Size (bytes) | 507,718,080 | 105,914,880 |
| Size | 484.2 MB | 101.0 MB |
| Events in quadrant A | 3,089,708 | 687,924 |
| Events in quadrant B | 3,197,278 | 707,592 |
| Events in quadrant C | 3,211,277 | 687,031 |
| Events in quadrant D | 5,412,517 | 647,216 |
| Mode M9 | |||
|---|---|---|---|
| Quadrant | BADHDUFLAG | Total packets | Discarded packets |
| A | 0 | 2 | 0 |
| B | 0 | 2 | 0 |
| C | 0 | 2 | 0 |
| D | 0 | 2 | 0 |
| Mode SS | |||
|---|---|---|---|
| Quadrant | BADHDUFLAG | Total packets | Discarded packets |
| A | 0 | 140 | 0 |
| B | 0 | 140 | 0 |
| C | 0 | 140 | 0 |
| D | 0 | 140 | 0 |
| Mode M0 | |||
|---|---|---|---|
| Quadrant | BADHDUFLAG | Total packets | Discarded packets |
| A | 0 | 13959 | 2 |
| B | 0 | 14072 | 1 |
| C | 0 | 14150 | 1 |
| D | 0 | 20694 | 1 |
| Quadrant | Total seconds | Saturated seconds | Saturation percentage |
|---|---|---|---|
| A | 6851 | 123 | 1.795358% |
| B | 6852 | 145 | 2.116170% |
| C | 6852 | 107 | 1.561588% |
| D | 6852 | 382 | 5.575015% |
Noise dominated data is calculated using 1-second bins in cleaned event files. If a bin has >2000 counts, and if more than 50% of those come from <1% of pixels, then it is considered to be noise-dominated and hence unusable.
| Quadrant | # 1 sec bins | Bins with >0 counts | Bins with >2000 counts | High rate bins dominated by noise | Noise dominated (total time) | Noise dominated (detector-on time) | Marked lightcurve |
|---|---|---|---|---|---|---|---|
| A | 7031 | 6851 | 0 | 0 | 0.00% | 0.00% | 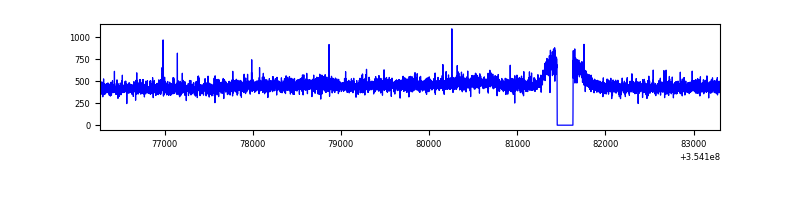 |
| B | 7032 | 6852 | 2 | 2 | 0.03% | 0.03% | 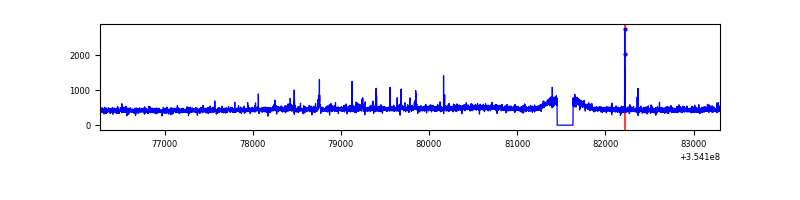 |
| C | 7032 | 6852 | 1 | 1 | 0.01% | 0.01% |  |
| D | 7031 | 6851 | 280 | 280 | 3.98% | 4.09% | 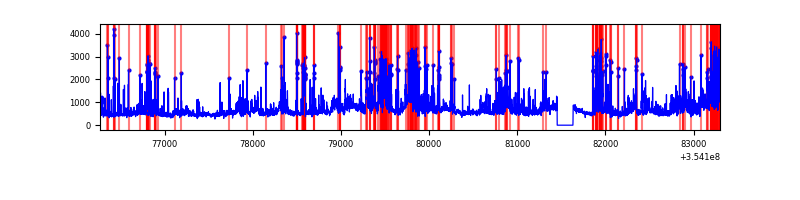 |
Top three noisy pixels from each quadrant. If the there are fewer than three noisy pixels in the level2.evt file, extra rows are filled as -1
| Pixel properties | Quadrant properties | ||||||
|---|---|---|---|---|---|---|---|
| Quadrant | DetID | PixID | Counts | Sigma | Mean | Median | Sigma |
| A | 13 | 254 | 12107 | 69.93 | 798 | 779 | 162.0 |
| A | 3 | 137 | 8161 | 45.57 | 798 | 779 | 162.0 |
| A | 0 | 226 | 6676 | 36.4 | 798 | 779 | 162.0 |
| B | 0 | 229 | 35715 | 228.71 | 795 | 773 | 152.8 |
| B | 12 | 111 | 19403 | 121.94 | 795 | 773 | 152.8 |
| B | 11 | 111 | 17558 | 109.87 | 795 | 773 | 152.8 |
| C | 14 | 238 | 123390 | 681.75 | 768 | 769 | 179.9 |
| C | 7 | 247 | 29901 | 161.97 | 768 | 769 | 179.9 |
| C | 10 | 22 | 23636 | 127.14 | 768 | 769 | 179.9 |
| D | 7 | 80 | 1513979 | 8319.25 | 760 | 737 | 181.9 |
| D | 8 | 195 | 578220 | 3174.79 | 760 | 737 | 181.9 |
| D | 7 | 238 | 154710 | 846.49 | 760 | 737 | 181.9 |
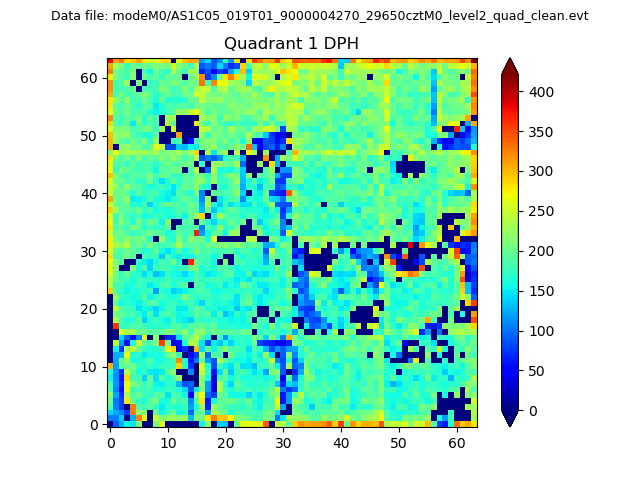
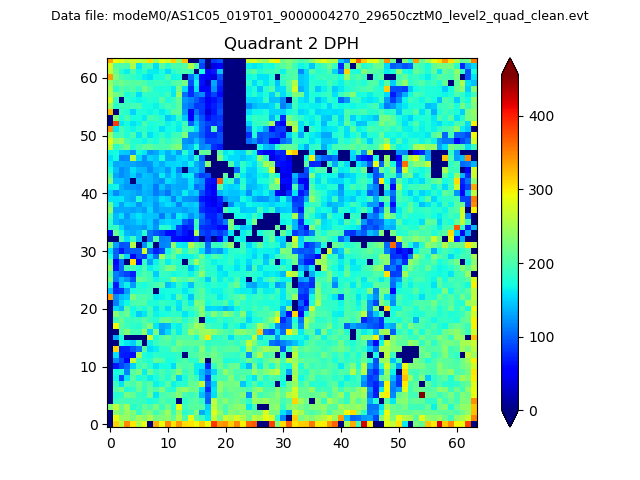
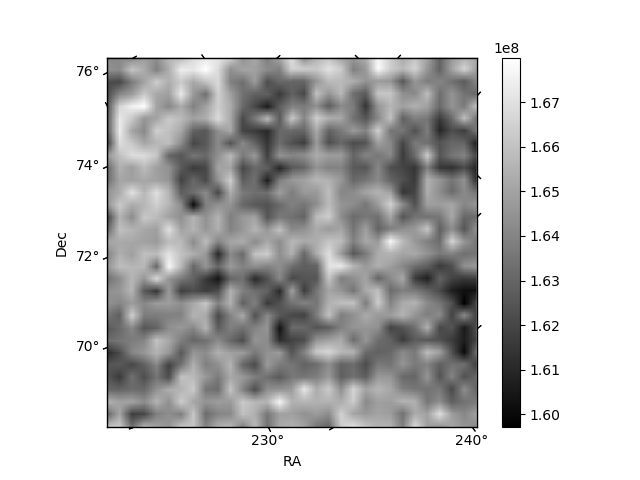
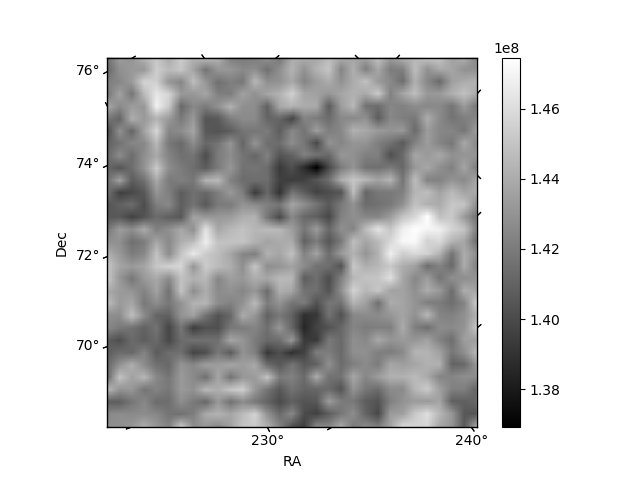
Histogram calculated using DETX and DETY for each event in the final _common_clean file
| Quadrant A | 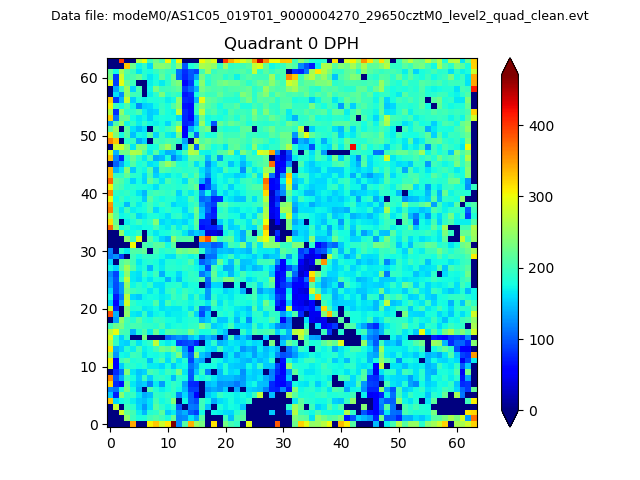 |
 |
Quadrant B |
|---|---|---|---|
| Quadrant D | 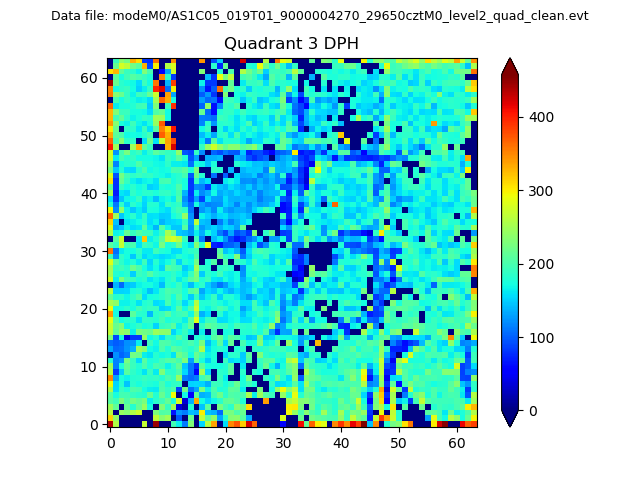 |
 |
Quadrant C |
| Plot type | Count rate plots | Images |
|---|---|---|
| Comparison with Poisson distribution Blue bars denote a histogram of data divided into 1 sec bins. Red curve is a Poisson curve with rate = median count rate of data. |
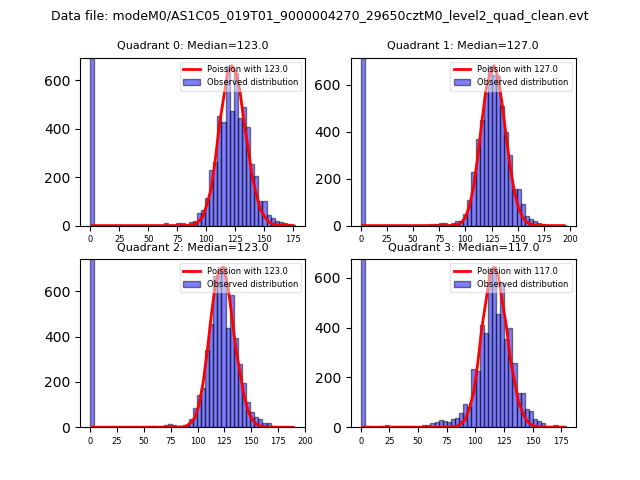 |
 |
| Quadrant-wise count rates Data is divided into 100 sec bins |
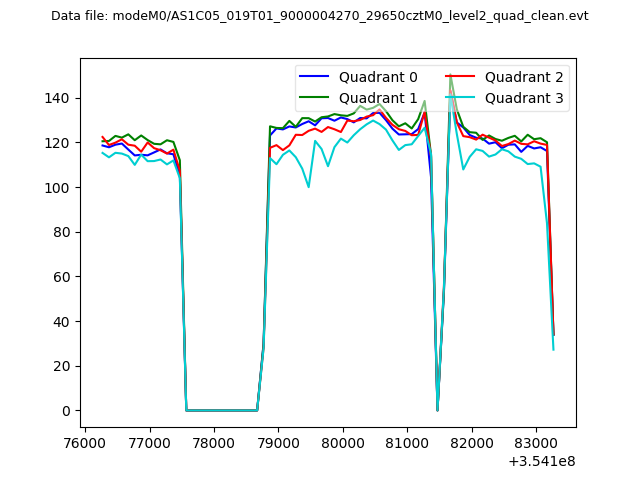 |
|
| Module-wise count rates for Quadrant A Data is divided into 100 sec bins |
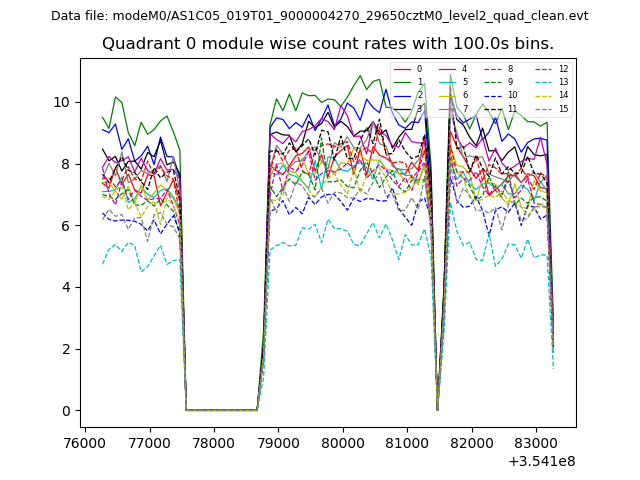 |
 |
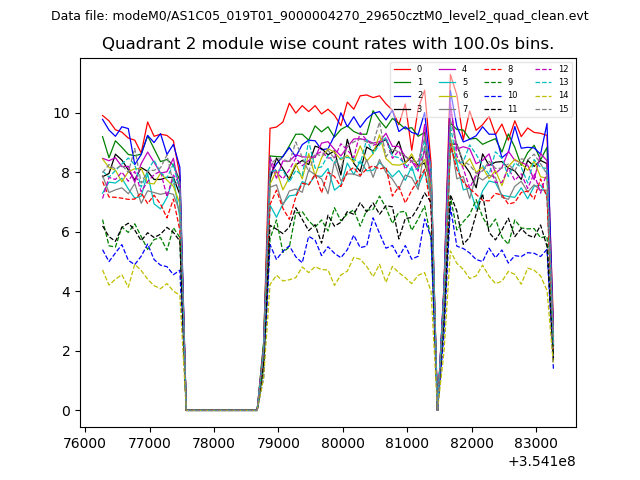
| Module-wise count rates for Quadrant B Data is divided into 100 sec bins |
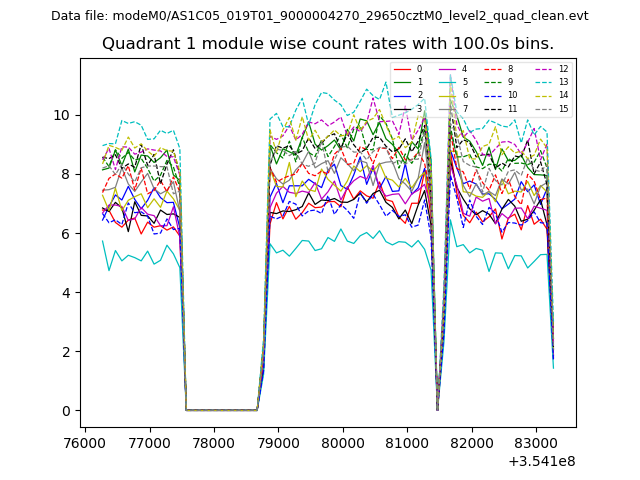 |
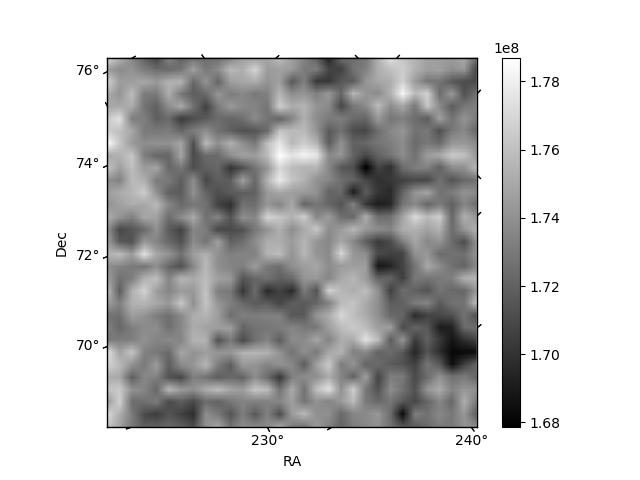 |
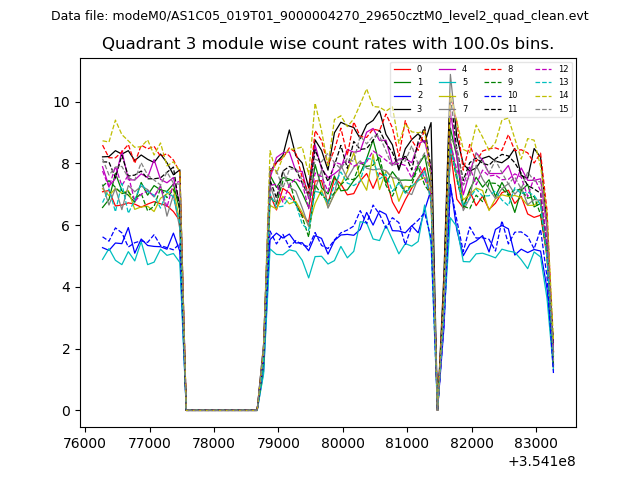
| Module-wise count rates for Quadrant C Data is divided into 100 sec bins |
 |
 |
| Module-wise count rates for Quadrant D Data is divided into 100 sec bins |
 |
 |
| Parameter | Plot |
|---|---|
| CZT HV Monitor | 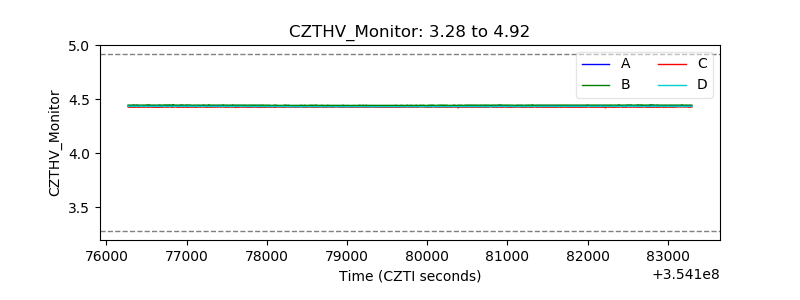 |
| D_VDD | 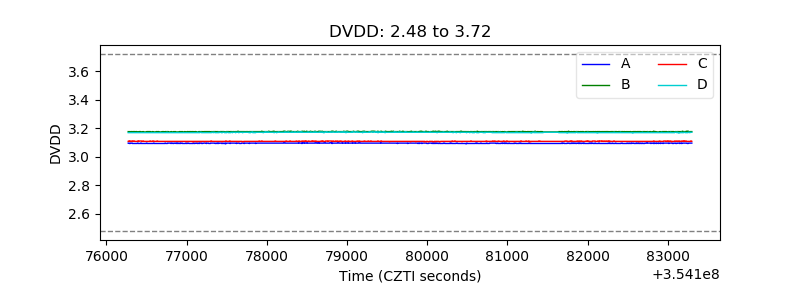 |
| Temperature 1 | 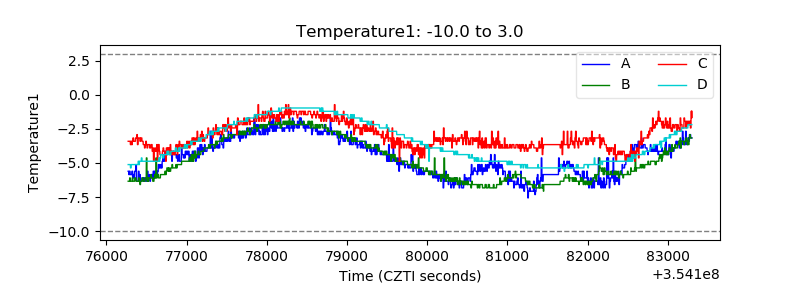 |
| Veto HV Monitor | 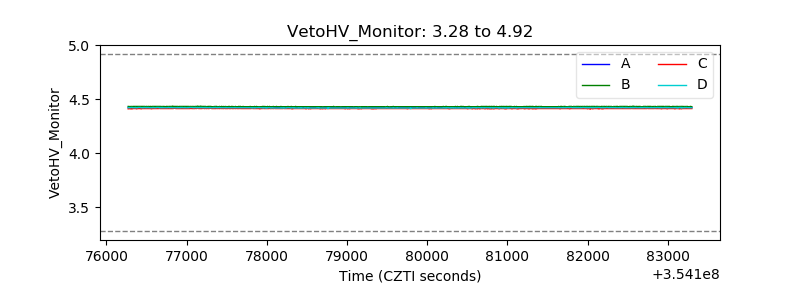 |
| Veto LLD | 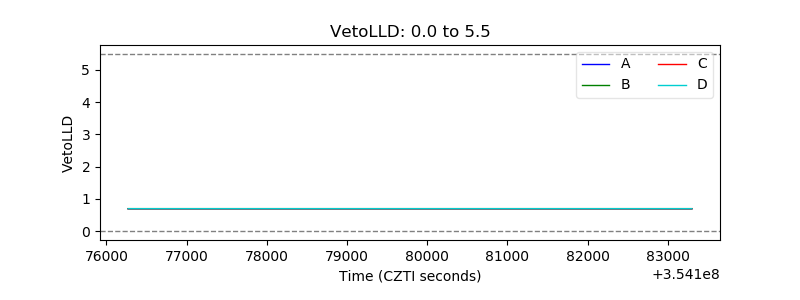 |
| Alpha Counter | 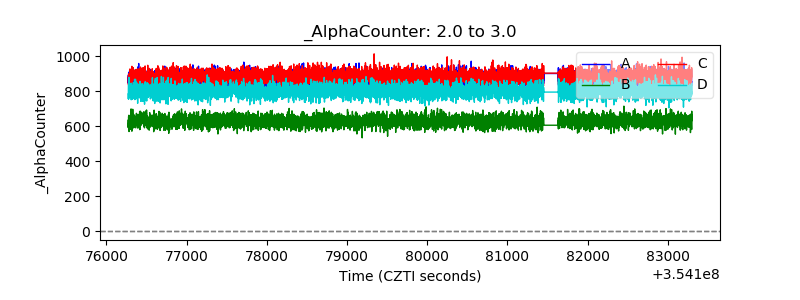 |
| _CPM_Rate | 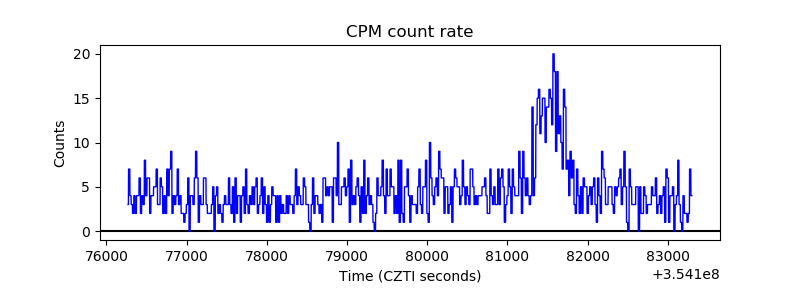 |
| CZT Counter | 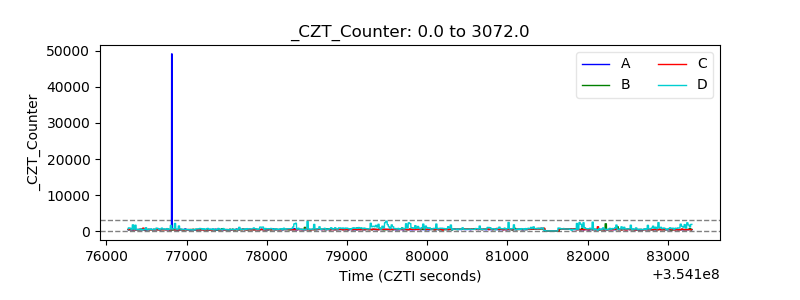 |
| +2.5 Volts monitor |  |
| +5 Volts monitor |  |
| _ROLL_ROT | 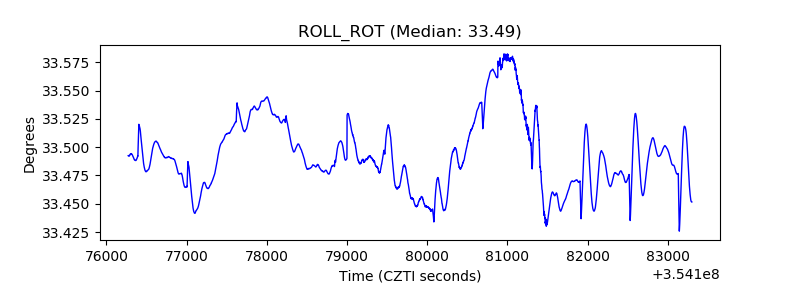 |
| _Roll_DEC | 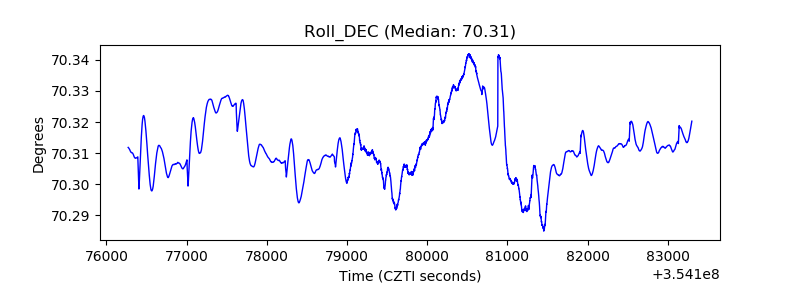 |
| _Roll_RA |  |
| Veto Counter | 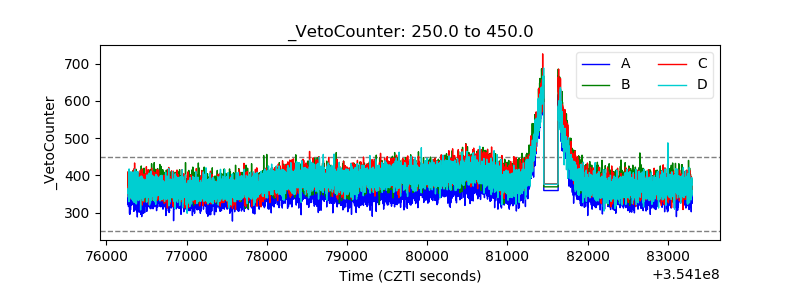 |