| Param | Original file | Final file |
|---|---|---|
| Filename | modeM0/AS1C05_019T01_9000004270_29657cztM0_level2.evt | modeM0/AS1C05_019T01_9000004270_29657cztM0_level2_quad_clean.evt |
| Size (bytes) | 582,007,680 | 108,005,760 |
| Size | 555.0 MB | 103.0 MB |
| Events in quadrant A | 2,906,184 | 743,233 |
| Events in quadrant B | 3,114,531 | 763,650 |
| Events in quadrant C | 3,065,768 | 744,171 |
| Events in quadrant D | 8,134,971 | 602,385 |
| Mode M9 | |||
|---|---|---|---|
| Quadrant | BADHDUFLAG | Total packets | Discarded packets |
| A | 0 | 12 | 0 |
| B | 0 | 12 | 0 |
| C | 0 | 12 | 0 |
| D | 0 | 12 | 0 |
| Mode SS | |||
|---|---|---|---|
| Quadrant | BADHDUFLAG | Total packets | Discarded packets |
| A | 0 | 122 | 0 |
| B | 0 | 122 | 0 |
| C | 0 | 122 | 0 |
| D | 0 | 122 | 0 |
| Mode M0 | |||
|---|---|---|---|
| Quadrant | BADHDUFLAG | Total packets | Discarded packets |
| A | 0 | 12688 | 1 |
| B | 0 | 13289 | 1 |
| C | 0 | 13116 | 1 |
| D | 0 | 28271 | 1 |
| Quadrant | Total seconds | Saturated seconds | Saturation percentage |
|---|---|---|---|
| A | 5968 | 32 | 0.536193% |
| B | 5968 | 64 | 1.072386% |
| C | 5968 | 87 | 1.457775% |
| D | 5968 | 1814 | 30.395442% |
Noise dominated data is calculated using 1-second bins in cleaned event files. If a bin has >2000 counts, and if more than 50% of those come from <1% of pixels, then it is considered to be noise-dominated and hence unusable.
| Quadrant | # 1 sec bins | Bins with >0 counts | Bins with >2000 counts | High rate bins dominated by noise | Noise dominated (total time) | Noise dominated (detector-on time) | Marked lightcurve |
|---|---|---|---|---|---|---|---|
| A | 7158 | 5968 | 0 | 0 | 0.00% | 0.00% | 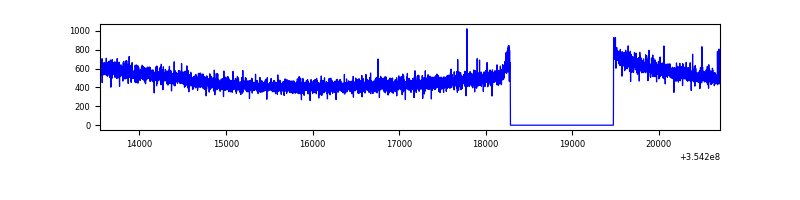 |
| B | 7158 | 5968 | 10 | 10 | 0.14% | 0.17% | 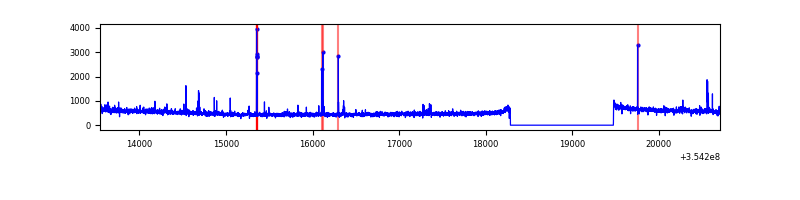 |
| C | 7158 | 5968 | 0 | 0 | 0.00% | 0.00% | 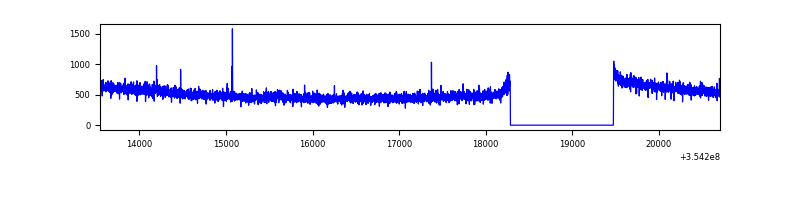 |
| D | 7158 | 5968 | 1591 | 1591 | 22.23% | 26.66% | 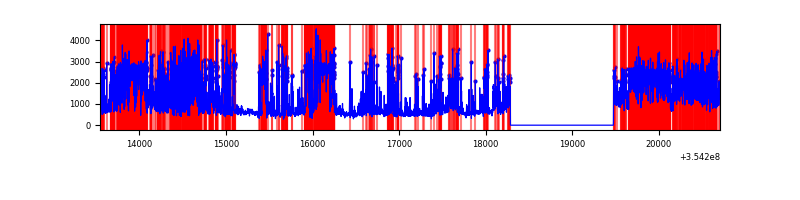 |
Top three noisy pixels from each quadrant. If the there are fewer than three noisy pixels in the level2.evt file, extra rows are filled as -1
| Pixel properties | Quadrant properties | ||||||
|---|---|---|---|---|---|---|---|
| Quadrant | DetID | PixID | Counts | Sigma | Mean | Median | Sigma |
| A | 13 | 254 | 11292 | 70.49 | 752 | 735 | 149.8 |
| A | 3 | 137 | 7165 | 42.93 | 752 | 735 | 149.8 |
| A | 0 | 226 | 6402 | 37.84 | 752 | 735 | 149.8 |
| B | 10 | 245 | 65324 | 463.97 | 755 | 736 | 139.2 |
| B | 4 | 171 | 25421 | 177.33 | 755 | 736 | 139.2 |
| B | 12 | 111 | 16729 | 114.89 | 755 | 736 | 139.2 |
| C | 14 | 238 | 121602 | 699.02 | 744 | 748 | 172.9 |
| C | 3 | 233 | 21616 | 120.7 | 744 | 748 | 172.9 |
| C | 2 | 114 | 14472 | 79.38 | 744 | 748 | 172.9 |
| D | 7 | 80 | 5191958 | 34442.89 | 638 | 622 | 150.7 |
| D | 8 | 195 | 470337 | 3116.41 | 638 | 622 | 150.7 |
| D | 2 | 250 | 36576 | 238.54 | 638 | 622 | 150.7 |
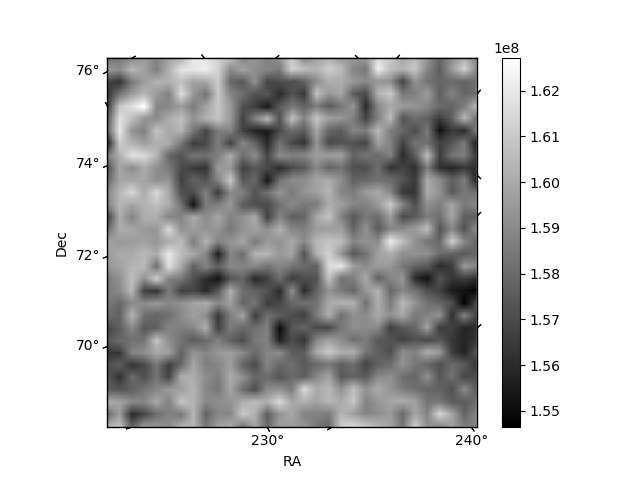
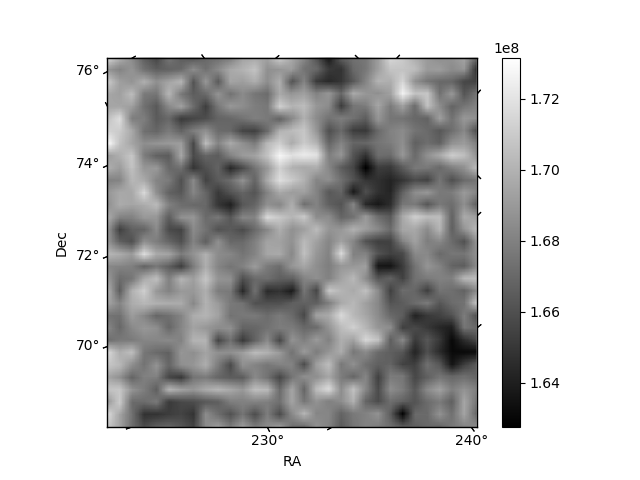
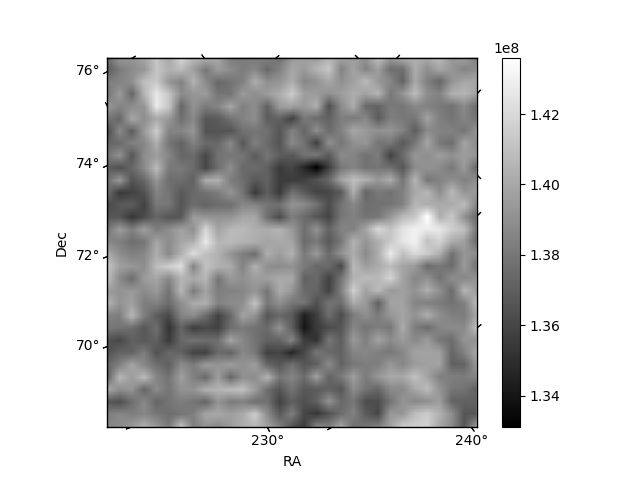
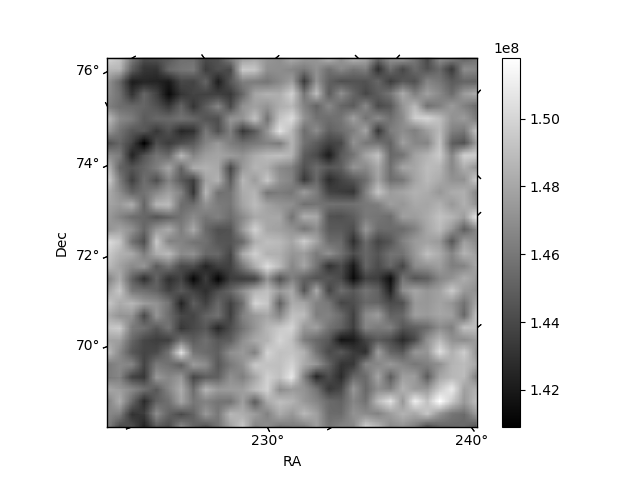
Histogram calculated using DETX and DETY for each event in the final _common_clean file
| Quadrant A | 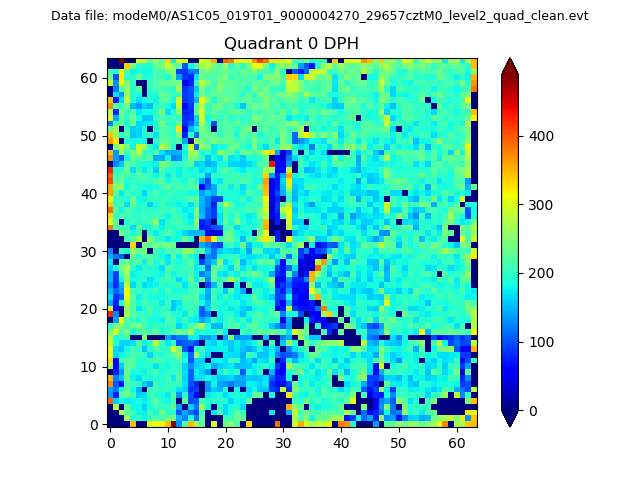 |
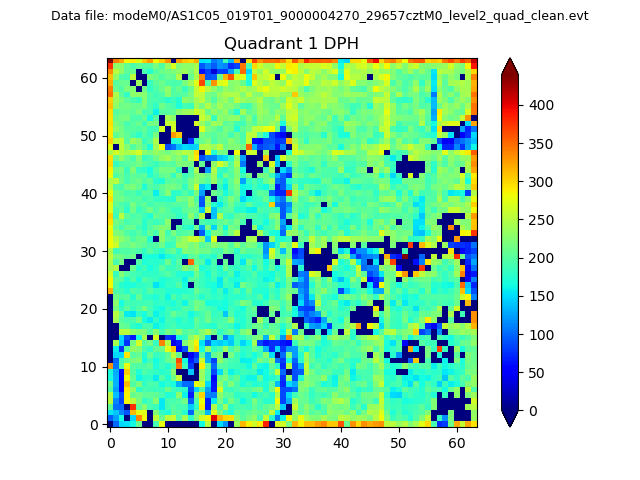 |
Quadrant B |
|---|---|---|---|
| Quadrant D | 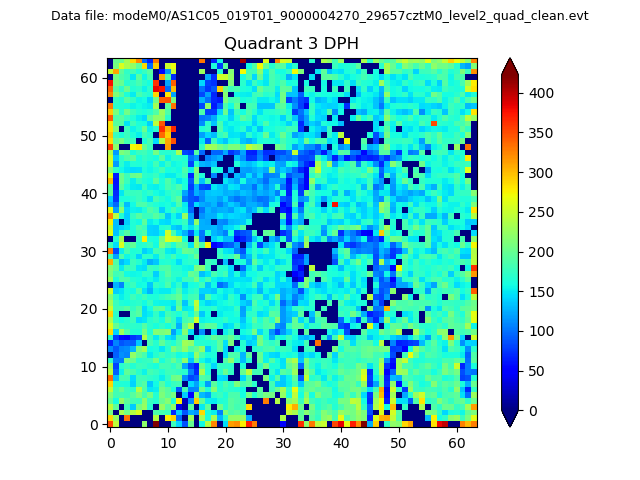 |
 |
Quadrant C |
| Plot type | Count rate plots | Images |
|---|---|---|
| Comparison with Poisson distribution Blue bars denote a histogram of data divided into 1 sec bins. Red curve is a Poisson curve with rate = median count rate of data. |
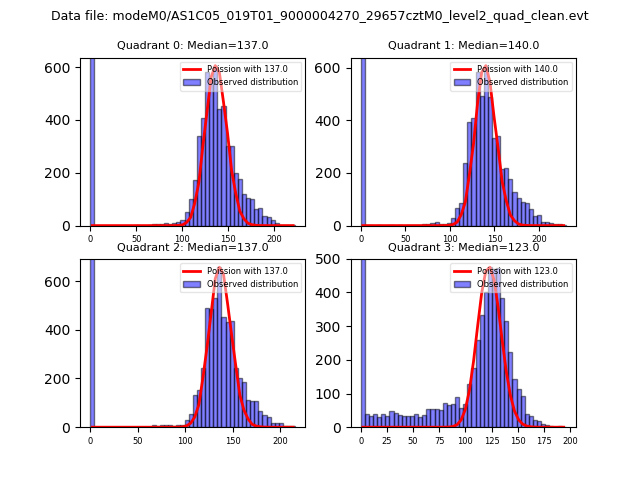 |
 |
| Quadrant-wise count rates Data is divided into 100 sec bins |
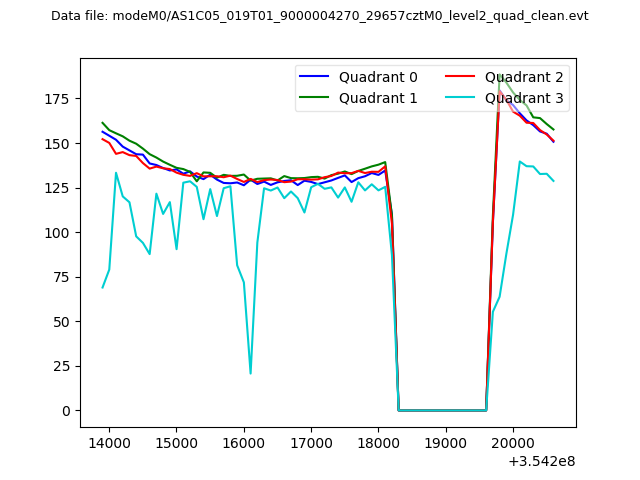 |
|
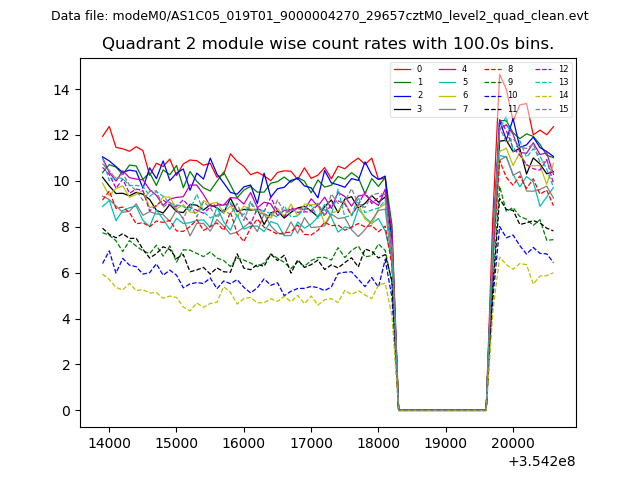
| Module-wise count rates for Quadrant A Data is divided into 100 sec bins |
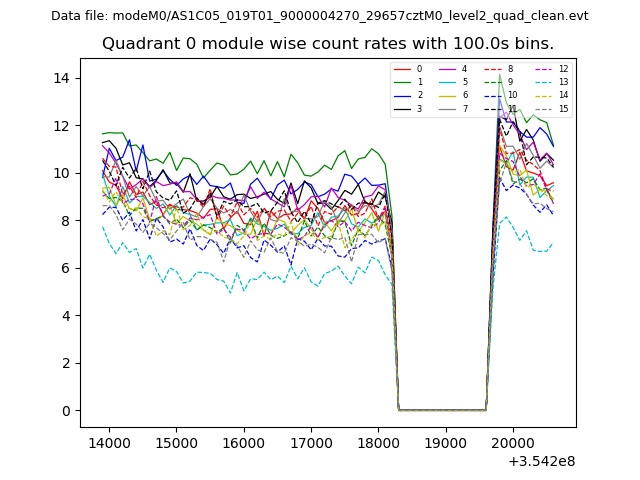 |
 |
| Module-wise count rates for Quadrant B Data is divided into 100 sec bins |
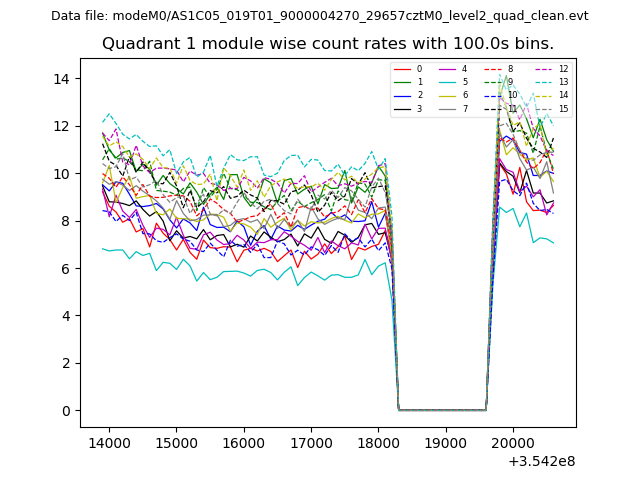 |
 |
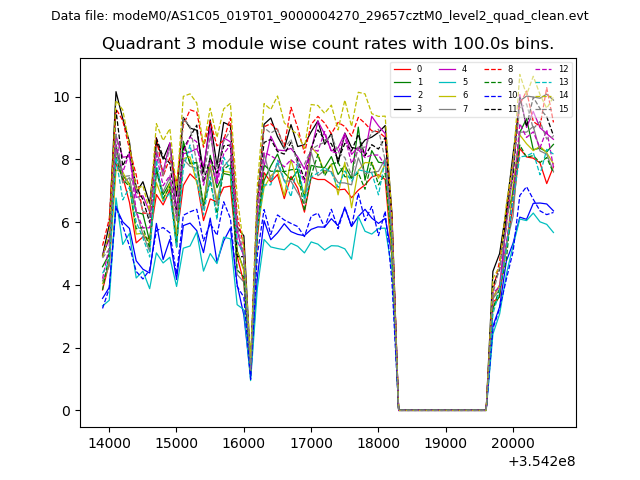
| Module-wise count rates for Quadrant C Data is divided into 100 sec bins |
 |
 |
| Module-wise count rates for Quadrant D Data is divided into 100 sec bins |
 |
 |
| Parameter | Plot |
|---|---|
| CZT HV Monitor | 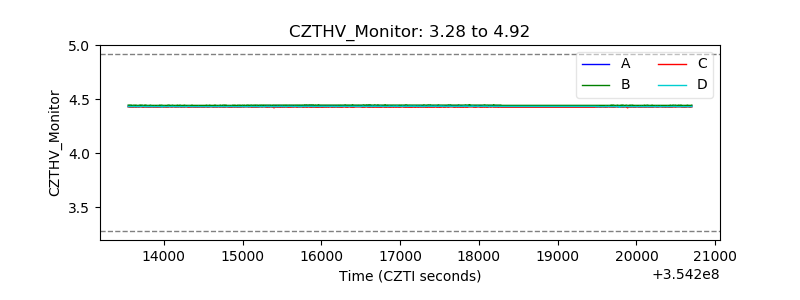 |
| D_VDD | 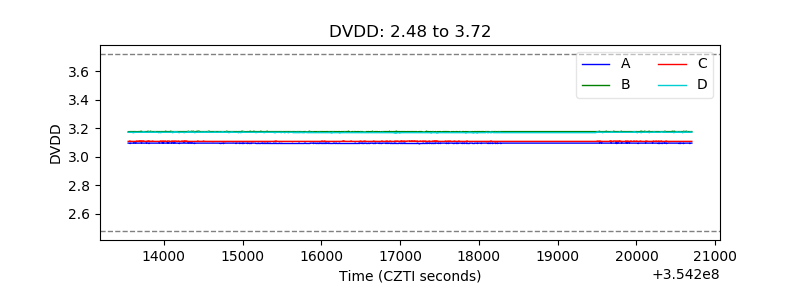 |
| Temperature 1 | 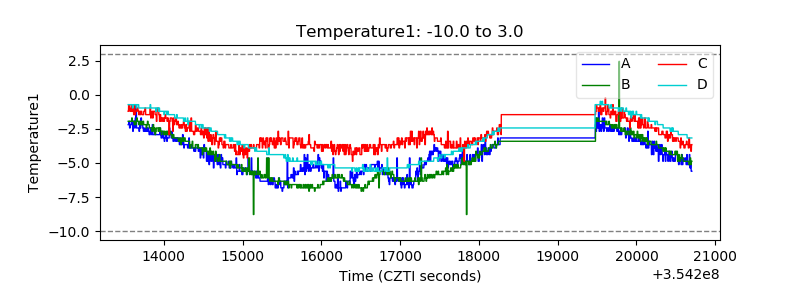 |
| Veto HV Monitor | 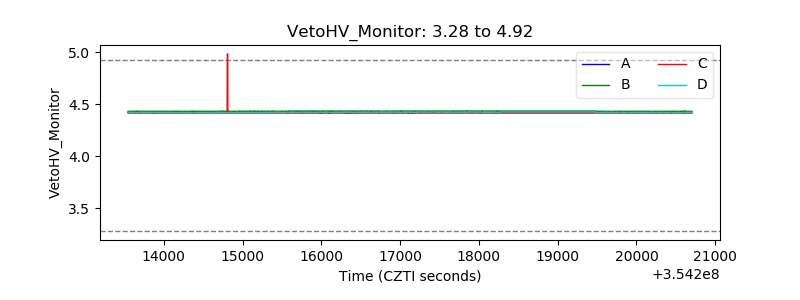 |
| Veto LLD | 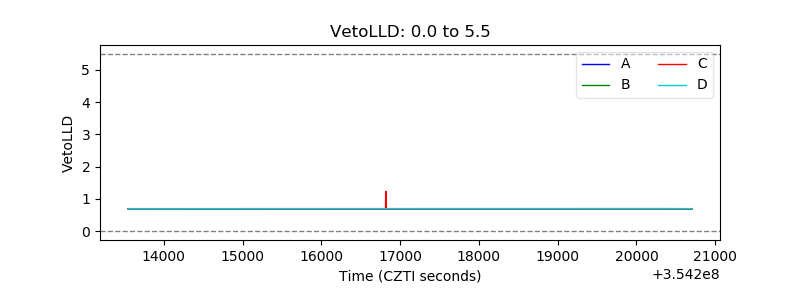 |
| Alpha Counter | 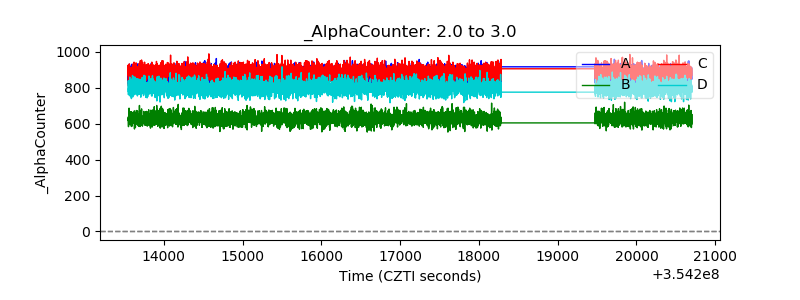 |
| _CPM_Rate | 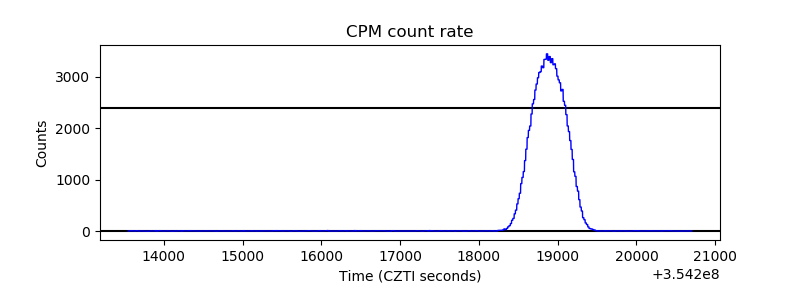 |
| CZT Counter |  |
| +2.5 Volts monitor |  |
| +5 Volts monitor | 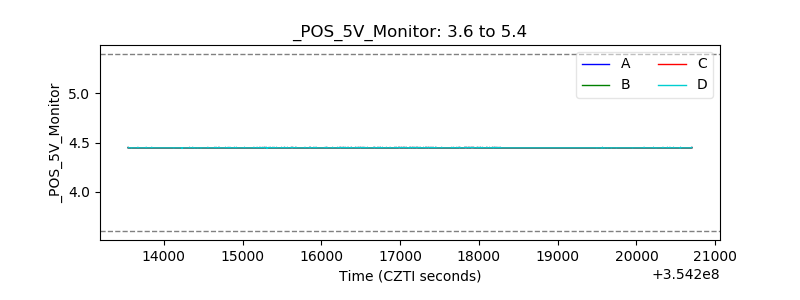 |
| _ROLL_ROT | 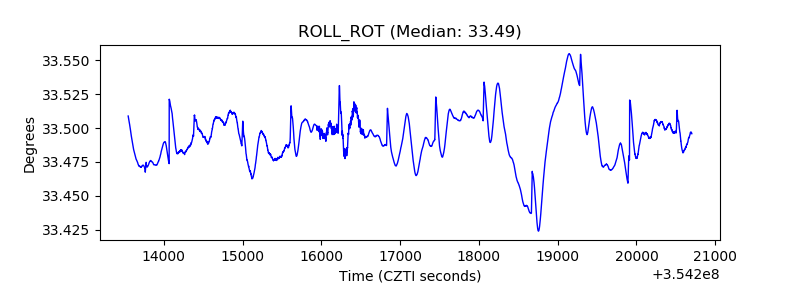 |
| _Roll_DEC | 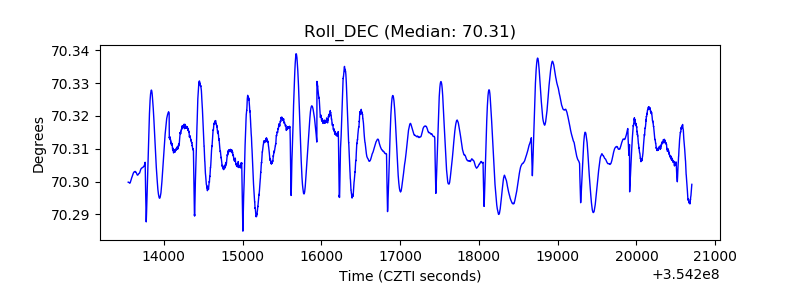 |
| _Roll_RA | 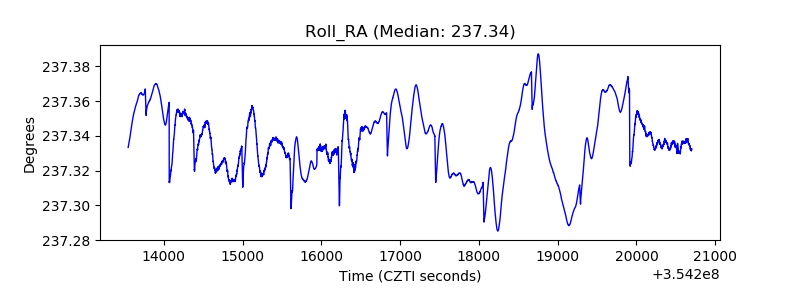 |
| Veto Counter |  |