| Param | Original file | Final file |
|---|---|---|
| Filename | modeM0/AS1C05_019T01_9000004270_29658cztM0_level2.evt | modeM0/AS1C05_019T01_9000004270_29658cztM0_level2_quad_clean.evt |
| Size (bytes) | 595,290,240 | 126,069,120 |
| Size | 567.7 MB | 120.2 MB |
| Events in quadrant A | 3,153,765 | 863,607 |
| Events in quadrant B | 3,409,796 | 897,210 |
| Events in quadrant C | 3,451,488 | 874,335 |
| Events in quadrant D | 7,591,959 | 748,499 |
| Mode M9 | |||
|---|---|---|---|
| Quadrant | BADHDUFLAG | Total packets | Discarded packets |
| A | 0 | 23 | 0 |
| B | 0 | 24 | 0 |
| C | 0 | 24 | 0 |
| D | 0 | 24 | 0 |
| Mode SS | |||
|---|---|---|---|
| Quadrant | BADHDUFLAG | Total packets | Discarded packets |
| A | 0 | 126 | 0 |
| B | 0 | 126 | 0 |
| C | 0 | 126 | 0 |
| D | 0 | 126 | 0 |
| Mode M0 | |||
|---|---|---|---|
| Quadrant | BADHDUFLAG | Total packets | Discarded packets |
| A | 0 | 13564 | 2 |
| B | 0 | 14327 | 2 |
| C | 0 | 14491 | 2 |
| D | 0 | 26990 | 2 |
| Quadrant | Total seconds | Saturated seconds | Saturation percentage |
|---|---|---|---|
| A | 6225 | 43 | 0.690763% |
| B | 6225 | 86 | 1.381526% |
| C | 6225 | 136 | 2.184739% |
| D | 6225 | 1351 | 21.702811% |
Noise dominated data is calculated using 1-second bins in cleaned event files. If a bin has >2000 counts, and if more than 50% of those come from <1% of pixels, then it is considered to be noise-dominated and hence unusable.
| Quadrant | # 1 sec bins | Bins with >0 counts | Bins with >2000 counts | High rate bins dominated by noise | Noise dominated (total time) | Noise dominated (detector-on time) | Marked lightcurve |
|---|---|---|---|---|---|---|---|
| A | 7510 | 6225 | 0 | 0 | 0.00% | 0.00% | 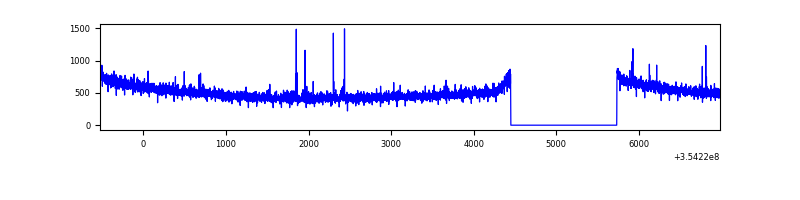 |
| B | 7510 | 6226 | 19 | 19 | 0.25% | 0.31% | 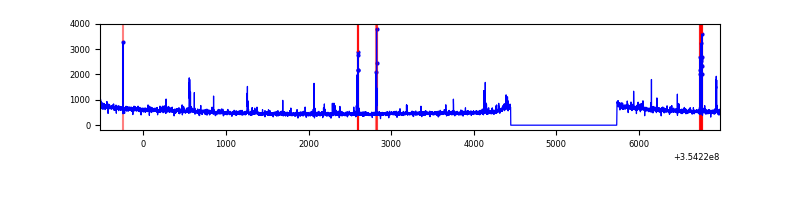 |
| C | 7510 | 6225 | 7 | 7 | 0.09% | 0.11% | 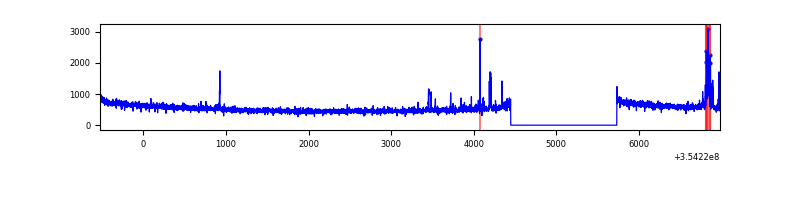 |
| D | 7510 | 6226 | 1141 | 1141 | 15.19% | 18.33% | 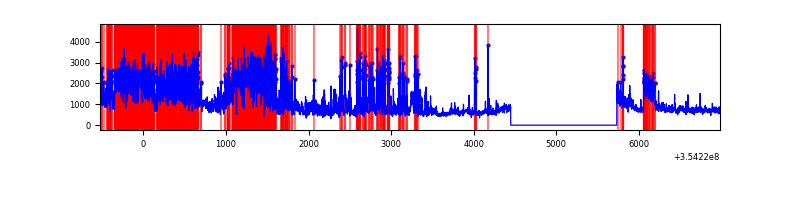 |
Top three noisy pixels from each quadrant. If the there are fewer than three noisy pixels in the level2.evt file, extra rows are filled as -1
| Pixel properties | Quadrant properties | ||||||
|---|---|---|---|---|---|---|---|
| Quadrant | DetID | PixID | Counts | Sigma | Mean | Median | Sigma |
| A | 12 | 96 | 20440 | 121.93 | 811 | 796 | 161.1 |
| A | 13 | 254 | 11399 | 65.82 | 811 | 796 | 161.1 |
| A | 3 | 137 | 7419 | 41.11 | 811 | 796 | 161.1 |
| B | 10 | 245 | 64745 | 424.11 | 820 | 801 | 150.8 |
| B | 4 | 171 | 41875 | 272.43 | 820 | 801 | 150.8 |
| B | 5 | 172 | 35682 | 231.35 | 820 | 801 | 150.8 |
| C | 14 | 238 | 133538 | 716.31 | 808 | 815 | 185.3 |
| C | 10 | 22 | 105182 | 563.27 | 808 | 815 | 185.3 |
| C | 7 | 247 | 30659 | 161.07 | 808 | 815 | 185.3 |
| D | 7 | 80 | 3839931 | 22164.89 | 738 | 720 | 173.2 |
| D | 8 | 195 | 561508 | 3237.59 | 738 | 720 | 173.2 |
| D | 7 | 238 | 182896 | 1051.76 | 738 | 720 | 173.2 |
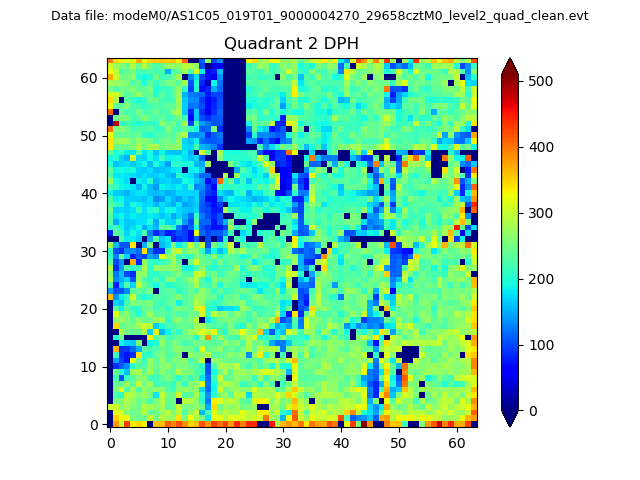
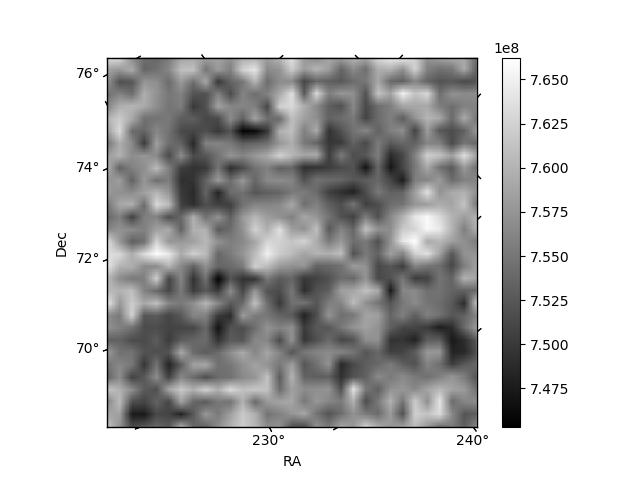
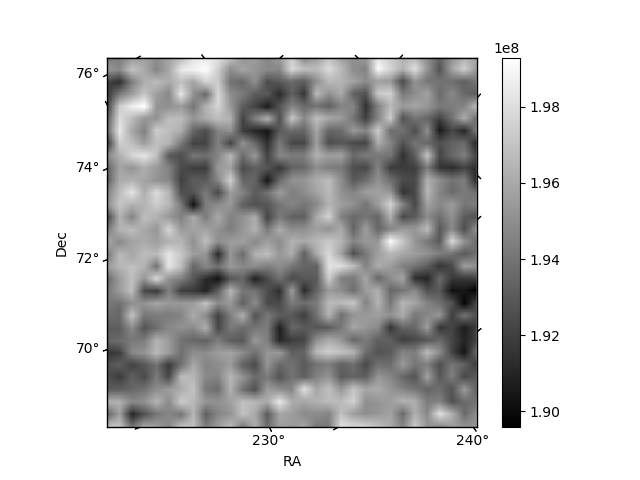
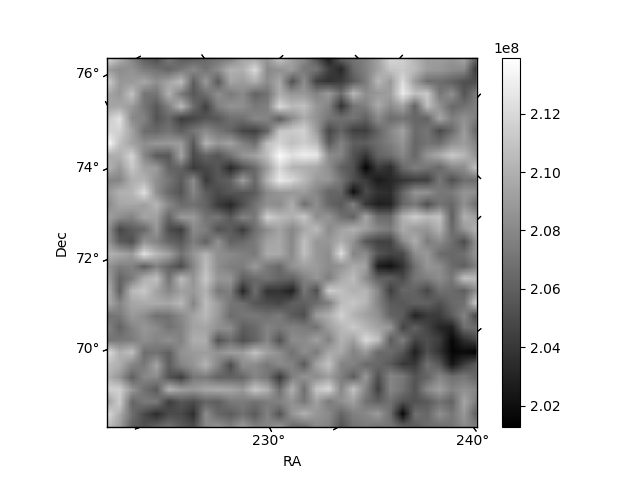
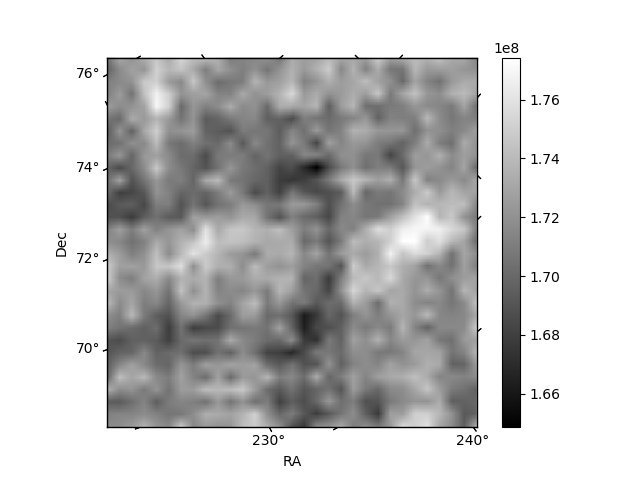
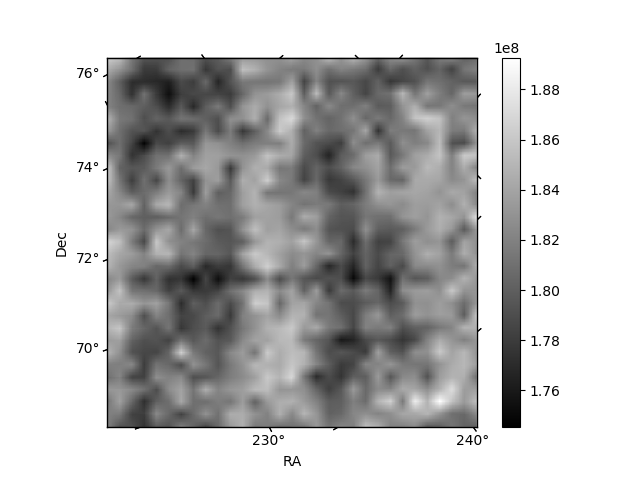
Histogram calculated using DETX and DETY for each event in the final _common_clean file
| Quadrant A | 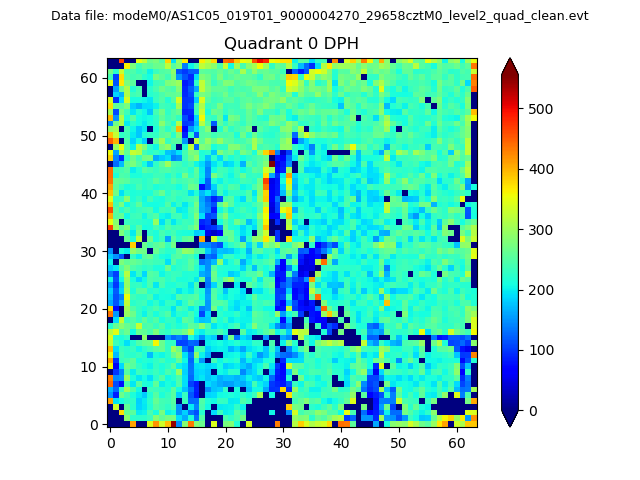 |
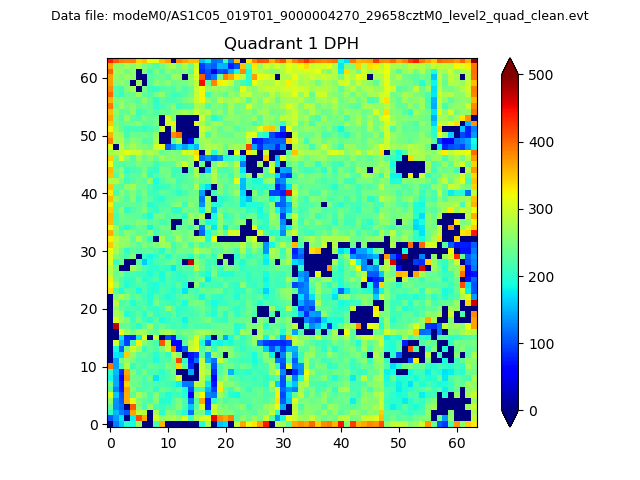 |
Quadrant B |
|---|---|---|---|
| Quadrant D | 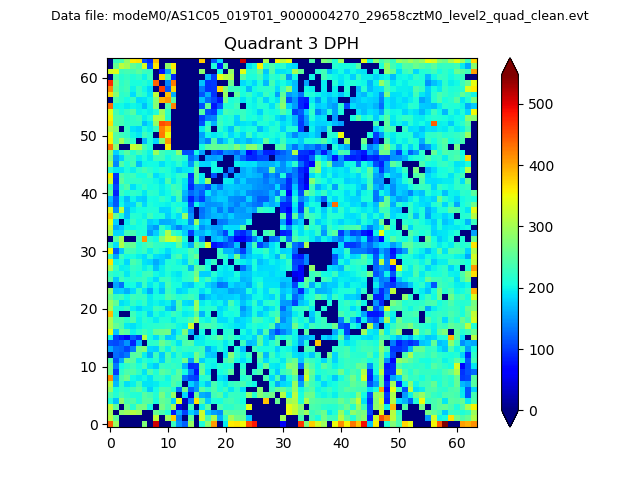 |
 |
Quadrant C |
| Plot type | Count rate plots | Images |
|---|---|---|
| Comparison with Poisson distribution Blue bars denote a histogram of data divided into 1 sec bins. Red curve is a Poisson curve with rate = median count rate of data. |
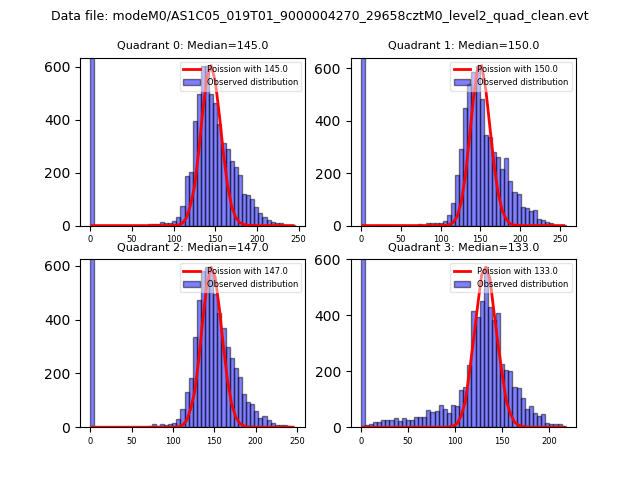 |
 |
| Quadrant-wise count rates Data is divided into 100 sec bins |
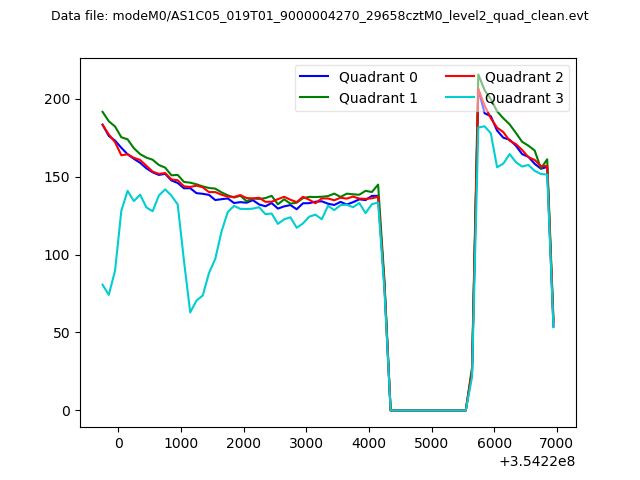 |
|
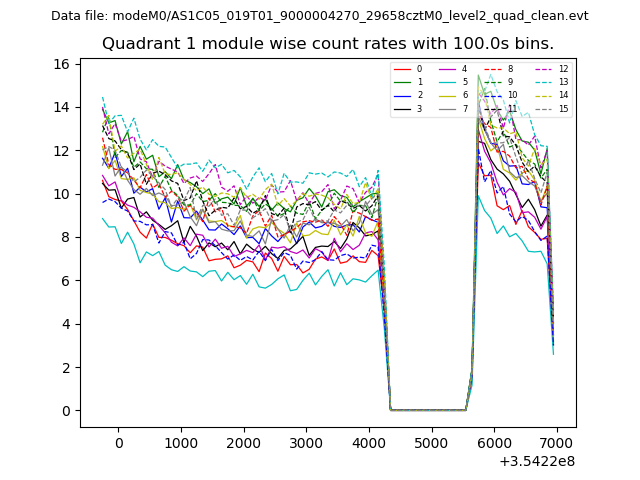
| Module-wise count rates for Quadrant A Data is divided into 100 sec bins |
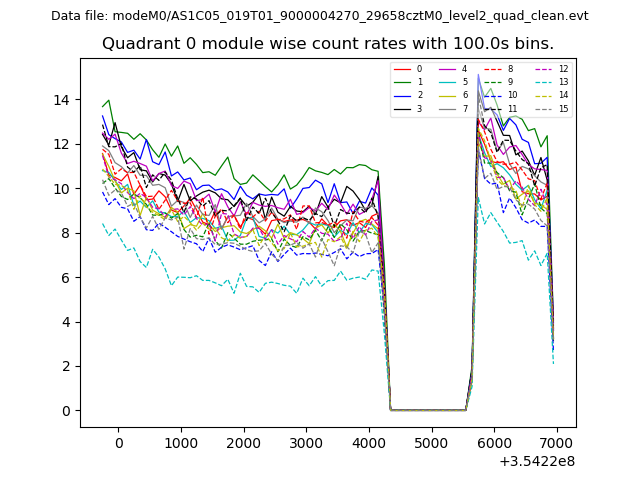 |
 |
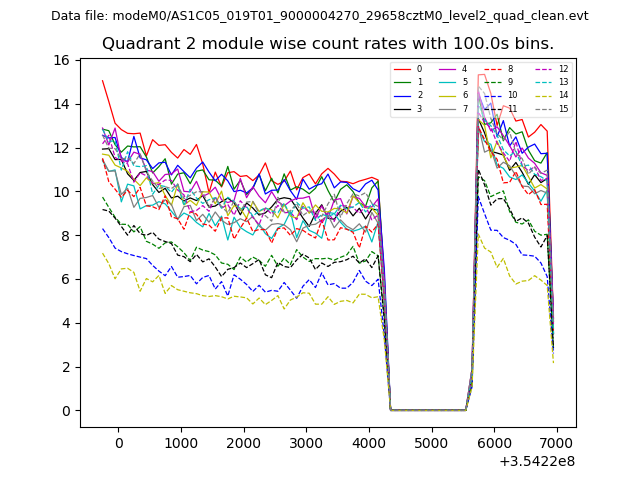
| Module-wise count rates for Quadrant B Data is divided into 100 sec bins |
 |
 |
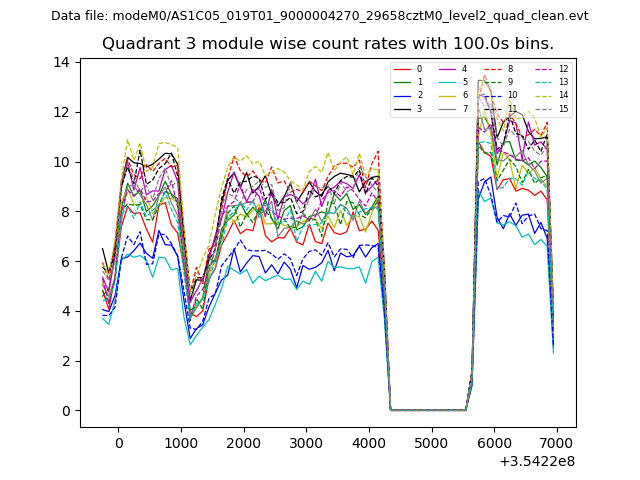
| Module-wise count rates for Quadrant C Data is divided into 100 sec bins |
 |
 |
| Module-wise count rates for Quadrant D Data is divided into 100 sec bins |
 |
 |
| Parameter | Plot |
|---|---|
| CZT HV Monitor | 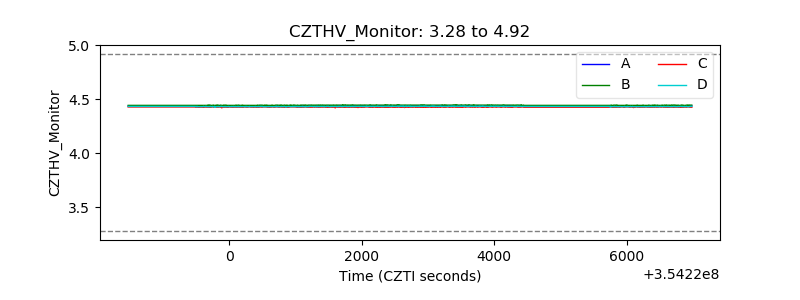 |
| D_VDD |  |
| Temperature 1 | 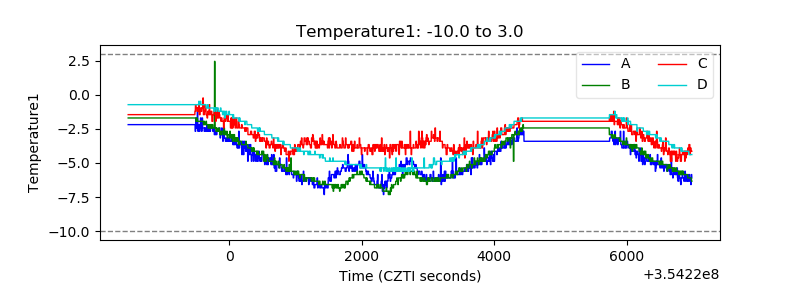 |
| Veto HV Monitor |  |
| Veto LLD | 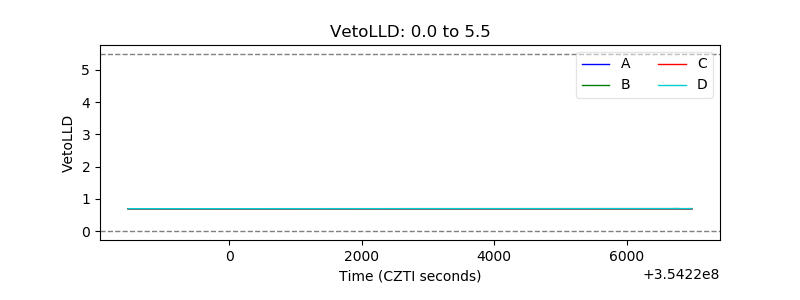 |
| Alpha Counter | 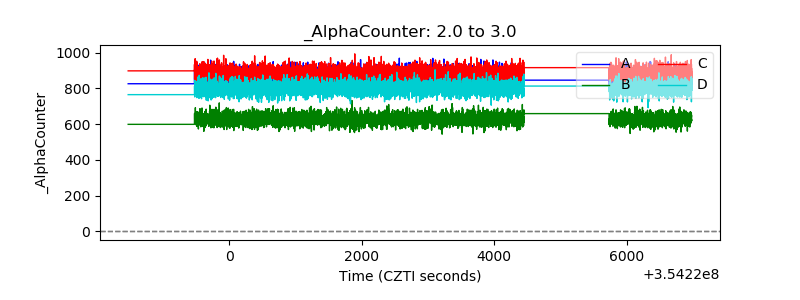 |
| _CPM_Rate | 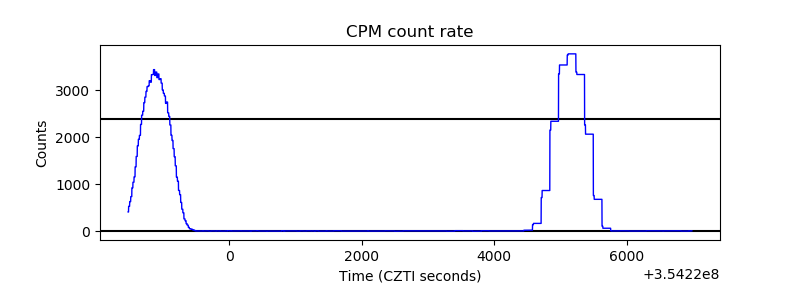 |
| CZT Counter | 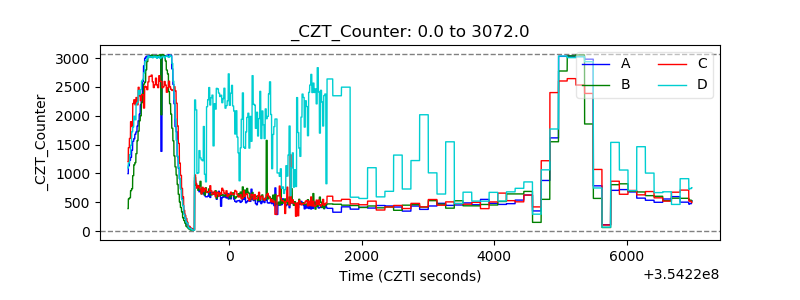 |
| +2.5 Volts monitor |  |
| +5 Volts monitor |  |
| _ROLL_ROT | 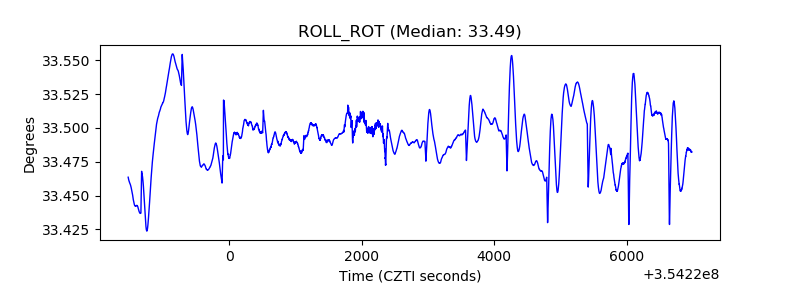 |
| _Roll_DEC | 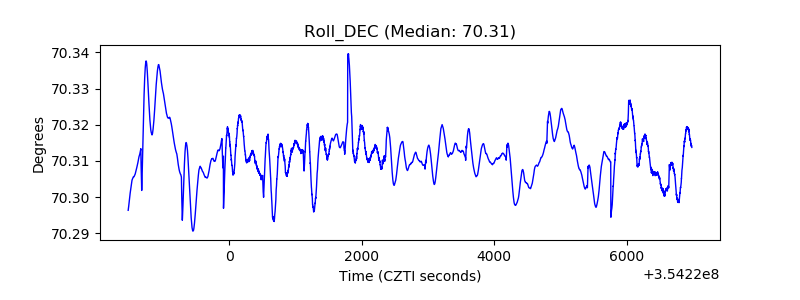 |
| _Roll_RA |  |
| Veto Counter | 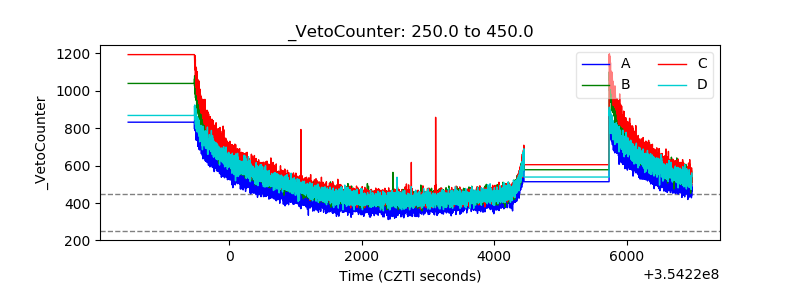 |