| Param | Original file | Final file |
|---|---|---|
| Filename | modeM0/AS1C05_019T01_9000004270_29659cztM0_level2.evt | modeM0/AS1C05_019T01_9000004270_29659cztM0_level2_quad_clean.evt |
| Size (bytes) | 582,384,960 | 125,853,120 |
| Size | 555.4 MB | 120.0 MB |
| Events in quadrant A | 3,082,751 | 850,807 |
| Events in quadrant B | 3,657,510 | 884,718 |
| Events in quadrant C | 3,392,265 | 866,747 |
| Events in quadrant D | 7,088,870 | 780,348 |
| Mode M9 | |||
|---|---|---|---|
| Quadrant | BADHDUFLAG | Total packets | Discarded packets |
| A | 0 | 20 | 0 |
| B | 0 | 21 | 0 |
| C | 0 | 21 | 0 |
| D | 0 | 21 | 0 |
| Mode SS | |||
|---|---|---|---|
| Quadrant | BADHDUFLAG | Total packets | Discarded packets |
| A | 0 | 126 | 0 |
| B | 0 | 126 | 0 |
| C | 0 | 126 | 0 |
| D | 0 | 126 | 0 |
| Mode M0 | |||
|---|---|---|---|
| Quadrant | BADHDUFLAG | Total packets | Discarded packets |
| A | 0 | 13192 | 2 |
| B | 0 | 14883 | 2 |
| C | 0 | 14185 | 2 |
| D | 0 | 25388 | 5 |
| Quadrant | Total seconds | Saturated seconds | Saturation percentage |
|---|---|---|---|
| A | 6144 | 55 | 0.895182% |
| B | 6144 | 134 | 2.180990% |
| C | 6144 | 158 | 2.571615% |
| D | 6143 | 1075 | 17.499593% |
Noise dominated data is calculated using 1-second bins in cleaned event files. If a bin has >2000 counts, and if more than 50% of those come from <1% of pixels, then it is considered to be noise-dominated and hence unusable.
| Quadrant | # 1 sec bins | Bins with >0 counts | Bins with >2000 counts | High rate bins dominated by noise | Noise dominated (total time) | Noise dominated (detector-on time) | Marked lightcurve |
|---|---|---|---|---|---|---|---|
| A | 7454 | 6145 | 0 | 0 | 0.00% | 0.00% |  |
| B | 7454 | 6145 | 45 | 45 | 0.60% | 0.73% | 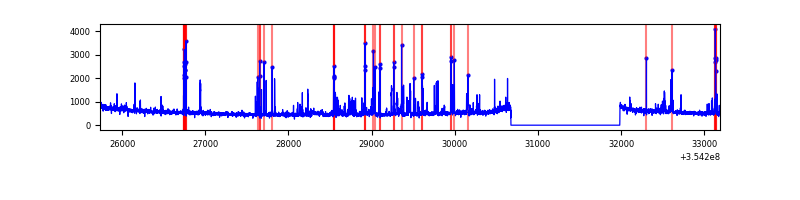 |
| C | 7454 | 6144 | 6 | 6 | 0.08% | 0.10% | 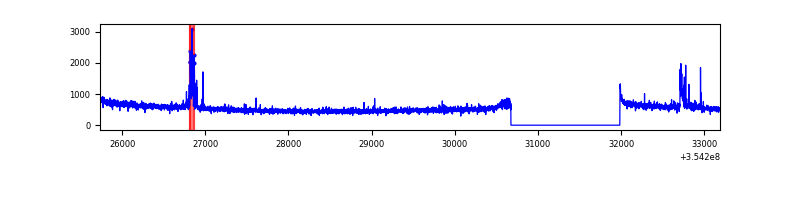 |
| D | 7453 | 6143 | 917 | 917 | 12.30% | 14.93% | 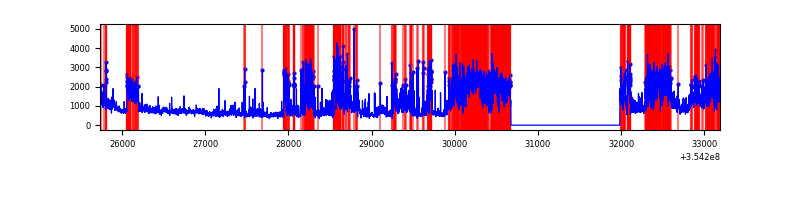 |
Top three noisy pixels from each quadrant. If the there are fewer than three noisy pixels in the level2.evt file, extra rows are filled as -1
| Pixel properties | Quadrant properties | ||||||
|---|---|---|---|---|---|---|---|
| Quadrant | DetID | PixID | Counts | Sigma | Mean | Median | Sigma |
| A | 13 | 254 | 10917 | 64.19 | 795 | 780 | 157.9 |
| A | 12 | 96 | 9249 | 53.62 | 795 | 780 | 157.9 |
| A | 3 | 137 | 7280 | 41.16 | 795 | 780 | 157.9 |
| B | 10 | 245 | 381699 | 2581.73 | 804 | 785 | 147.5 |
| B | 0 | 229 | 67281 | 450.69 | 804 | 785 | 147.5 |
| B | 5 | 172 | 35962 | 238.42 | 804 | 785 | 147.5 |
| C | 14 | 238 | 129620 | 712.73 | 794 | 800 | 180.7 |
| C | 10 | 22 | 116299 | 639.03 | 794 | 800 | 180.7 |
| C | 3 | 233 | 26239 | 140.75 | 794 | 800 | 180.7 |
| D | 7 | 80 | 2821264 | 16449.63 | 731 | 713 | 171.5 |
| D | 7 | 238 | 666292 | 3881.7 | 731 | 713 | 171.5 |
| D | 8 | 195 | 455997 | 2655.25 | 731 | 713 | 171.5 |
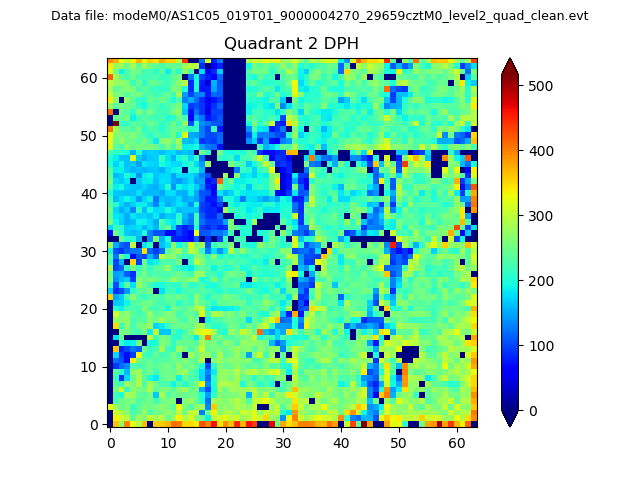
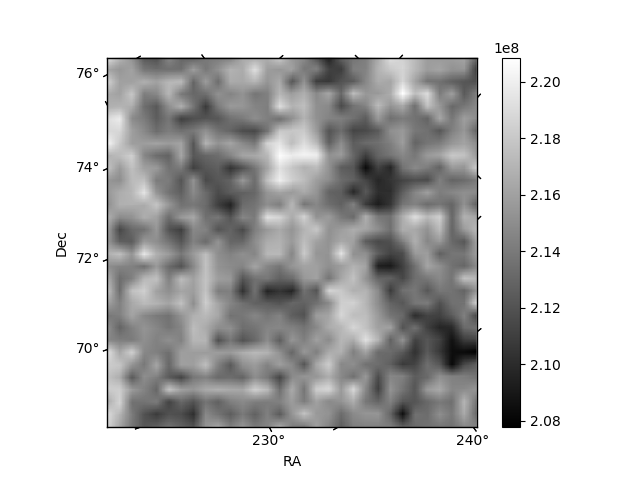
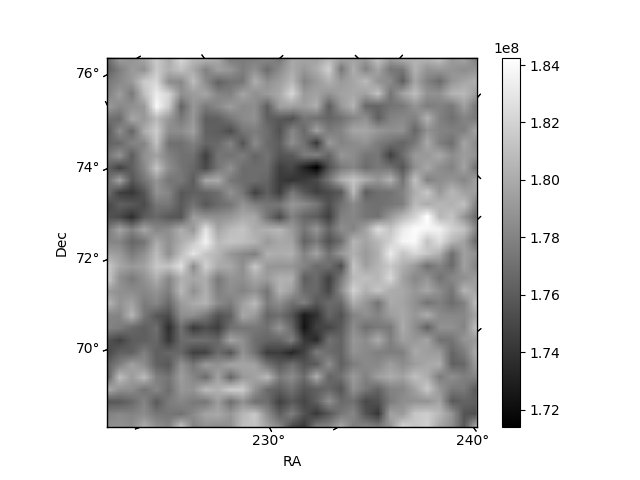
Histogram calculated using DETX and DETY for each event in the final _common_clean file
| Quadrant A | 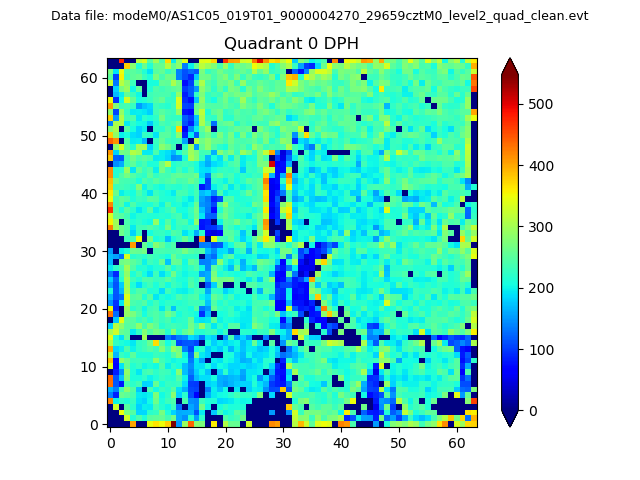 |
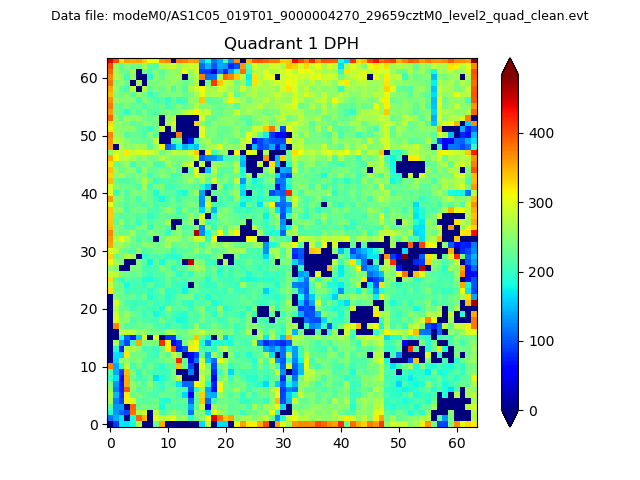 |
Quadrant B |
|---|---|---|---|
| Quadrant D | 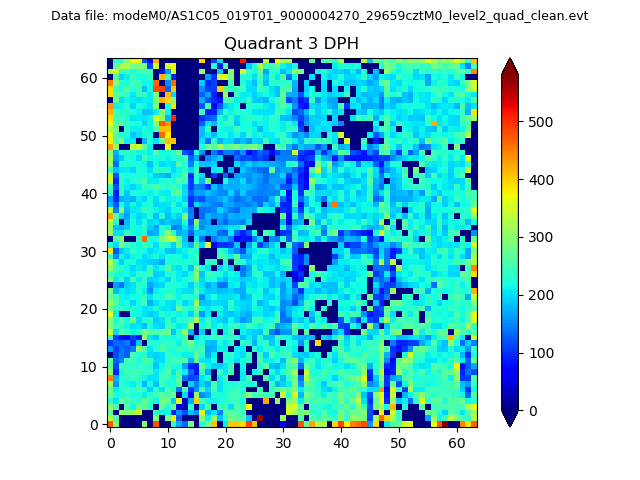 |
 |
Quadrant C |
| Plot type | Count rate plots | Images |
|---|---|---|
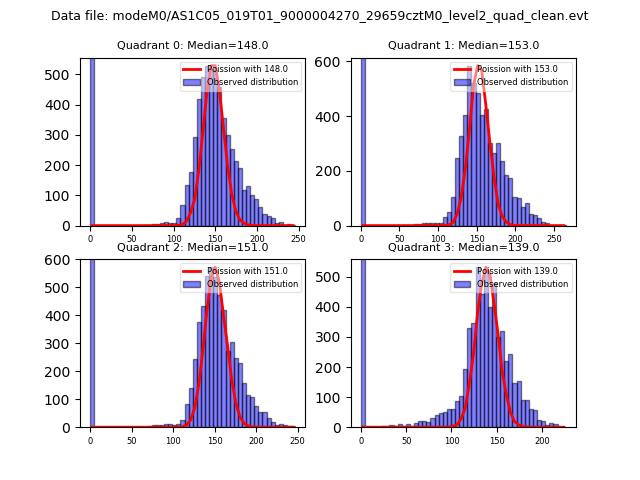
| Comparison with Poisson distribution Blue bars denote a histogram of data divided into 1 sec bins. Red curve is a Poisson curve with rate = median count rate of data. |
 |
 |
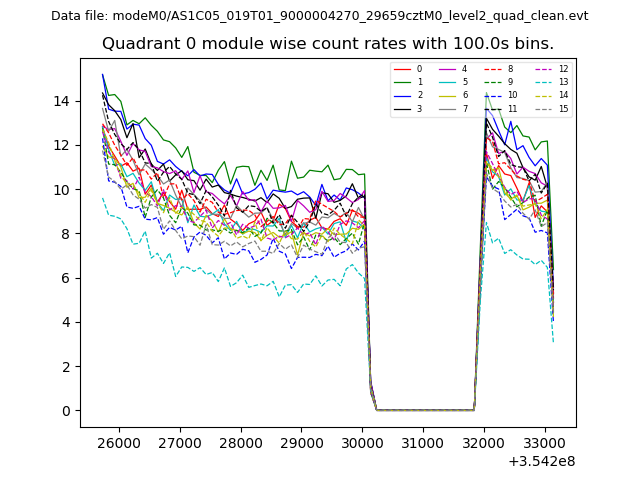
| Quadrant-wise count rates Data is divided into 100 sec bins |
 |
|
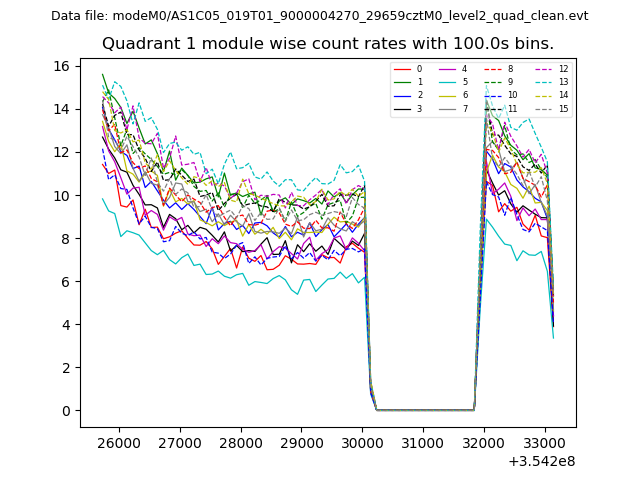
| Module-wise count rates for Quadrant A Data is divided into 100 sec bins |
 |
 |
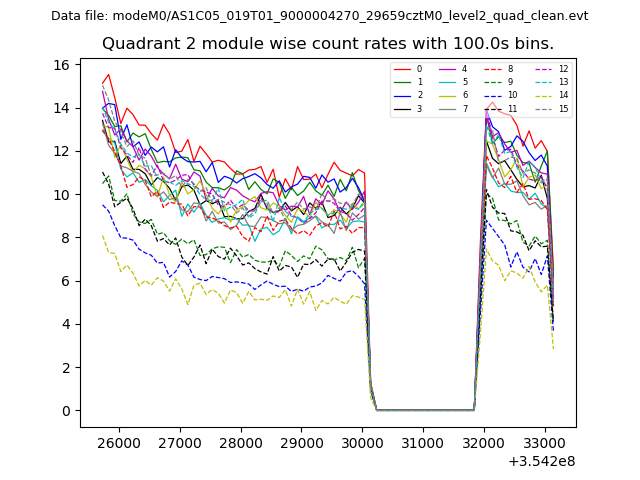
| Module-wise count rates for Quadrant B Data is divided into 100 sec bins |
 |
 |
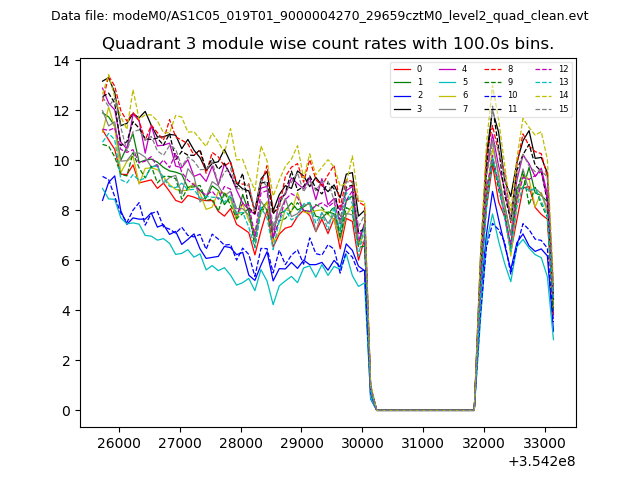
| Module-wise count rates for Quadrant C Data is divided into 100 sec bins |
 |
 |
| Module-wise count rates for Quadrant D Data is divided into 100 sec bins |
 |
 |
| Parameter | Plot |
|---|---|
| CZT HV Monitor | 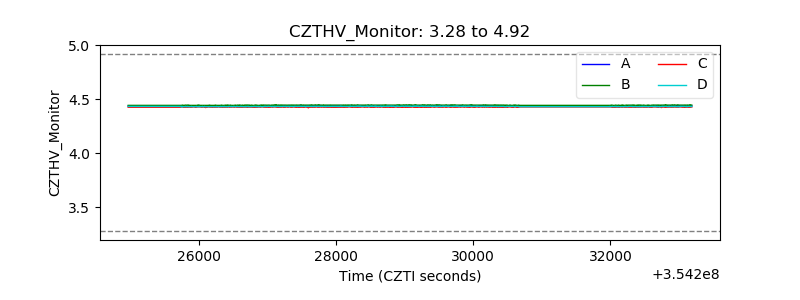 |
| D_VDD | 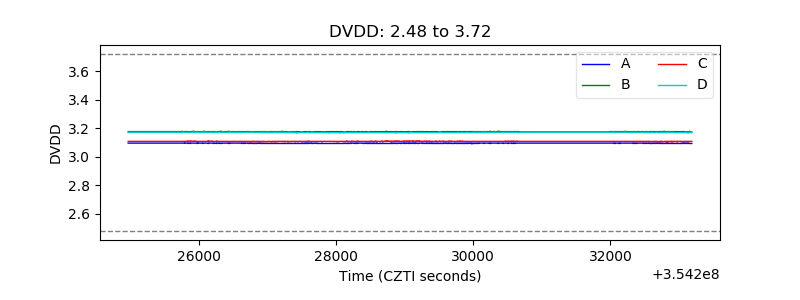 |
| Temperature 1 | 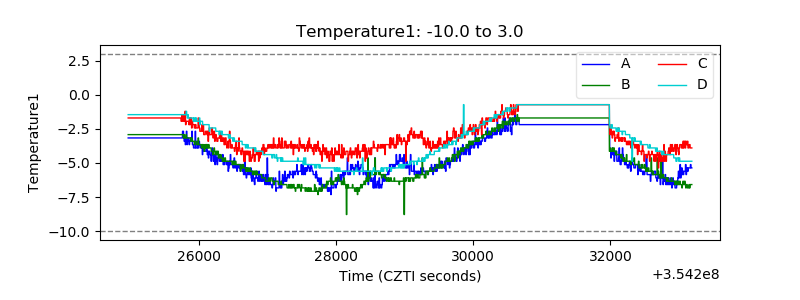 |
| Veto HV Monitor | 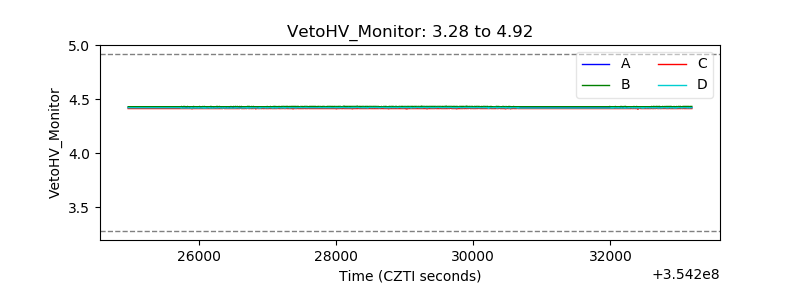 |
| Veto LLD | 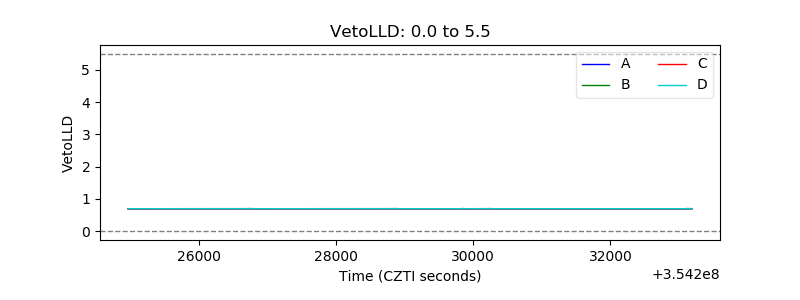 |
| Alpha Counter |  |
| _CPM_Rate | 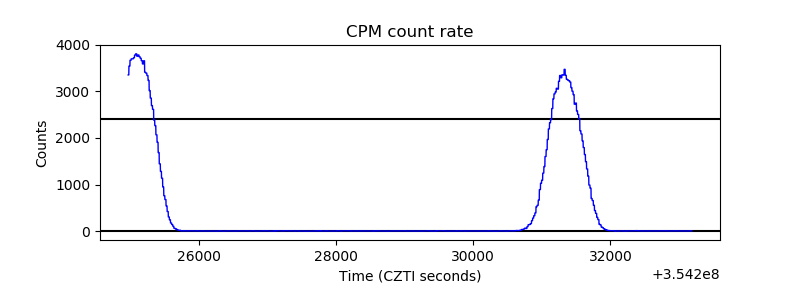 |
| CZT Counter | 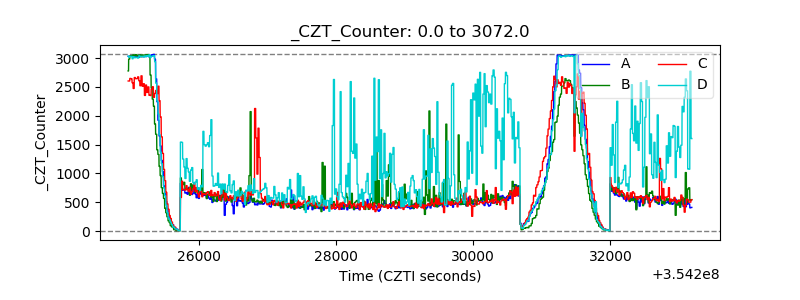 |
| +2.5 Volts monitor |  |
| +5 Volts monitor |  |
| _ROLL_ROT | 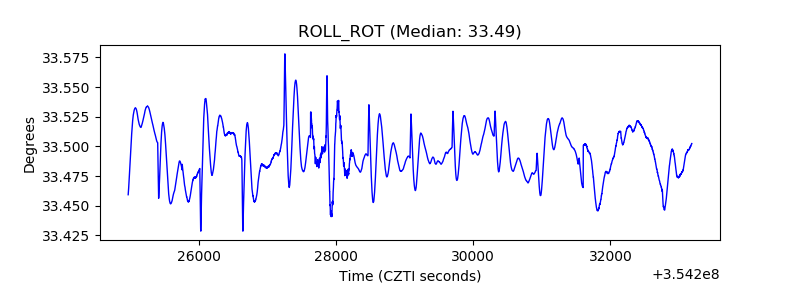 |
| _Roll_DEC | 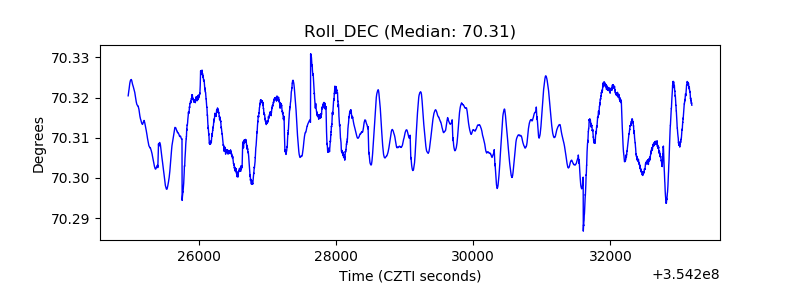 |
| _Roll_RA | 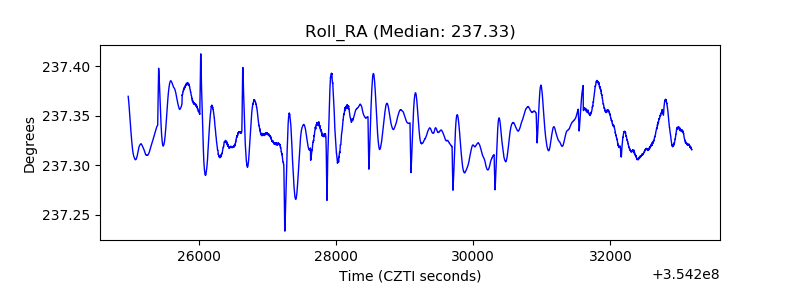 |
| Veto Counter | 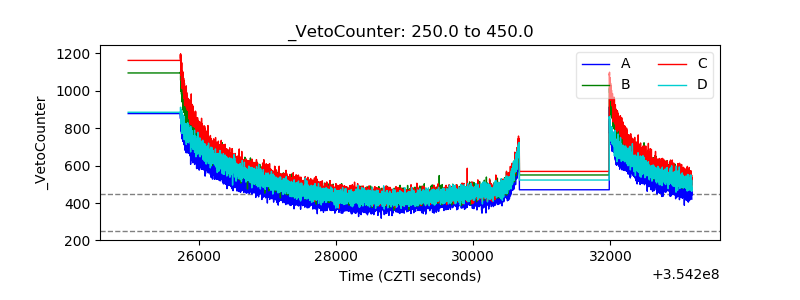 |