| Param | Original file | Final file |
|---|---|---|
| Filename | modeM0/AS1A10_097T02_9000004272cztM0_level2.fits | modeM0/AS1A10_097T02_9000004272cztM0_level2_quad_clean.evt |
| Size (bytes) | 438,261,120 | 315,129,600 |
| Size | 418.0 MB | 300.5 MB |
| Events in quadrant A | 2,768,358 | 1,780,995 |
| Events in quadrant B | 2,652,324 | 1,771,984 |
| Events in quadrant C | 2,658,008 | 1,668,863 |
| Events in quadrant D | 2,191,574 | 1,319,242 |
| Mode M0 | |||
|---|---|---|---|
| Quadrant | BADHDUFLAG | Total packets | Discarded packets |
| A | 0 | 91610 | 0 |
| B | 0 | 96812 | 0 |
| C | 0 | 95931 | 0 |
| D | 0 | 149144 | 0 |
| Mode SS | |||
|---|---|---|---|
| Quadrant | BADHDUFLAG | Total packets | Discarded packets |
| A | 0 | 890 | 0 |
| B | 0 | 890 | 0 |
| C | 0 | 890 | 0 |
| D | 0 | 890 | 0 |
| Mode M9 | |||
|---|---|---|---|
| Quadrant | BADHDUFLAG | Total packets | Discarded packets |
| A | 0 | 93 | 0 |
| B | 0 | 93 | 0 |
| C | 0 | 93 | 0 |
| D | 0 | 93 | 0 |
| Quadrant | Total seconds | Saturated seconds | Saturation percentage |
|---|---|---|---|
| A | 43716 | 485 | 1.109434% |
| B | 43716 | 672 | 1.537195% |
| C | 43716 | 1098 | 2.511666% |
| D | 43716 | 5125 | 11.723396% |
Noise dominated data is calculated using 1-second bins in cleaned event files. If a bin has >2000 counts, and if more than 50% of those come from <1% of pixels, then it is considered to be noise-dominated and hence unusable.
| Quadrant | # 1 sec bins | Bins with >0 counts | Bins with >2000 counts | High rate bins dominated by noise | Noise dominated (total time) | Noise dominated (detector-on time) | Marked lightcurve |
|---|---|---|---|---|---|---|---|
| A | 52921 | 43710 | 0 | 0 | 0.00% | 0.00% | 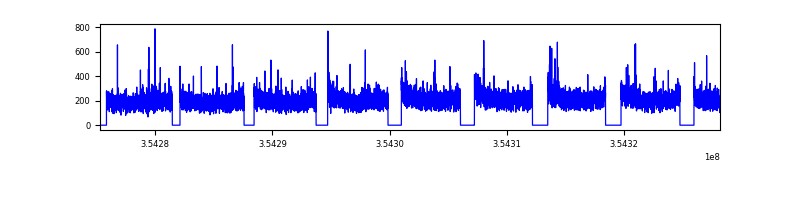 |
| B | 52921 | 43709 | 0 | 0 | 0.00% | 0.00% |  |
| C | 52921 | 43705 | 0 | 0 | 0.00% | 0.00% | 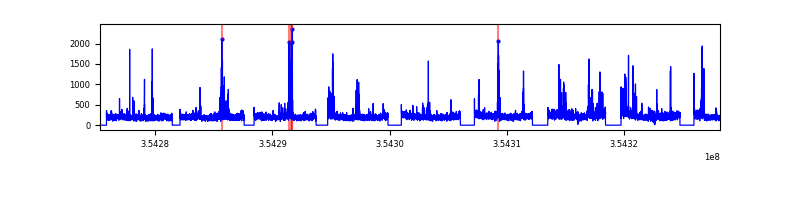 |
| D | 52921 | 43335 | 0 | 0 | 0.00% | 0.00% | 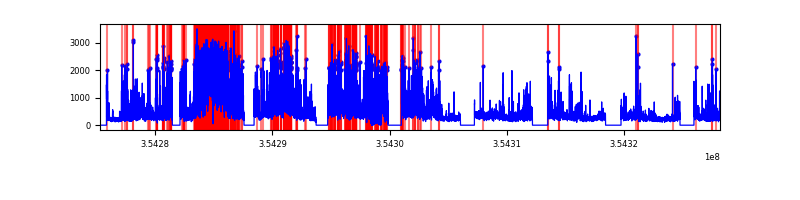 |
Top three noisy pixels from each quadrant. If the there are fewer than three noisy pixels in the level2.evt file, extra rows are filled as -1
| Pixel properties | Quadrant properties | ||||||
|---|---|---|---|---|---|---|---|
| Quadrant | DetID | PixID | Counts | Sigma | Mean | Median | Sigma |
| A | 0 | 29 | 2411 | 9.72 | 720 | 678 | 178.3 |
| A | 7 | 110 | 2201 | 8.54 | 720 | 678 | 178.3 |
| A | 0 | 30 | 2067 | 7.79 | 720 | 678 | 178.3 |
| B | 2 | 9 | 2181 | 10.79 | 700 | 667 | 140.3 |
| B | 2 | 8 | 1752 | 7.73 | 700 | 667 | 140.3 |
| B | 5 | 232 | 1744 | 7.68 | 700 | 667 | 140.3 |
| C | 1 | 81 | 2032 | 7.63 | 702 | 658 | 180.0 |
| C | 1 | 80 | 1976 | 7.32 | 702 | 658 | 180.0 |
| C | 12 | 241 | 1918 | 7.0 | 702 | 658 | 180.0 |
| D | 3 | 14 | 1698 | 6.73 | 625 | 570 | 167.6 |
| D | 15 | 46 | 1616 | 6.24 | 625 | 570 | 167.6 |
| D | 10 | 189 | 1586 | 6.06 | 625 | 570 | 167.6 |
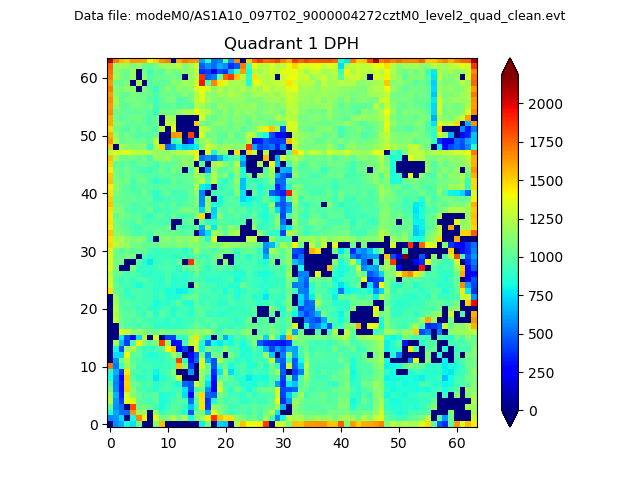
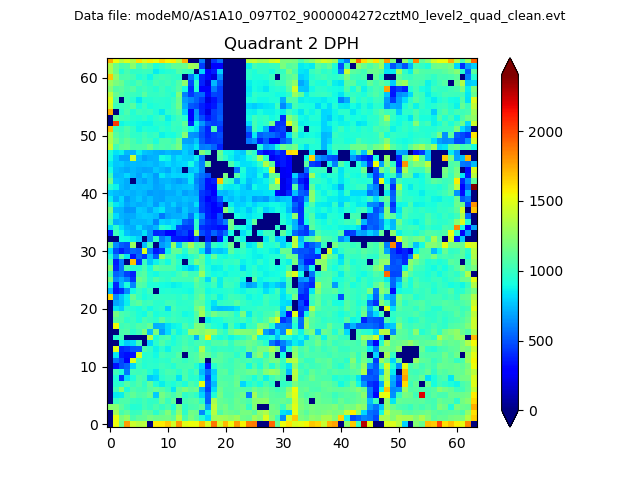
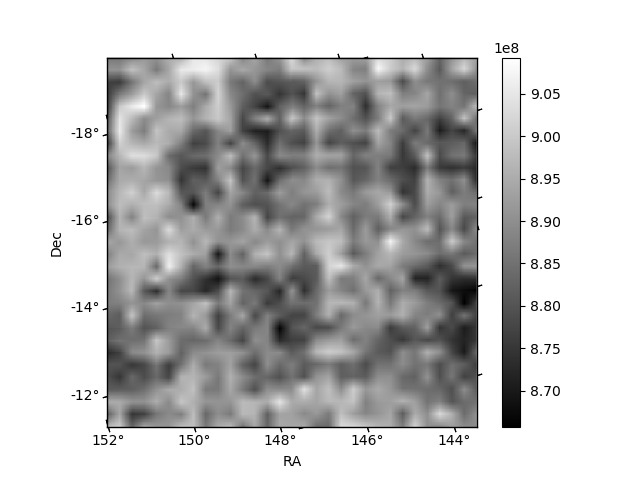
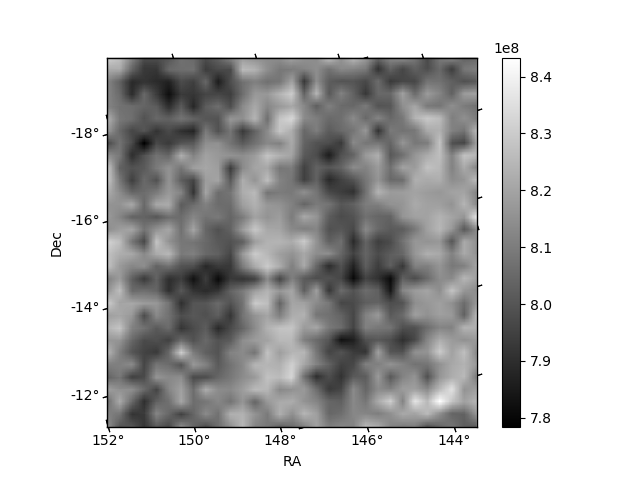
Histogram calculated using DETX and DETY for each event in the final _common_clean file
| Quadrant A | 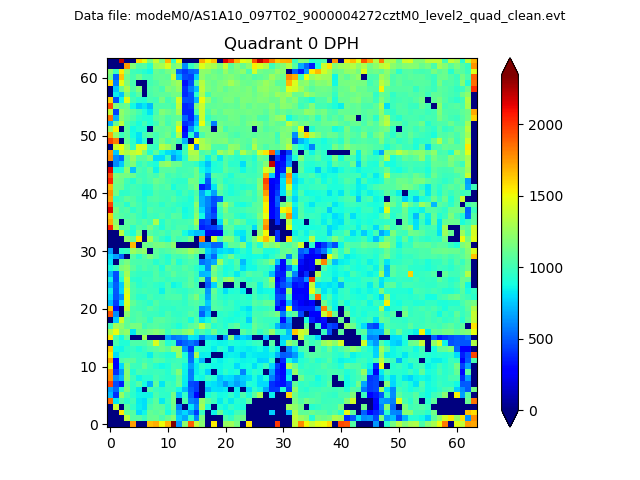 |
 |
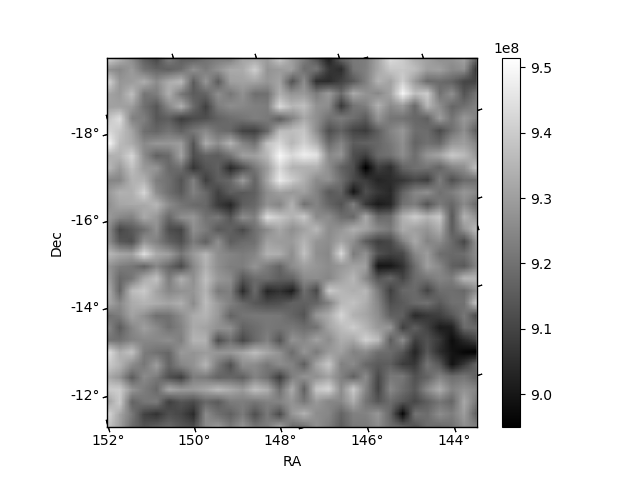
Quadrant B |
|---|---|---|---|
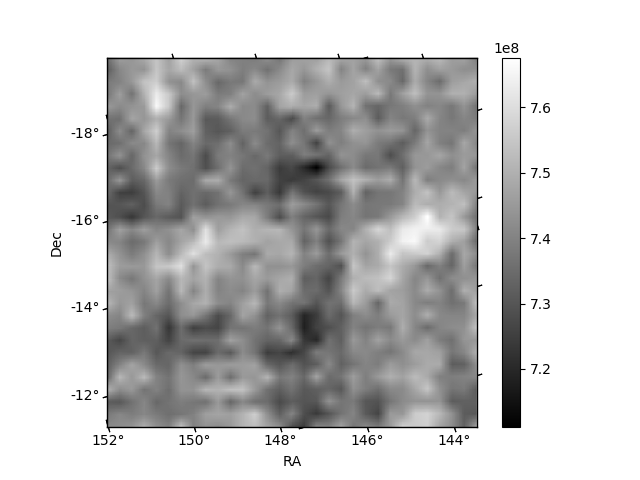
| Quadrant D | 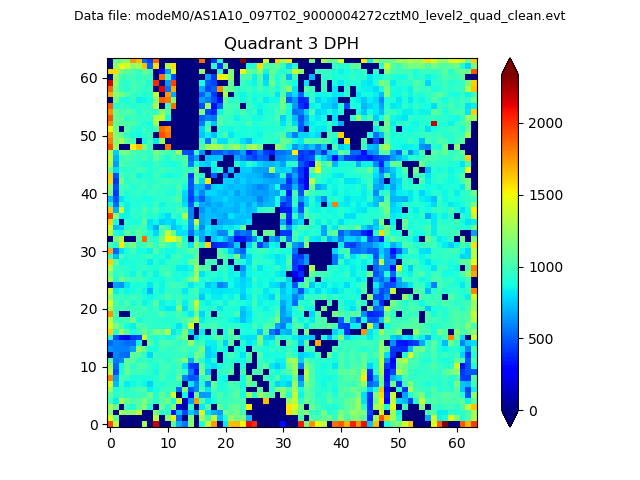 |
 |
Quadrant C |
| Plot type | Count rate plots | Images |
|---|---|---|
| Comparison with Poisson distribution Blue bars denote a histogram of data divided into 1 sec bins. Red curve is a Poisson curve with rate = median count rate of data. |
 |
 |
| Quadrant-wise count rates Data is divided into 100 sec bins |
 |
|
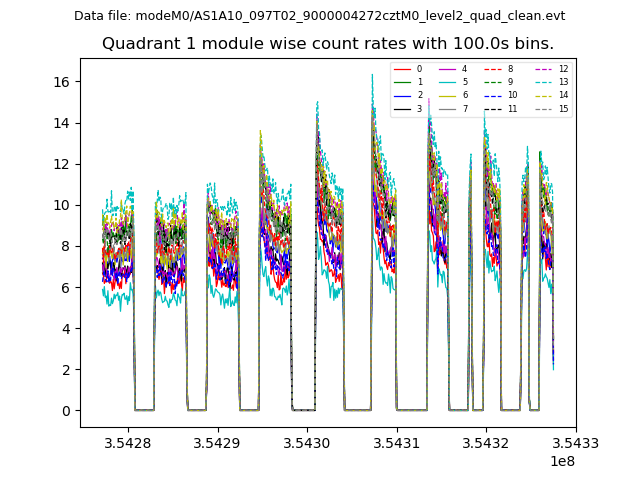
| Module-wise count rates for Quadrant A Data is divided into 100 sec bins |
 |
 |
| Module-wise count rates for Quadrant B Data is divided into 100 sec bins |
 |
 |
| Module-wise count rates for Quadrant C Data is divided into 100 sec bins |
 |
 |
| Module-wise count rates for Quadrant D Data is divided into 100 sec bins |
 |
 |
| Parameter | Plot |
|---|---|
| CZT HV Monitor | 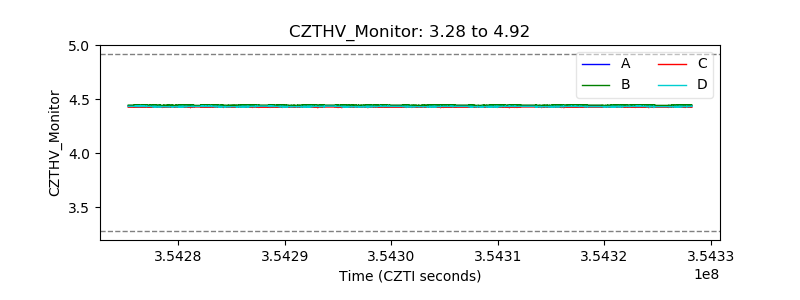 |
| D_VDD | 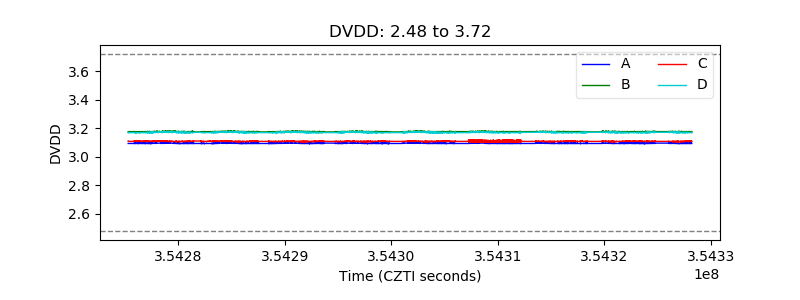 |
| Temperature 1 | 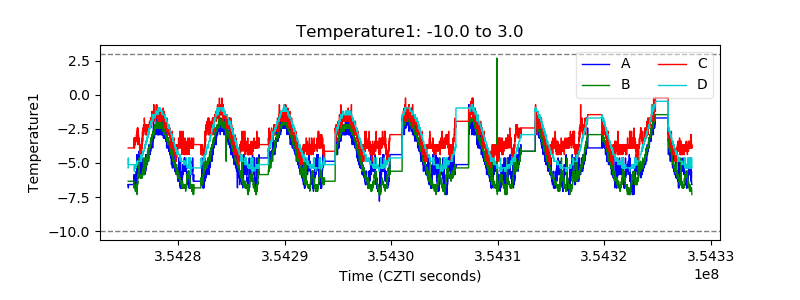 |
| Veto HV Monitor |  |
| Veto LLD |  |
| Alpha Counter |  |
| _CPM_Rate | 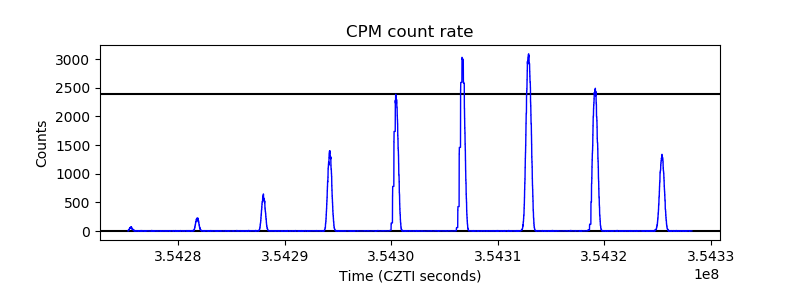 |
| CZT Counter |  |
| +2.5 Volts monitor |  |
| +5 Volts monitor | 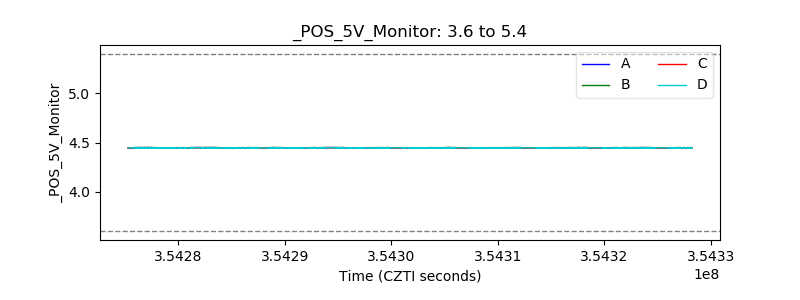 |
| _ROLL_ROT | 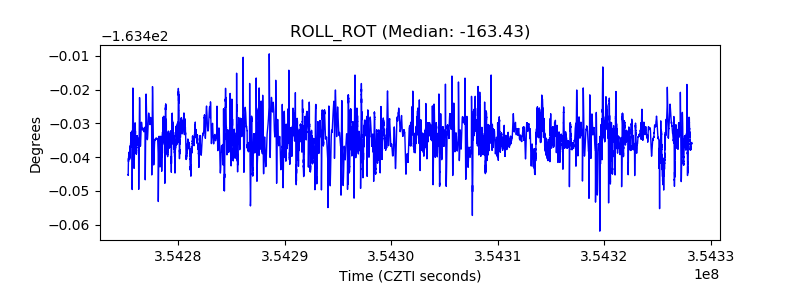 |
| _Roll_DEC | 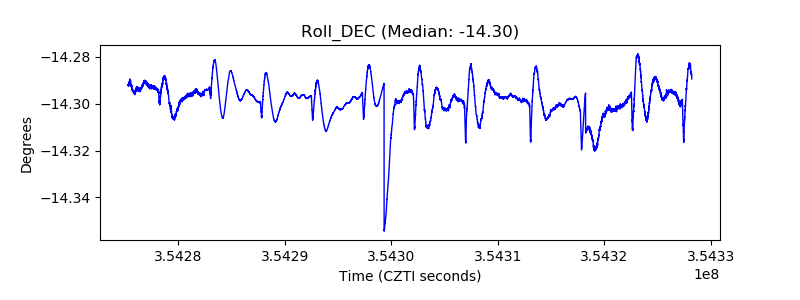 |
| _Roll_RA | 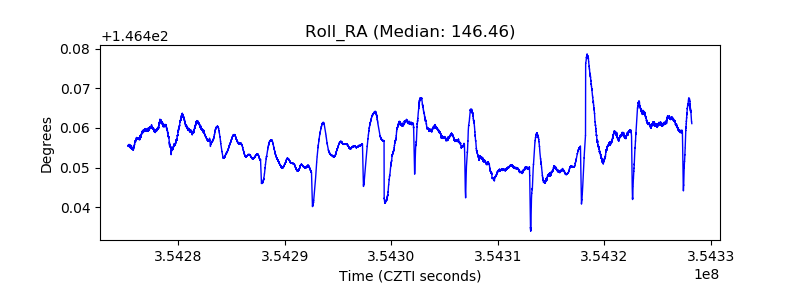 |
| Veto Counter | 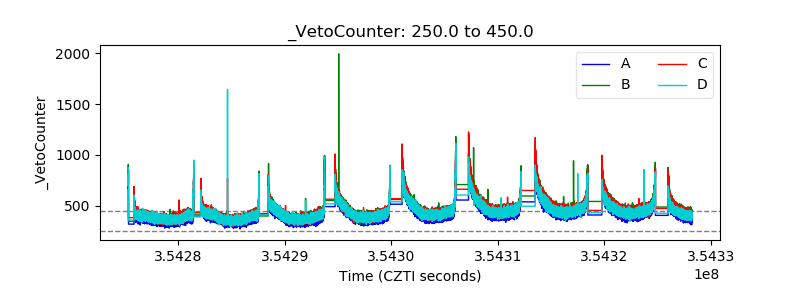 |