| Param | Original file | Final file |
|---|---|---|
| Filename | modeM0/AS1A10_097T02_9000004272_29667cztM0_level2.evt | modeM0/AS1A10_097T02_9000004272_29667cztM0_level2_quad_clean.evt |
| Size (bytes) | 282,280,320 | 52,231,680 |
| Size | 269.2 MB | 49.8 MB |
| Events in quadrant A | 1,863,701 | 328,077 |
| Events in quadrant B | 1,910,228 | 333,432 |
| Events in quadrant C | 1,961,113 | 322,003 |
| Events in quadrant D | 2,537,572 | 312,589 |
| Mode M0 | |||
|---|---|---|---|
| Quadrant | BADHDUFLAG | Total packets | Discarded packets |
| A | 0 | 8189 | 1 |
| B | 0 | 8258 | 1 |
| C | 0 | 8401 | 1 |
| D | 0 | 10066 | 2 |
| Mode SS | |||
|---|---|---|---|
| Quadrant | BADHDUFLAG | Total packets | Discarded packets |
| A | 0 | 82 | 0 |
| B | 0 | 82 | 0 |
| C | 0 | 82 | 0 |
| D | 0 | 82 | 0 |
| Mode M9 | |||
|---|---|---|---|
| Quadrant | BADHDUFLAG | Total packets | Discarded packets |
| A | 0 | 5 | 0 |
| B | 0 | 5 | 0 |
| C | 0 | 5 | 0 |
| D | 0 | 5 | 0 |
| Quadrant | Total seconds | Saturated seconds | Saturation percentage |
|---|---|---|---|
| A | 4048 | 34 | 0.839921% |
| B | 4048 | 39 | 0.963439% |
| C | 4048 | 63 | 1.556324% |
| D | 4047 | 92 | 2.273289% |
Noise dominated data is calculated using 1-second bins in cleaned event files. If a bin has >2000 counts, and if more than 50% of those come from <1% of pixels, then it is considered to be noise-dominated and hence unusable.
| Quadrant | # 1 sec bins | Bins with >0 counts | Bins with >2000 counts | High rate bins dominated by noise | Noise dominated (total time) | Noise dominated (detector-on time) | Marked lightcurve |
|---|---|---|---|---|---|---|---|
| A | 4573 | 4048 | 0 | 0 | 0.00% | 0.00% | 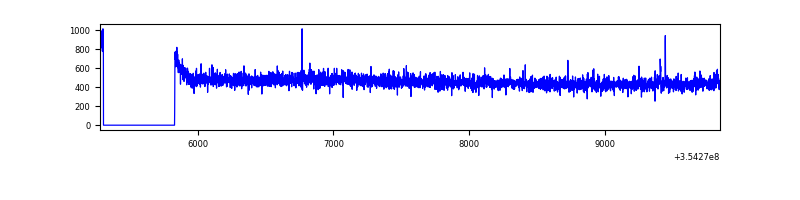 |
| B | 4573 | 4048 | 0 | 0 | 0.00% | 0.00% | 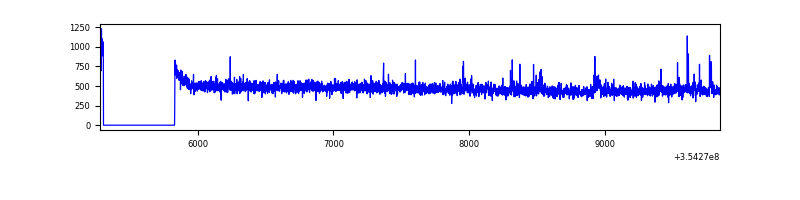 |
| C | 4573 | 4048 | 5 | 5 | 0.11% | 0.12% | 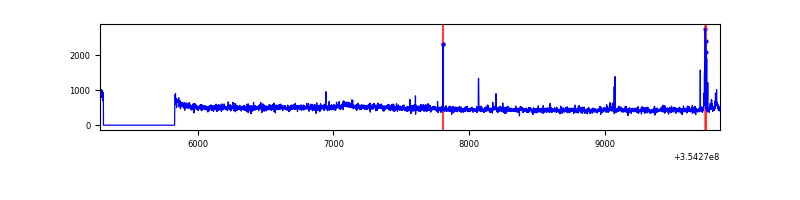 |
| D | 4572 | 4047 | 44 | 44 | 0.96% | 1.09% | 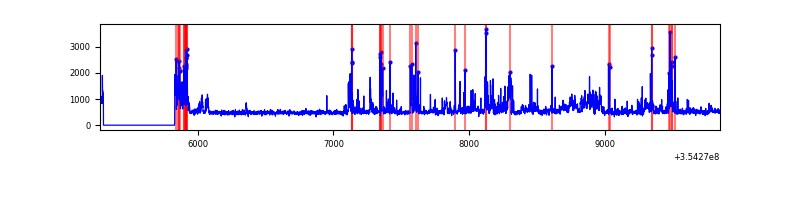 |
Top three noisy pixels from each quadrant. If the there are fewer than three noisy pixels in the level2.evt file, extra rows are filled as -1
| Pixel properties | Quadrant properties | ||||||
|---|---|---|---|---|---|---|---|
| Quadrant | DetID | PixID | Counts | Sigma | Mean | Median | Sigma |
| A | 0 | 13 | 8500 | 81.78 | 481 | 471 | 98.2 |
| A | 13 | 254 | 6986 | 66.36 | 481 | 471 | 98.2 |
| A | 3 | 137 | 4779 | 43.88 | 481 | 471 | 98.2 |
| B | 0 | 190 | 16039 | 167.44 | 475 | 462 | 93.0 |
| B | 0 | 189 | 13107 | 135.92 | 475 | 462 | 93.0 |
| B | 0 | 229 | 12272 | 126.95 | 475 | 462 | 93.0 |
| C | 14 | 238 | 75106 | 682.76 | 459 | 461 | 109.3 |
| C | 3 | 233 | 41082 | 371.55 | 459 | 461 | 109.3 |
| C | 10 | 22 | 30892 | 278.35 | 459 | 461 | 109.3 |
| D | 7 | 80 | 546505 | 4859.22 | 464 | 451 | 112.4 |
| D | 8 | 195 | 171047 | 1518.1 | 464 | 451 | 112.4 |
| D | 2 | 250 | 30706 | 269.23 | 464 | 451 | 112.4 |
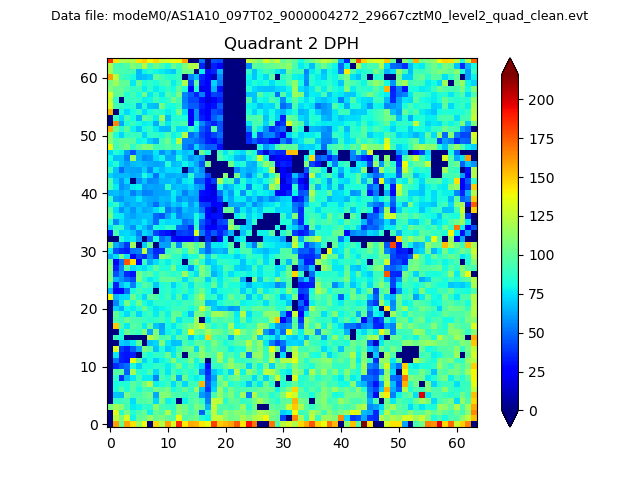
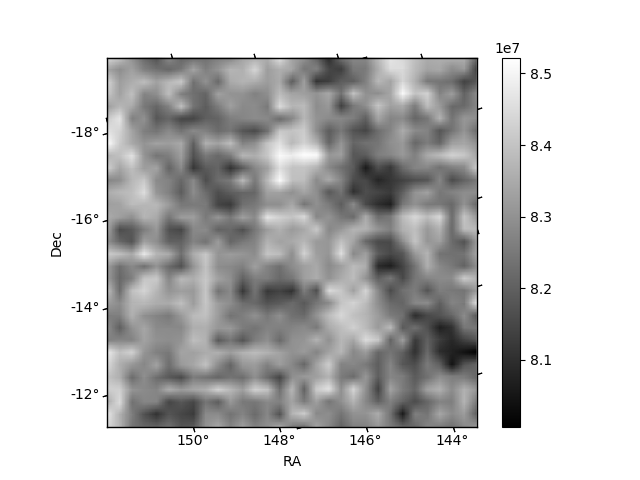
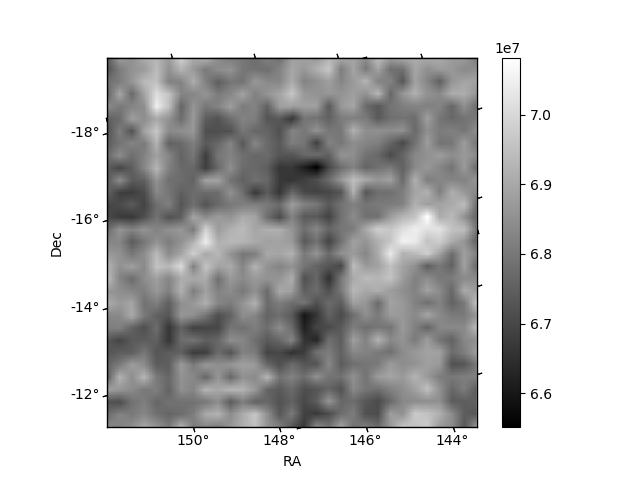
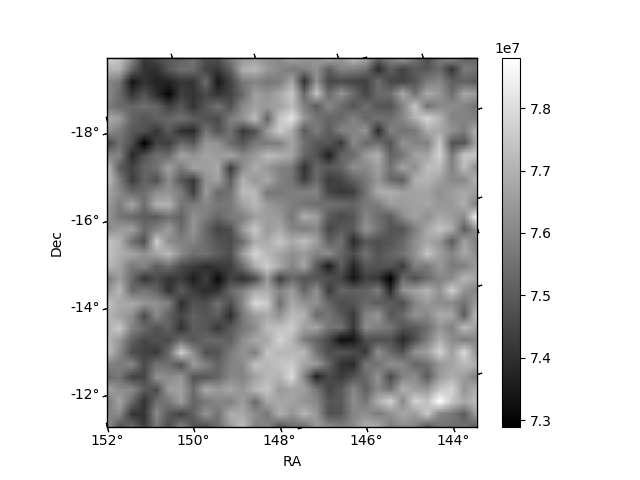
Histogram calculated using DETX and DETY for each event in the final _common_clean file
| Quadrant A | 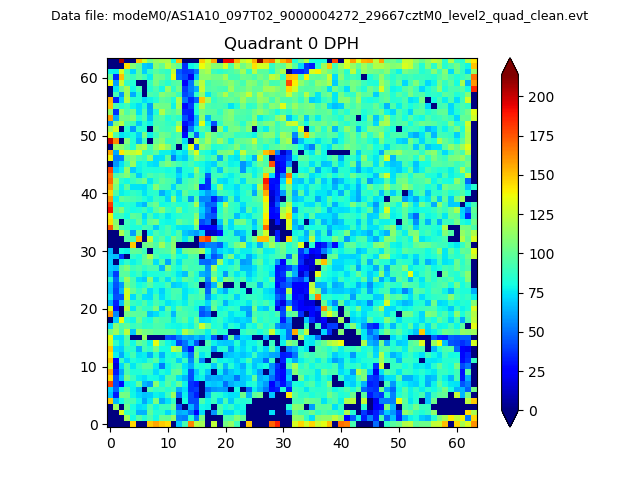 |
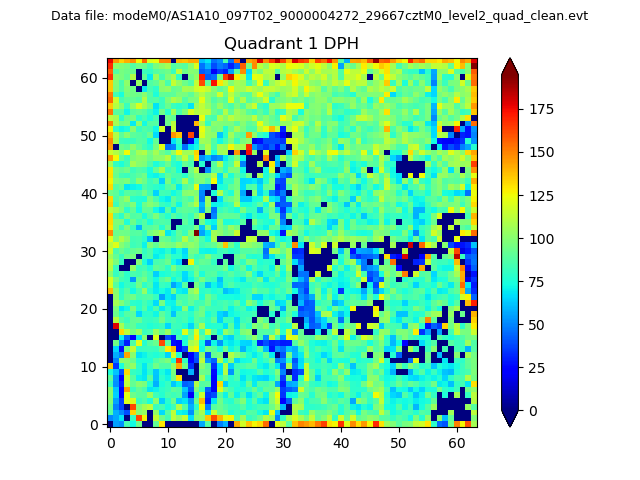 |
Quadrant B |
|---|---|---|---|
| Quadrant D | 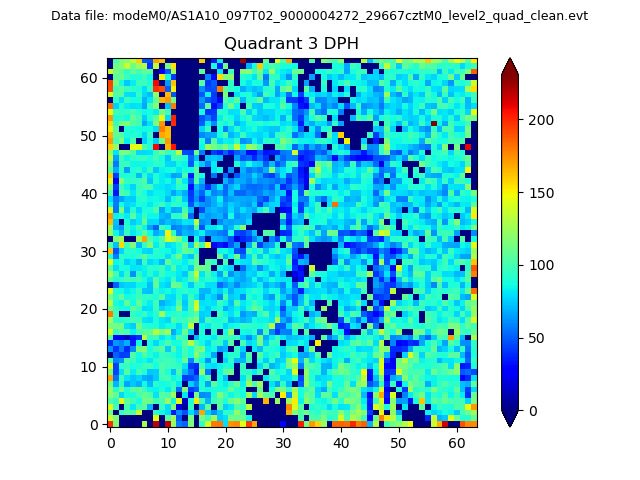 |
 |
Quadrant C |
| Plot type | Count rate plots | Images |
|---|---|---|
| Comparison with Poisson distribution Blue bars denote a histogram of data divided into 1 sec bins. Red curve is a Poisson curve with rate = median count rate of data. |
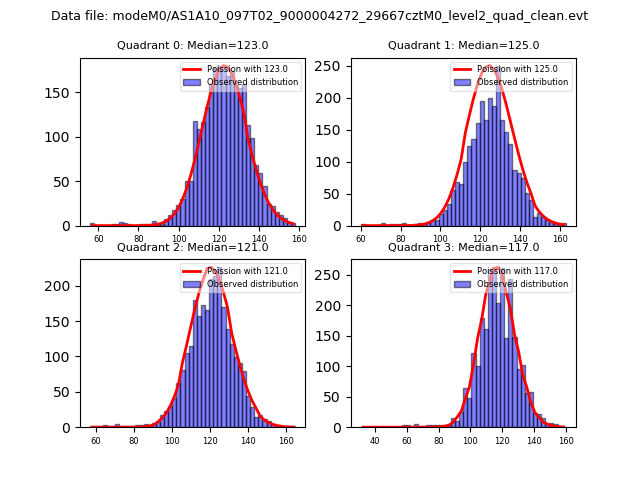 |
 |
| Quadrant-wise count rates Data is divided into 100 sec bins |
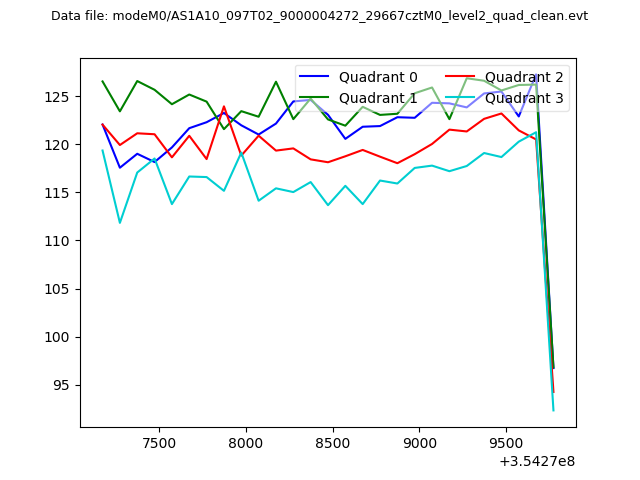 |
|
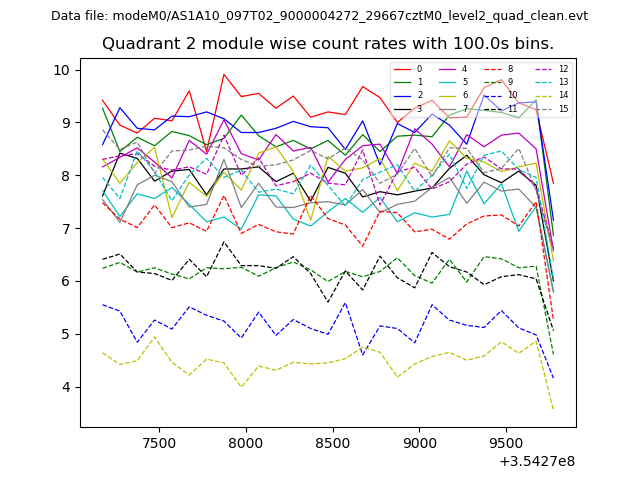
| Module-wise count rates for Quadrant A Data is divided into 100 sec bins |
 |
 |
| Module-wise count rates for Quadrant B Data is divided into 100 sec bins |
 |
 |
| Module-wise count rates for Quadrant C Data is divided into 100 sec bins |
 |
 |
| Module-wise count rates for Quadrant D Data is divided into 100 sec bins |
 |
 |
| Parameter | Plot |
|---|---|
| CZT HV Monitor | 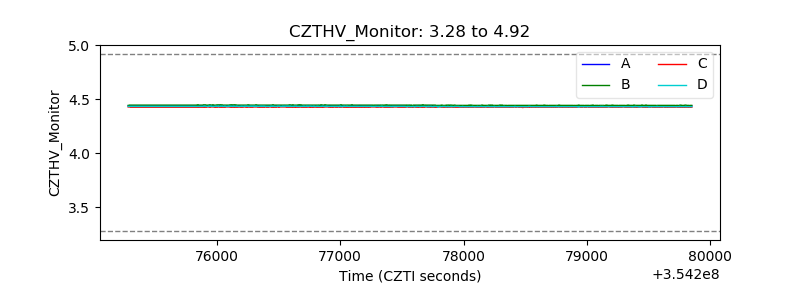 |
| D_VDD | 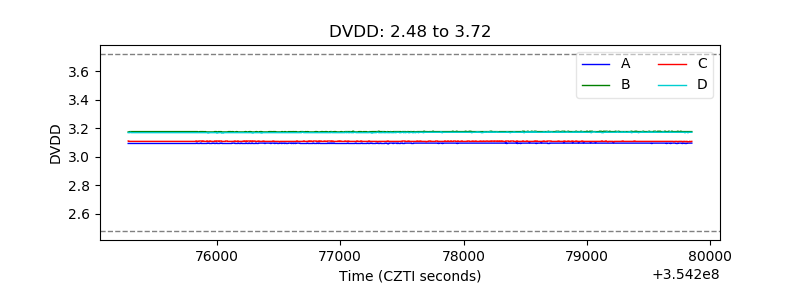 |
| Temperature 1 | 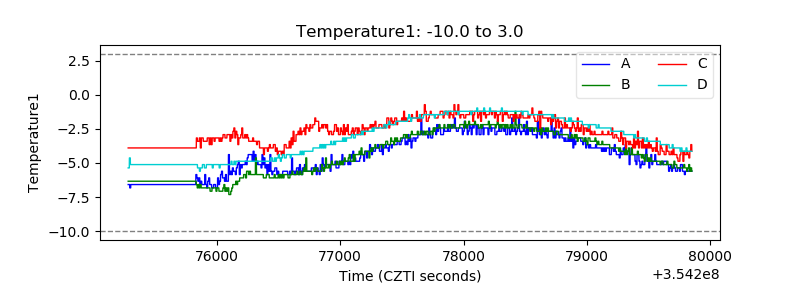 |
| Veto HV Monitor | 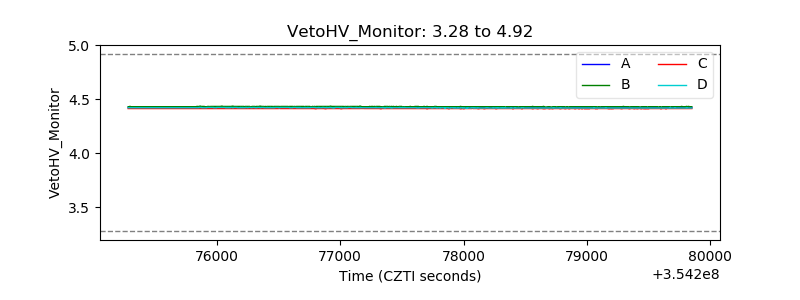 |
| Veto LLD |  |
| Alpha Counter | 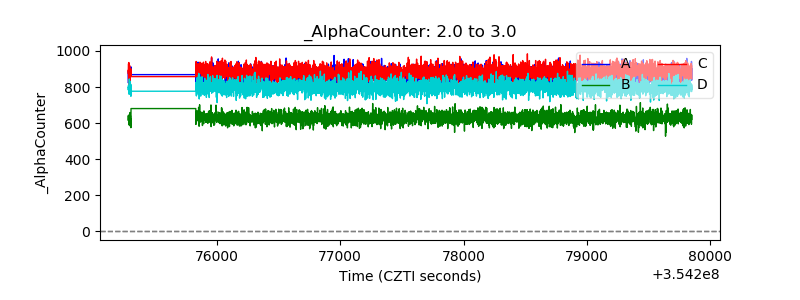 |
| _CPM_Rate | 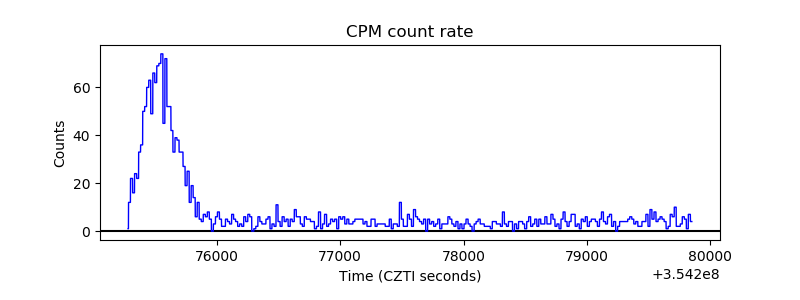 |
| CZT Counter | 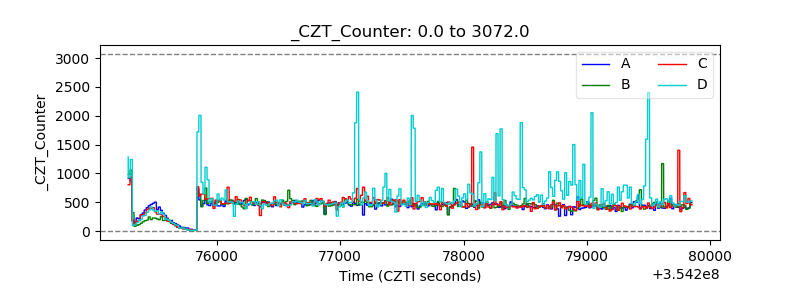 |
| +2.5 Volts monitor |  |
| +5 Volts monitor |  |
| _ROLL_ROT | 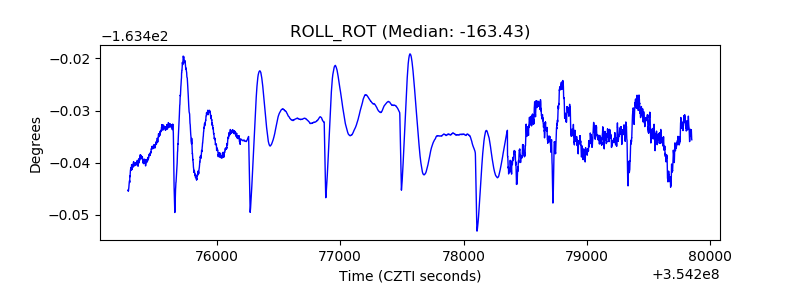 |
| _Roll_DEC | 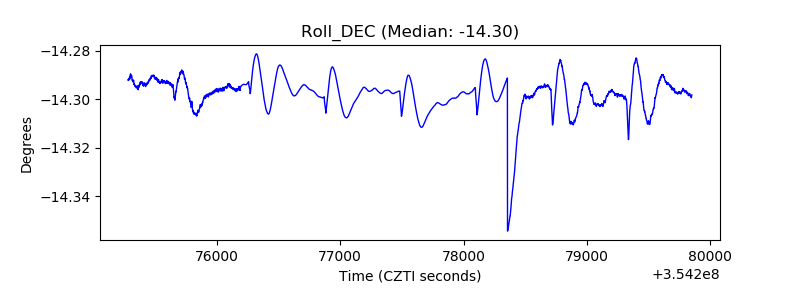 |
| _Roll_RA | 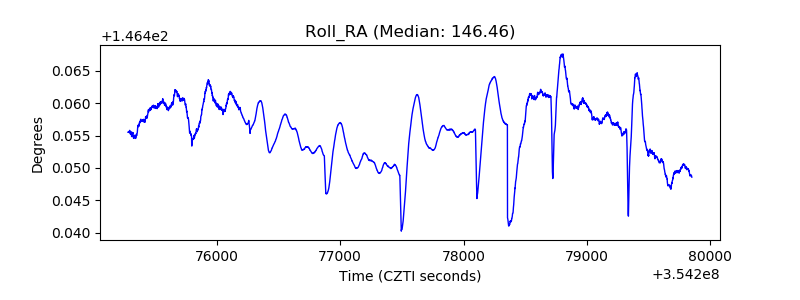 |
| Veto Counter | 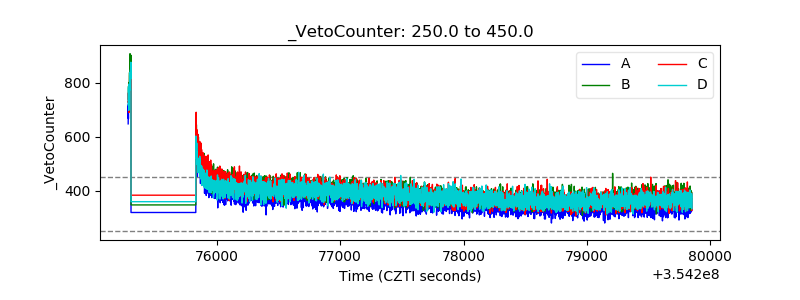 |