| Param | Original file | Final file |
|---|---|---|
| Filename | modeM0/AS1A10_097T02_9000004272_29668cztM0_level2.evt | modeM0/AS1A10_097T02_9000004272_29668cztM0_level2_quad_clean.evt |
| Size (bytes) | 847,581,120 | 108,411,840 |
| Size | 808.3 MB | 103.4 MB |
| Events in quadrant A | 4,157,954 | 717,961 |
| Events in quadrant B | 4,677,496 | 722,597 |
| Events in quadrant C | 4,411,496 | 695,409 |
| Events in quadrant D | 11,838,651 | 547,059 |
| Mode M0 | |||
|---|---|---|---|
| Quadrant | BADHDUFLAG | Total packets | Discarded packets |
| A | 0 | 17793 | 2 |
| B | 0 | 19308 | 2 |
| C | 0 | 18380 | 2 |
| D | 0 | 41126 | 2 |
| Mode SS | |||
|---|---|---|---|
| Quadrant | BADHDUFLAG | Total packets | Discarded packets |
| A | 0 | 174 | 0 |
| B | 0 | 174 | 0 |
| C | 0 | 174 | 0 |
| D | 0 | 174 | 0 |
| Mode M9 | |||
|---|---|---|---|
| Quadrant | BADHDUFLAG | Total packets | Discarded packets |
| A | 0 | 16 | 0 |
| B | 0 | 16 | 0 |
| C | 0 | 16 | 0 |
| D | 0 | 16 | 0 |
| Quadrant | Total seconds | Saturated seconds | Saturation percentage |
|---|---|---|---|
| A | 8639 | 122 | 1.412200% |
| B | 8639 | 173 | 2.002547% |
| C | 8639 | 225 | 2.604468% |
| D | 8639 | 2487 | 28.788054% |
Noise dominated data is calculated using 1-second bins in cleaned event files. If a bin has >2000 counts, and if more than 50% of those come from <1% of pixels, then it is considered to be noise-dominated and hence unusable.
| Quadrant | # 1 sec bins | Bins with >0 counts | Bins with >2000 counts | High rate bins dominated by noise | Noise dominated (total time) | Noise dominated (detector-on time) | Marked lightcurve |
|---|---|---|---|---|---|---|---|
| A | 10159 | 8639 | 0 | 0 | 0.00% | 0.00% | 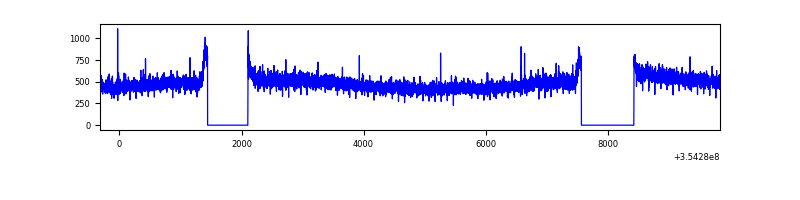 |
| B | 10159 | 8639 | 17 | 17 | 0.17% | 0.20% | 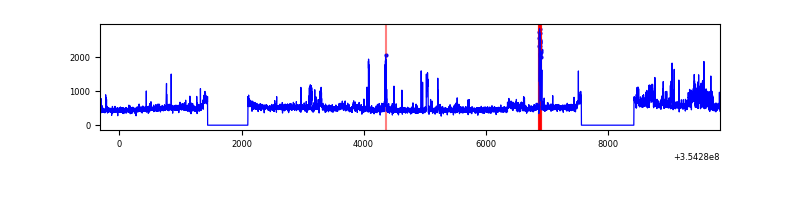 |
| C | 10159 | 8639 | 8 | 8 | 0.08% | 0.09% | 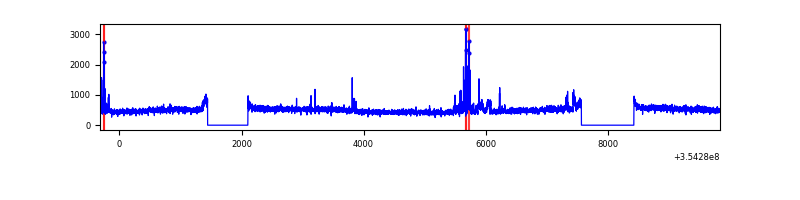 |
| D | 10159 | 8639 | 2337 | 2337 | 23.00% | 27.05% | 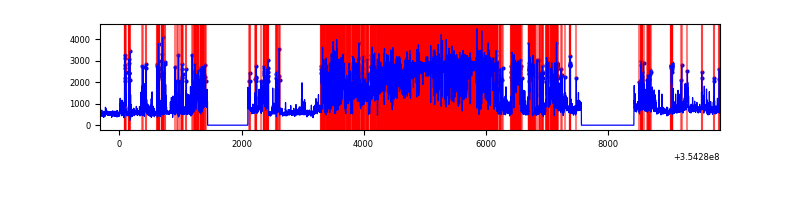 |
Top three noisy pixels from each quadrant. If the there are fewer than three noisy pixels in the level2.evt file, extra rows are filled as -1
| Pixel properties | Quadrant properties | ||||||
|---|---|---|---|---|---|---|---|
| Quadrant | DetID | PixID | Counts | Sigma | Mean | Median | Sigma |
| A | 13 | 254 | 15756 | 67.63 | 1076 | 1051 | 217.4 |
| A | 3 | 137 | 10759 | 44.65 | 1076 | 1051 | 217.4 |
| A | 0 | 226 | 9059 | 36.83 | 1076 | 1051 | 217.4 |
| B | 0 | 229 | 211327 | 1005.29 | 1067 | 1035 | 209.2 |
| B | 0 | 189 | 199475 | 948.64 | 1067 | 1035 | 209.2 |
| B | 0 | 190 | 36279 | 168.48 | 1067 | 1035 | 209.2 |
| C | 14 | 238 | 178436 | 729.96 | 1030 | 1036 | 243.0 |
| C | 10 | 22 | 97597 | 397.32 | 1030 | 1036 | 243.0 |
| C | 3 | 233 | 83656 | 339.96 | 1030 | 1036 | 243.0 |
| D | 7 | 80 | 7442610 | 33185.92 | 929 | 901 | 224.2 |
| D | 8 | 195 | 380935 | 1694.74 | 929 | 901 | 224.2 |
| D | 7 | 238 | 242633 | 1077.99 | 929 | 901 | 224.2 |
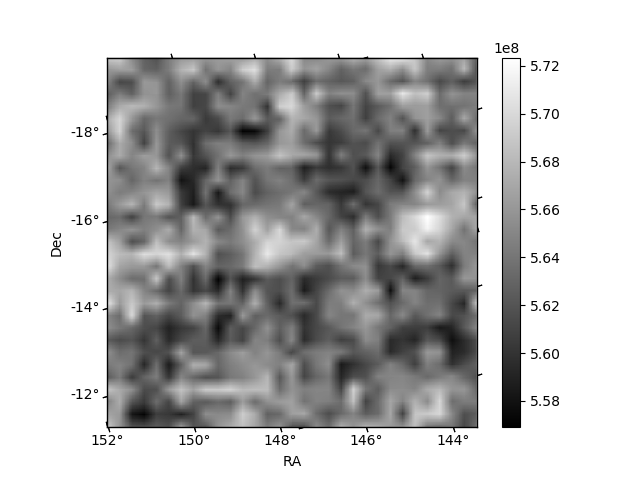
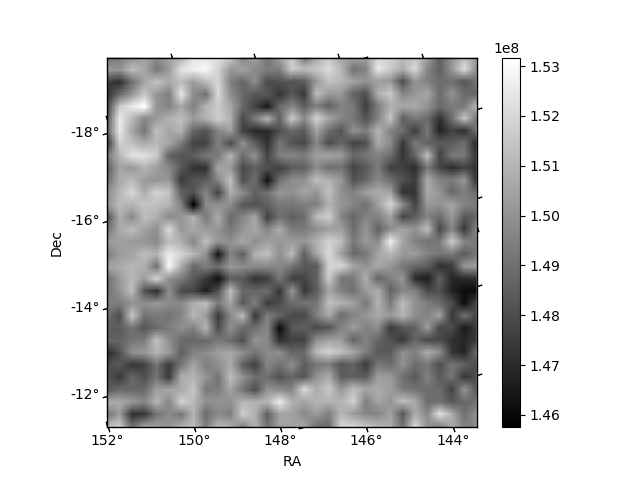
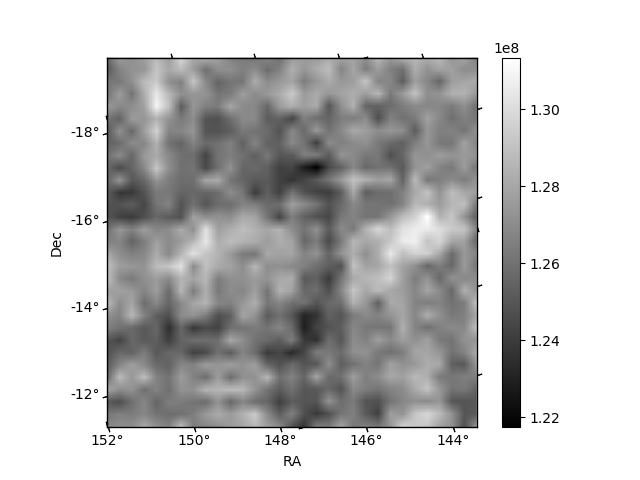
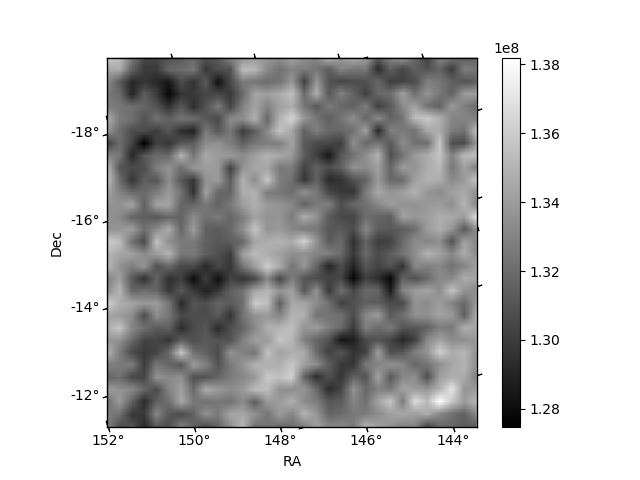
Histogram calculated using DETX and DETY for each event in the final _common_clean file
| Quadrant A | 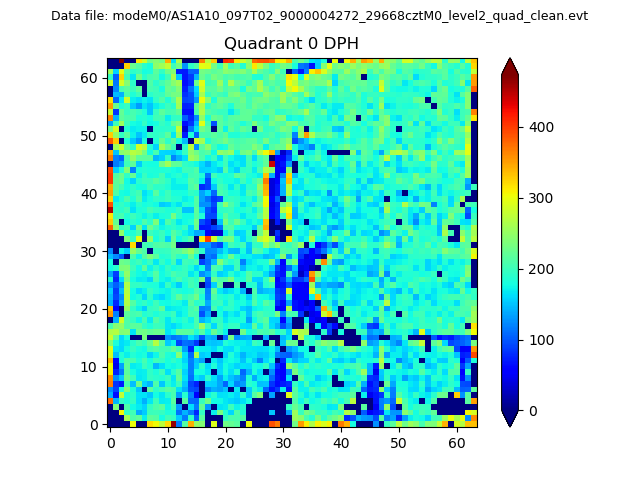 |
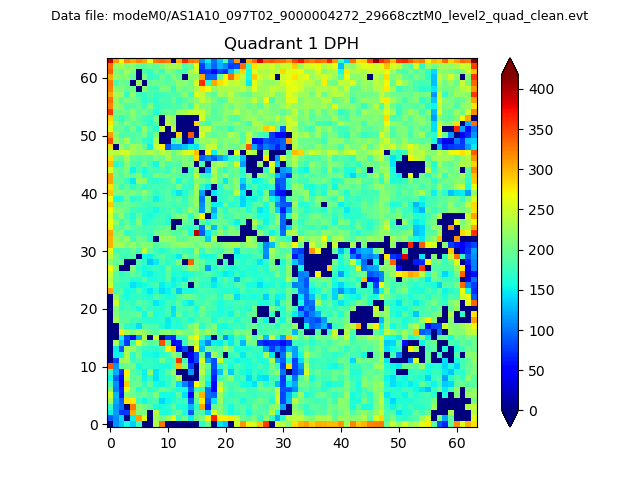 |
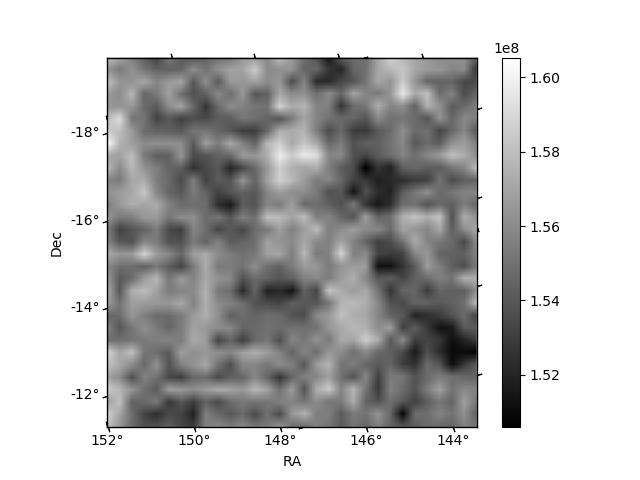
Quadrant B |
|---|---|---|---|
| Quadrant D | 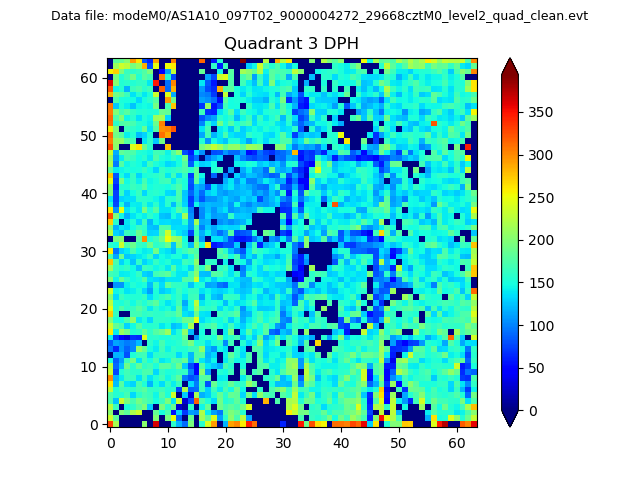 |
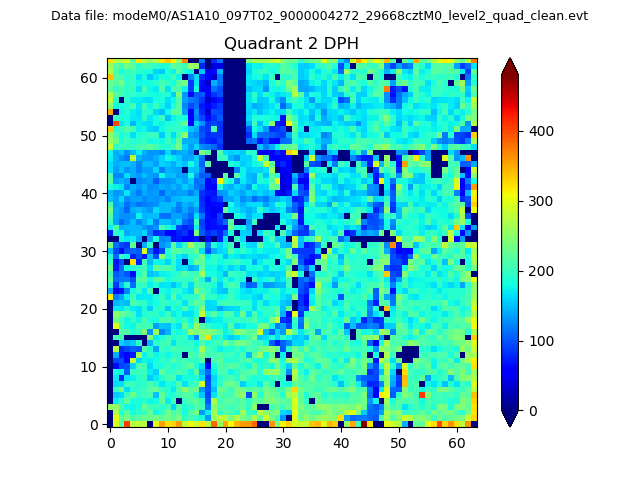 |
Quadrant C |
| Plot type | Count rate plots | Images |
|---|---|---|
| Comparison with Poisson distribution Blue bars denote a histogram of data divided into 1 sec bins. Red curve is a Poisson curve with rate = median count rate of data. |
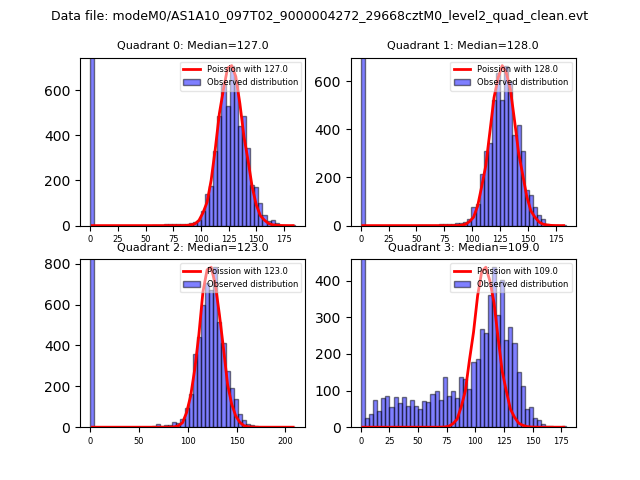 |
 |
| Quadrant-wise count rates Data is divided into 100 sec bins |
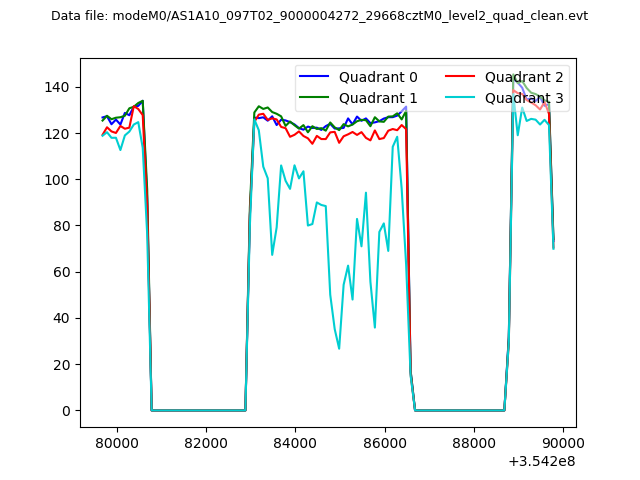 |
|
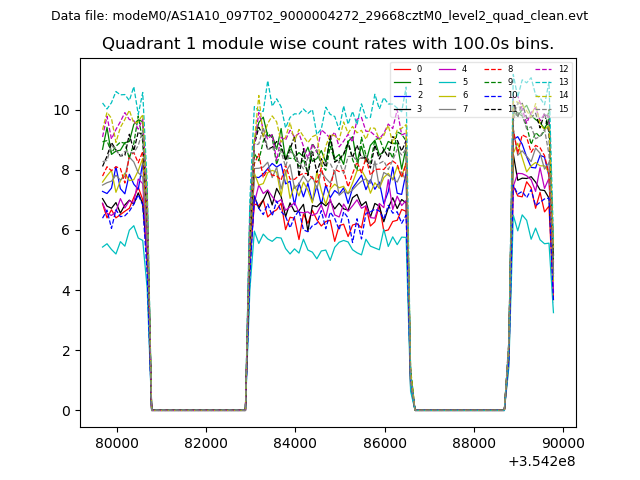
| Module-wise count rates for Quadrant A Data is divided into 100 sec bins |
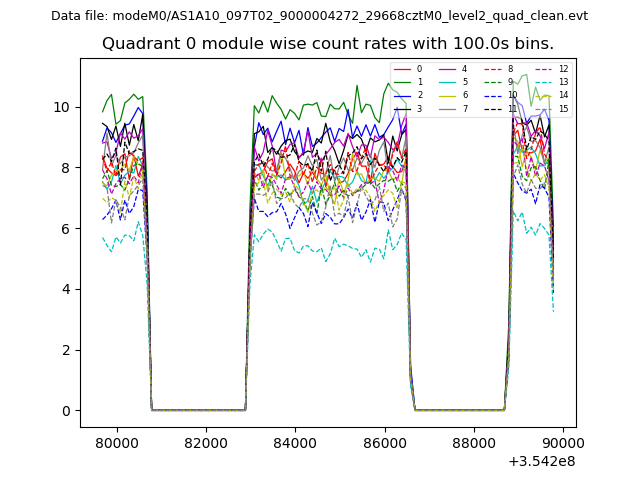 |
 |
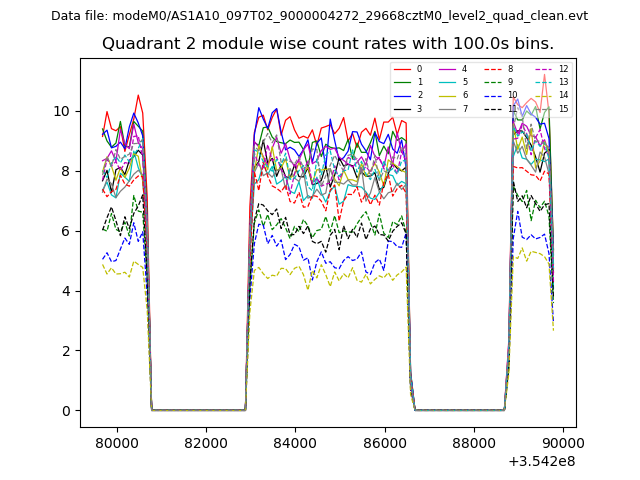
| Module-wise count rates for Quadrant B Data is divided into 100 sec bins |
 |
 |
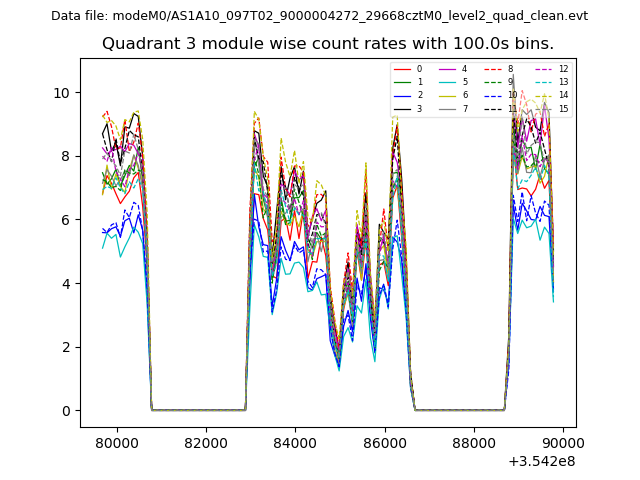
| Module-wise count rates for Quadrant C Data is divided into 100 sec bins |
 |
 |
| Module-wise count rates for Quadrant D Data is divided into 100 sec bins |
 |
 |
| Parameter | Plot |
|---|---|
| CZT HV Monitor | 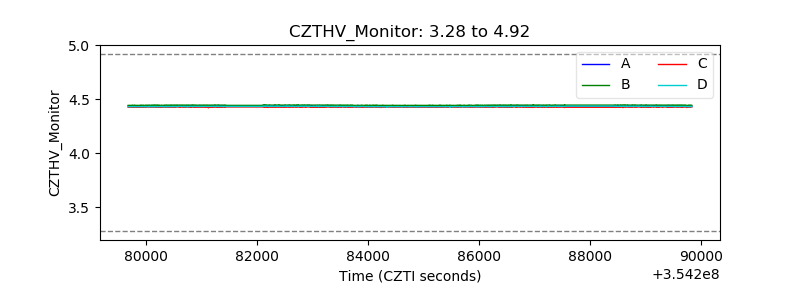 |
| D_VDD | 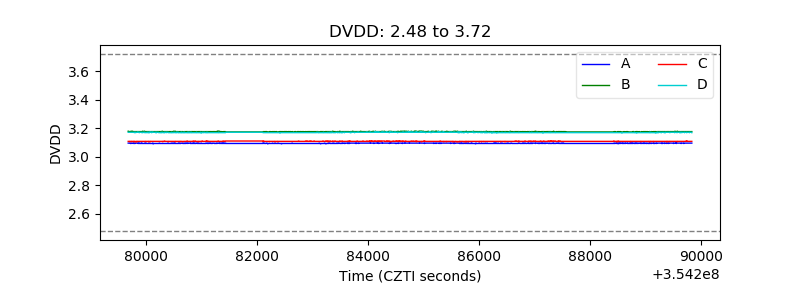 |
| Temperature 1 | 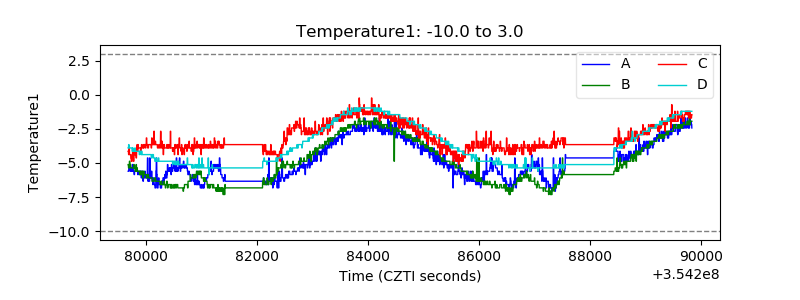 |
| Veto HV Monitor | 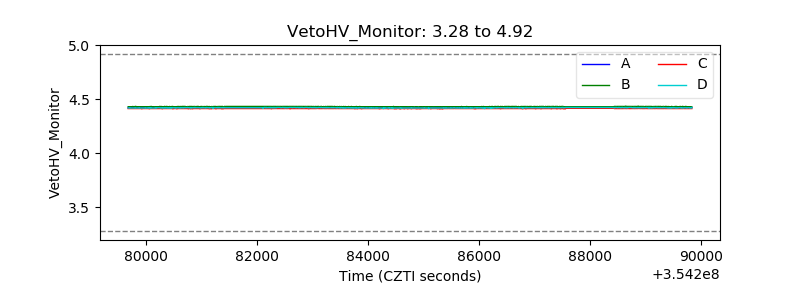 |
| Veto LLD | 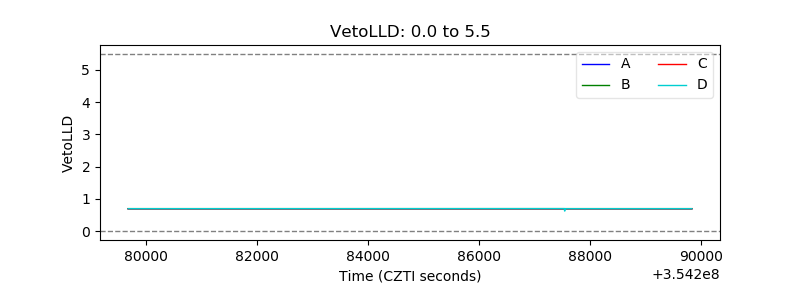 |
| Alpha Counter | 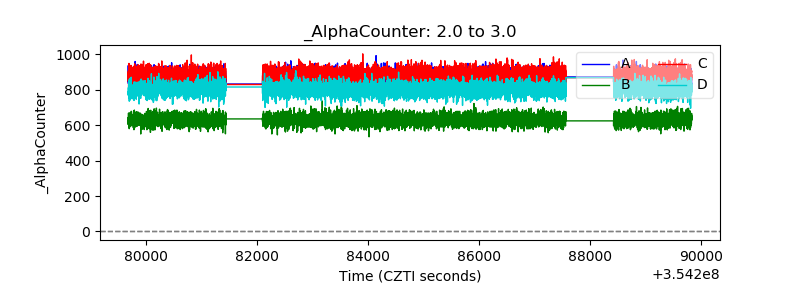 |
| _CPM_Rate | 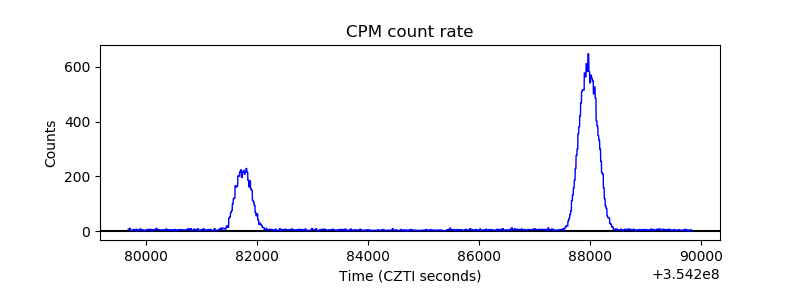 |
| CZT Counter | 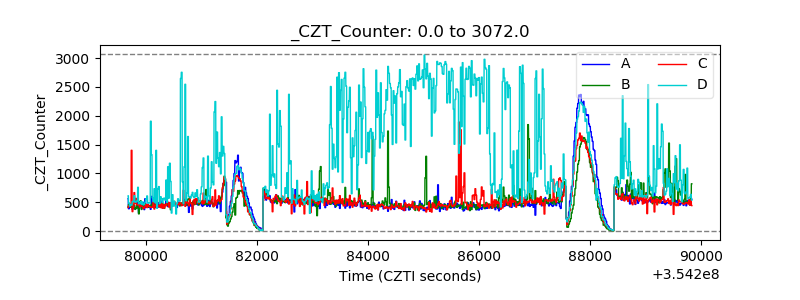 |
| +2.5 Volts monitor |  |
| +5 Volts monitor |  |
| _ROLL_ROT | 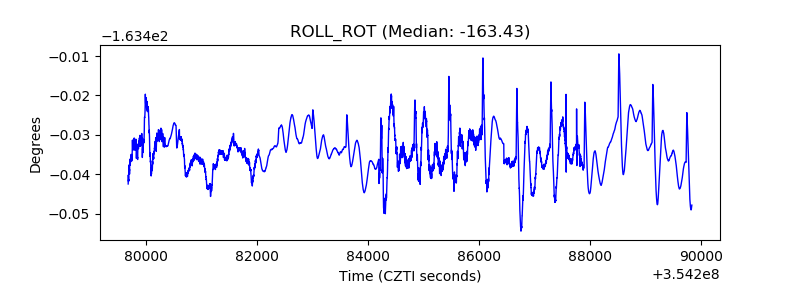 |
| _Roll_DEC | 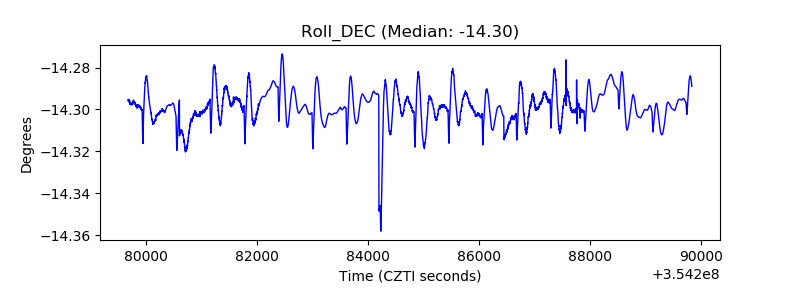 |
| _Roll_RA | 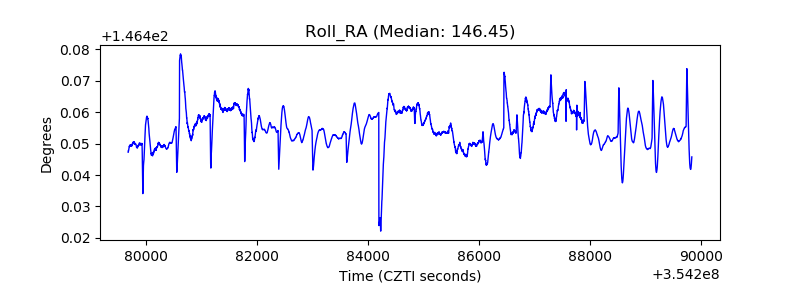 |
| Veto Counter | 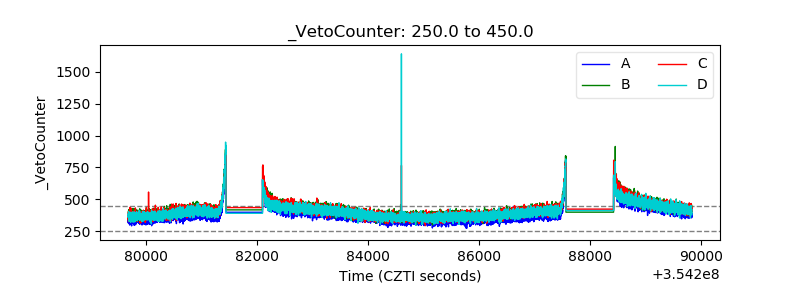 |