| Param | Original file | Final file |
|---|---|---|
| Filename | modeM0/AS1A10_097T02_9000004272_29669cztM0_level2.evt | modeM0/AS1A10_097T02_9000004272_29669cztM0_level2_quad_clean.evt |
| Size (bytes) | 574,035,840 | 101,448,000 |
| Size | 547.4 MB | 96.7 MB |
| Events in quadrant A | 3,127,417 | 679,791 |
| Events in quadrant B | 3,959,635 | 682,361 |
| Events in quadrant C | 3,353,747 | 652,503 |
| Events in quadrant D | 6,512,175 | 612,392 |
| Mode M0 | |||
|---|---|---|---|
| Quadrant | BADHDUFLAG | Total packets | Discarded packets |
| A | 0 | 13400 | 1 |
| B | 0 | 15826 | 1 |
| C | 0 | 14024 | 1 |
| D | 0 | 23958 | 1 |
| Mode SS | |||
|---|---|---|---|
| Quadrant | BADHDUFLAG | Total packets | Discarded packets |
| A | 0 | 130 | 0 |
| B | 0 | 130 | 0 |
| C | 0 | 130 | 0 |
| D | 0 | 130 | 0 |
| Mode M9 | |||
|---|---|---|---|
| Quadrant | BADHDUFLAG | Total packets | Discarded packets |
| A | 0 | 10 | 0 |
| B | 0 | 10 | 0 |
| C | 0 | 10 | 0 |
| D | 0 | 10 | 0 |
| Quadrant | Total seconds | Saturated seconds | Saturation percentage |
|---|---|---|---|
| A | 6379 | 68 | 1.065998% |
| B | 6380 | 84 | 1.316614% |
| C | 6380 | 131 | 2.053292% |
| D | 6380 | 432 | 6.771160% |
Noise dominated data is calculated using 1-second bins in cleaned event files. If a bin has >2000 counts, and if more than 50% of those come from <1% of pixels, then it is considered to be noise-dominated and hence unusable.
| Quadrant | # 1 sec bins | Bins with >0 counts | Bins with >2000 counts | High rate bins dominated by noise | Noise dominated (total time) | Noise dominated (detector-on time) | Marked lightcurve |
|---|---|---|---|---|---|---|---|
| A | 7369 | 6379 | 0 | 0 | 0.00% | 0.00% | 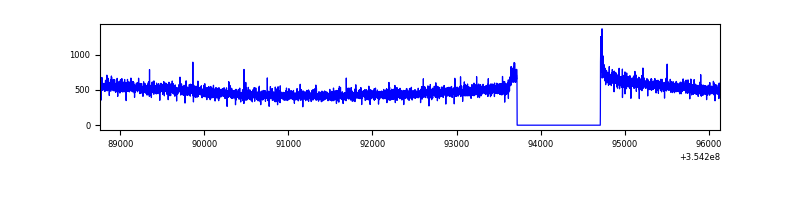 |
| B | 7370 | 6380 | 3 | 3 | 0.04% | 0.05% | 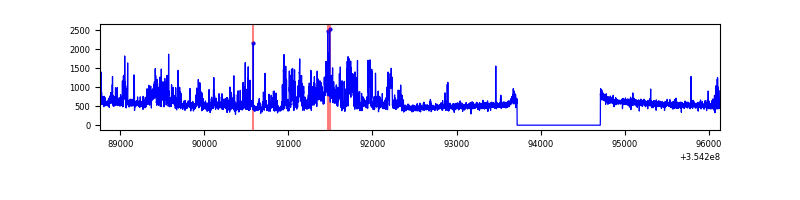 |
| C | 7370 | 6380 | 27 | 27 | 0.37% | 0.42% | 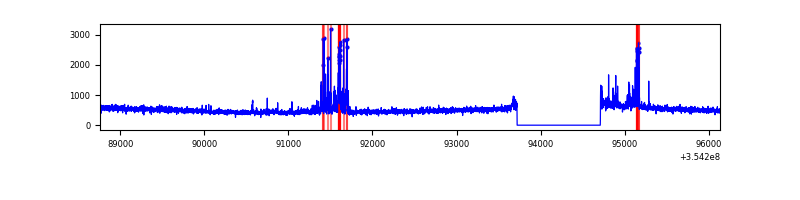 |
| D | 7370 | 6380 | 410 | 410 | 5.56% | 6.43% | 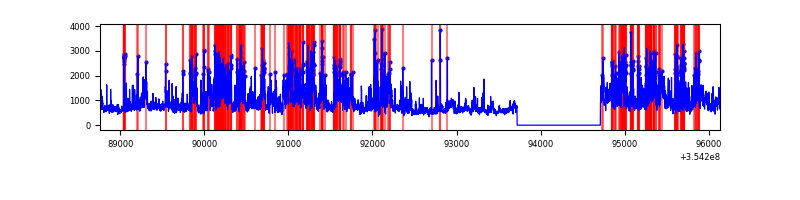 |
Top three noisy pixels from each quadrant. If the there are fewer than three noisy pixels in the level2.evt file, extra rows are filled as -1
| Pixel properties | Quadrant properties | ||||||
|---|---|---|---|---|---|---|---|
| Quadrant | DetID | PixID | Counts | Sigma | Mean | Median | Sigma |
| A | 13 | 254 | 10891 | 61.81 | 809 | 794 | 163.3 |
| A | 0 | 13 | 9255 | 51.8 | 809 | 794 | 163.3 |
| A | 3 | 137 | 7991 | 44.06 | 809 | 794 | 163.3 |
| B | 0 | 189 | 739826 | 4808.5 | 794 | 772 | 153.7 |
| B | 0 | 229 | 73570 | 473.65 | 794 | 772 | 153.7 |
| B | 12 | 111 | 19071 | 119.06 | 794 | 772 | 153.7 |
| C | 10 | 22 | 196082 | 1089.39 | 761 | 766 | 179.3 |
| C | 14 | 238 | 124638 | 690.91 | 761 | 766 | 179.3 |
| C | 3 | 233 | 39544 | 216.29 | 761 | 766 | 179.3 |
| D | 7 | 80 | 2768887 | 15225.74 | 762 | 741 | 181.8 |
| D | 8 | 195 | 492909 | 2707.09 | 762 | 741 | 181.8 |
| D | 7 | 238 | 191518 | 1049.34 | 762 | 741 | 181.8 |
Histogram calculated using DETX and DETY for each event in the final _common_clean file
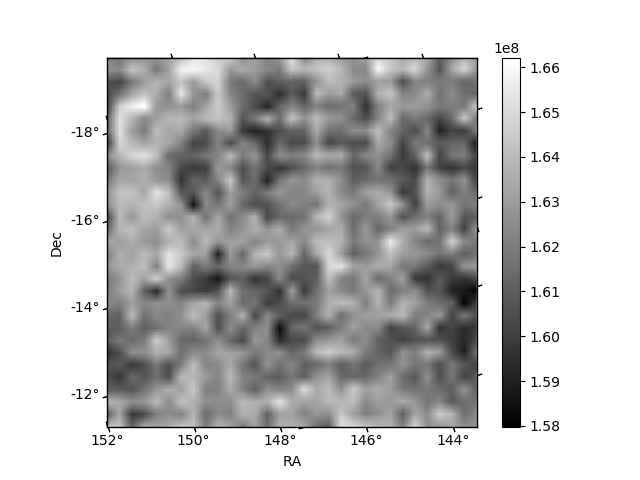
| Quadrant A | 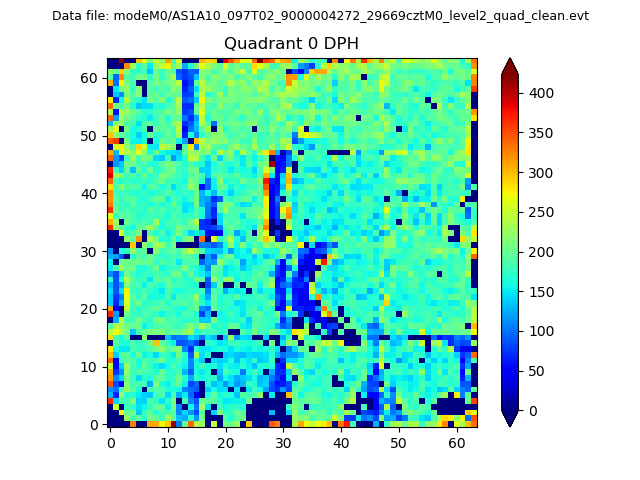 |
 |
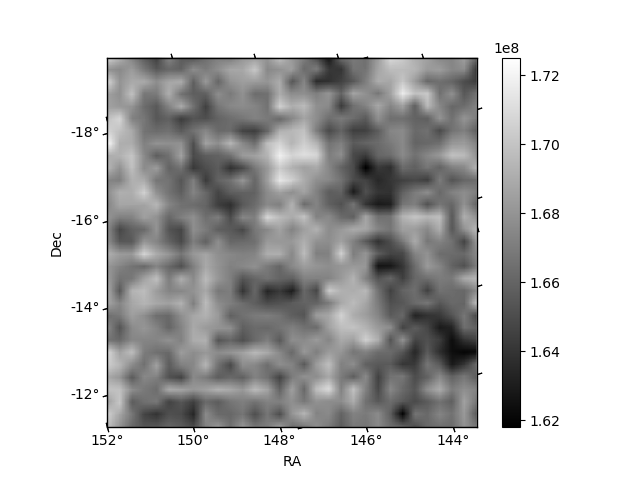
Quadrant B |
|---|---|---|---|
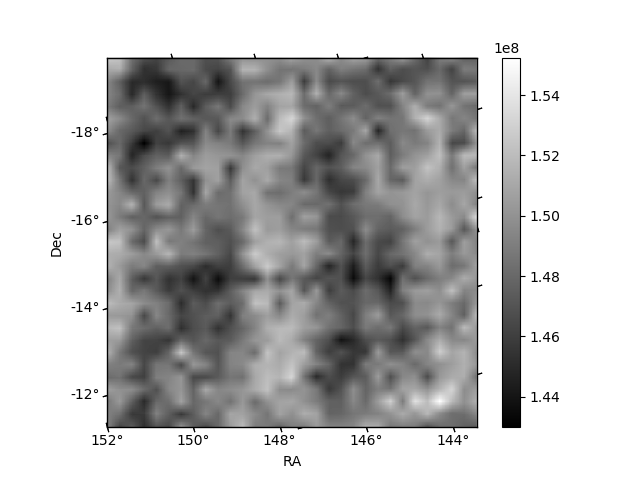
| Quadrant D | 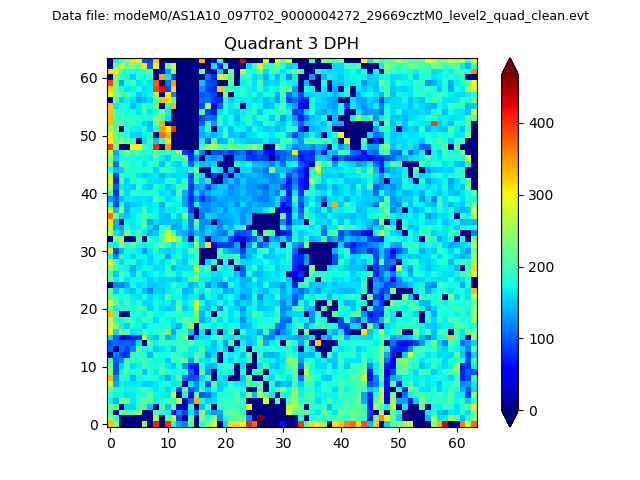 |
 |
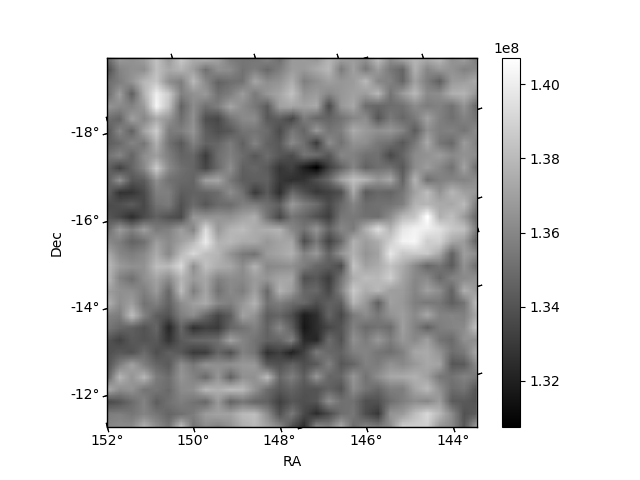
Quadrant C |
| Plot type | Count rate plots | Images |
|---|---|---|
| Comparison with Poisson distribution Blue bars denote a histogram of data divided into 1 sec bins. Red curve is a Poisson curve with rate = median count rate of data. |
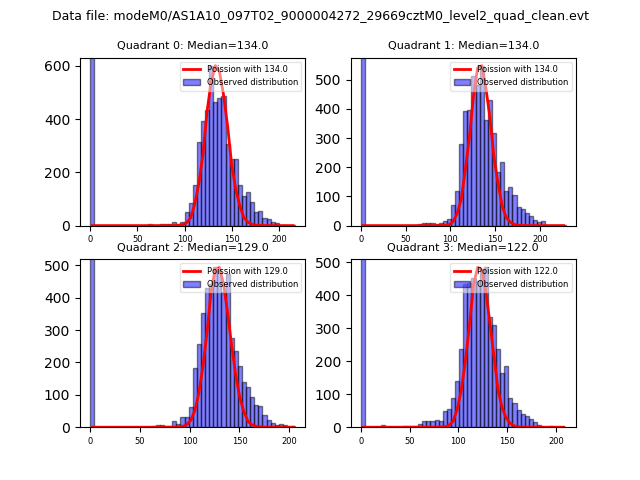 |
 |
| Quadrant-wise count rates Data is divided into 100 sec bins |
 |
|
| Module-wise count rates for Quadrant A Data is divided into 100 sec bins |
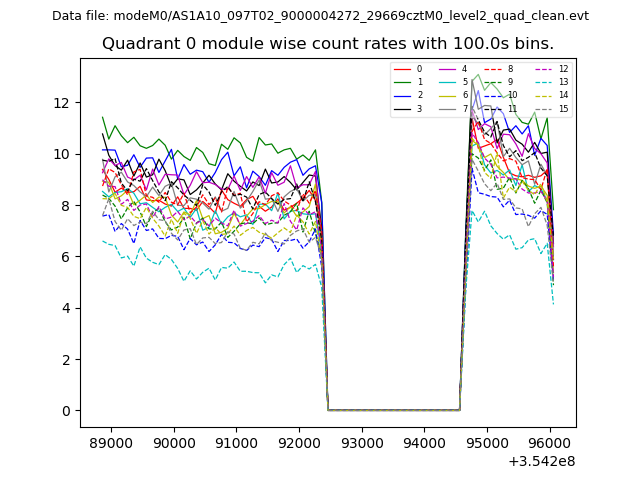 |
 |
| Module-wise count rates for Quadrant B Data is divided into 100 sec bins |
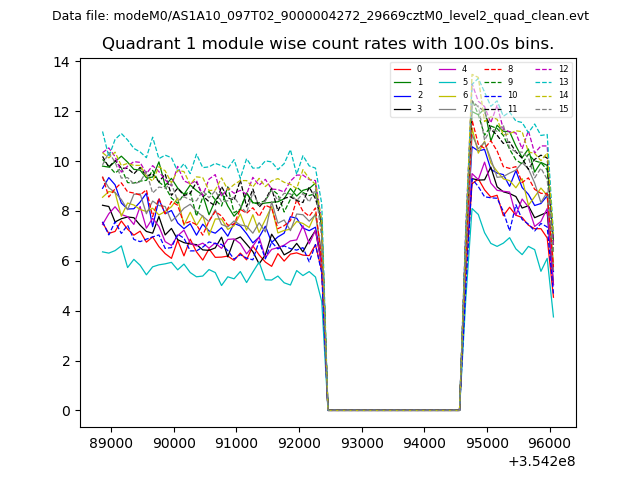 |
 |
| Module-wise count rates for Quadrant C Data is divided into 100 sec bins |
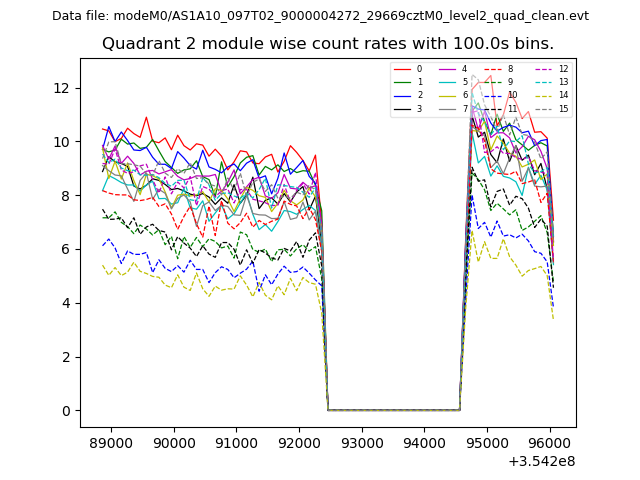 |
 |
| Module-wise count rates for Quadrant D Data is divided into 100 sec bins |
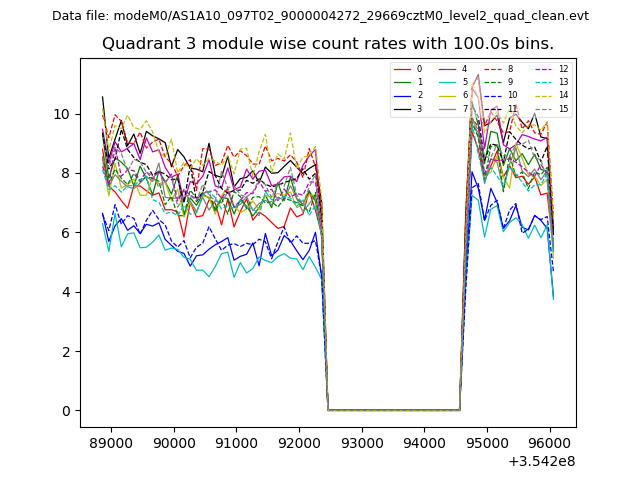 |
 |
| Parameter | Plot |
|---|---|
| CZT HV Monitor | 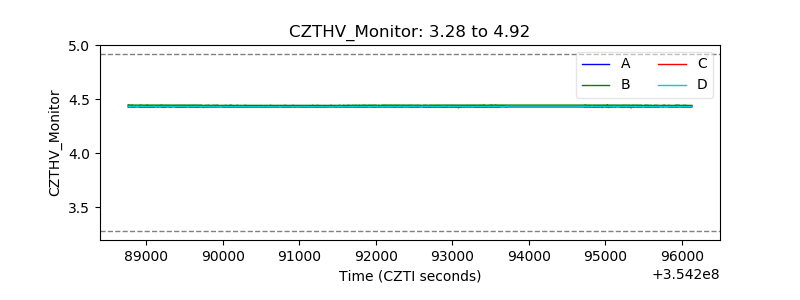 |
| D_VDD | 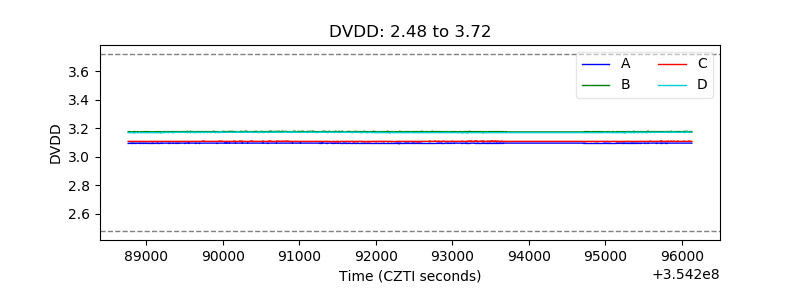 |
| Temperature 1 | 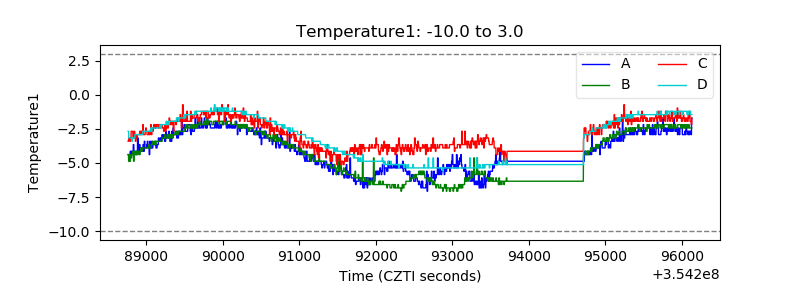 |
| Veto HV Monitor | 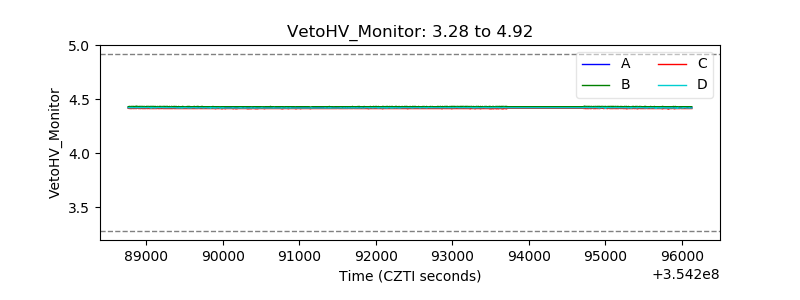 |
| Veto LLD | 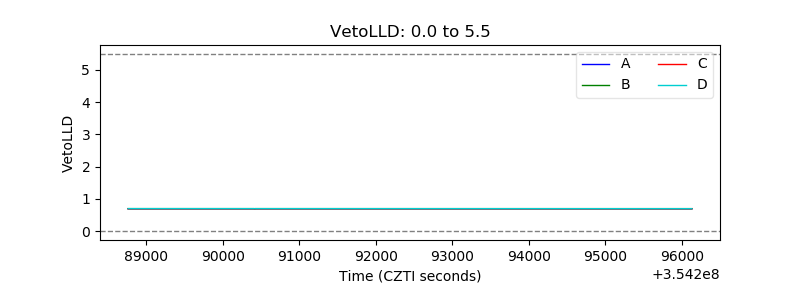 |
| Alpha Counter | 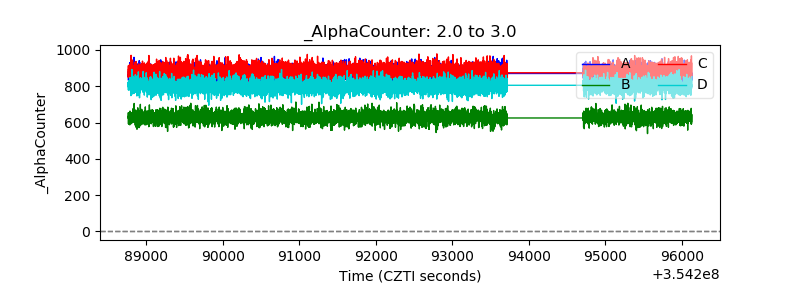 |
| _CPM_Rate | 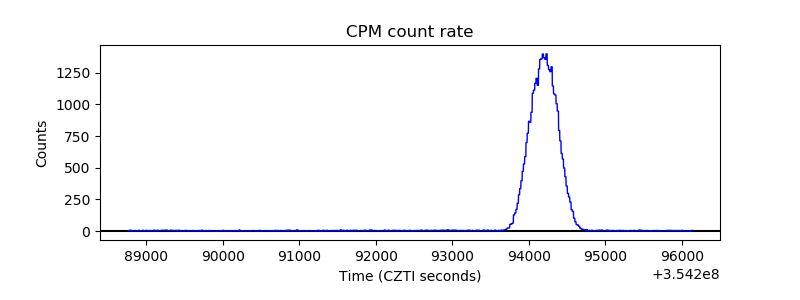 |
| CZT Counter | 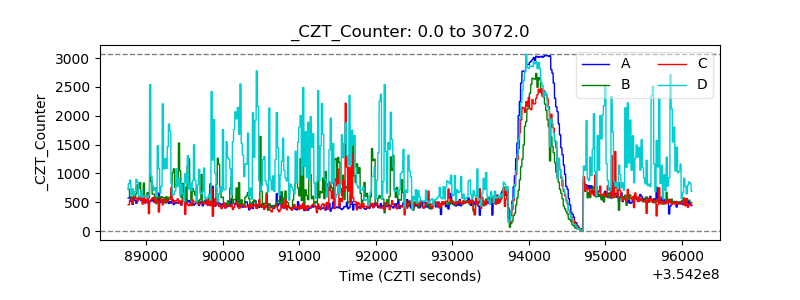 |
| +2.5 Volts monitor |  |
| +5 Volts monitor |  |
| _ROLL_ROT | 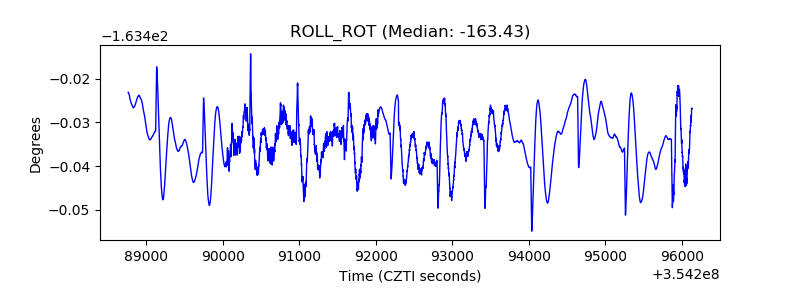 |
| _Roll_DEC | 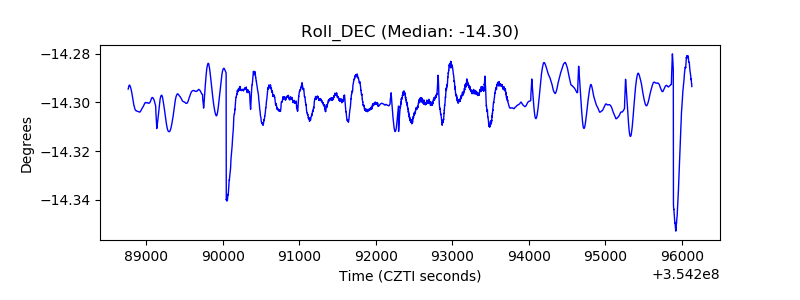 |
| _Roll_RA | 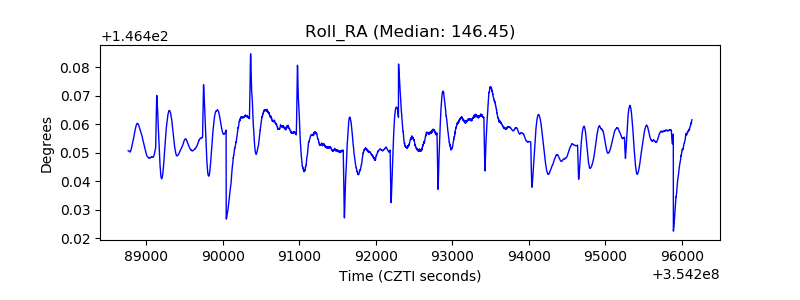 |
| Veto Counter | 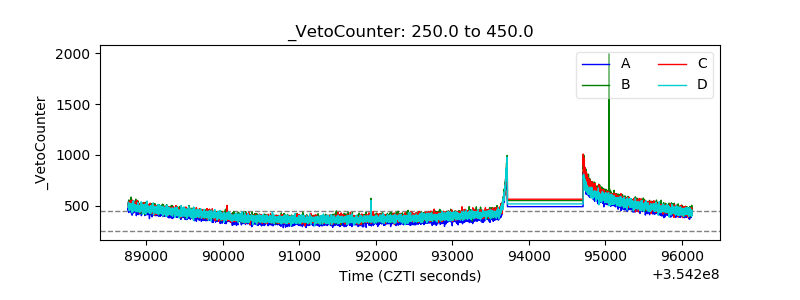 |