| Param | Original file | Final file |
|---|---|---|
| Filename | modeM0/AS1A10_097T02_9000004272_29671cztM0_level2.evt | modeM0/AS1A10_097T02_9000004272_29671cztM0_level2_quad_clean.evt |
| Size (bytes) | 655,416,000 | 103,818,240 |
| Size | 625.1 MB | 99.0 MB |
| Events in quadrant A | 3,220,662 | 708,448 |
| Events in quadrant B | 3,328,755 | 716,587 |
| Events in quadrant C | 3,304,480 | 670,468 |
| Events in quadrant D | 9,560,669 | 600,209 |
| Mode M0 | |||
|---|---|---|---|
| Quadrant | BADHDUFLAG | Total packets | Discarded packets |
| A | 0 | 13743 | 1 |
| B | 0 | 13945 | 1 |
| C | 0 | 13944 | 1 |
| D | 0 | 32947 | 1 |
| Mode SS | |||
|---|---|---|---|
| Quadrant | BADHDUFLAG | Total packets | Discarded packets |
| A | 0 | 130 | 0 |
| B | 0 | 130 | 0 |
| C | 0 | 130 | 0 |
| D | 0 | 130 | 0 |
| Mode M9 | |||
|---|---|---|---|
| Quadrant | BADHDUFLAG | Total packets | Discarded packets |
| A | 0 | 12 | 0 |
| B | 0 | 12 | 0 |
| C | 0 | 12 | 0 |
| D | 0 | 12 | 0 |
| Quadrant | Total seconds | Saturated seconds | Saturation percentage |
|---|---|---|---|
| A | 6427 | 52 | 0.809087% |
| B | 6426 | 49 | 0.762527% |
| C | 6426 | 98 | 1.525054% |
| D | 6427 | 2098 | 32.643535% |
Noise dominated data is calculated using 1-second bins in cleaned event files. If a bin has >2000 counts, and if more than 50% of those come from <1% of pixels, then it is considered to be noise-dominated and hence unusable.
| Quadrant | # 1 sec bins | Bins with >0 counts | Bins with >2000 counts | High rate bins dominated by noise | Noise dominated (total time) | Noise dominated (detector-on time) | Marked lightcurve |
|---|---|---|---|---|---|---|---|
| A | 7572 | 6427 | 0 | 0 | 0.00% | 0.00% | 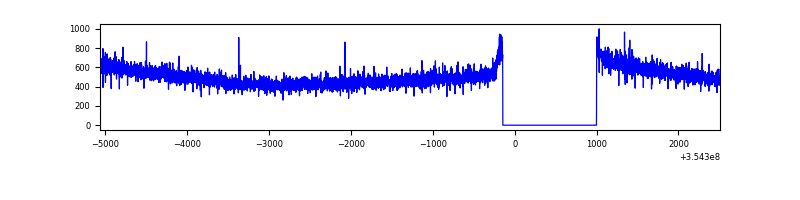 |
| B | 7571 | 6426 | 3 | 3 | 0.04% | 0.05% | 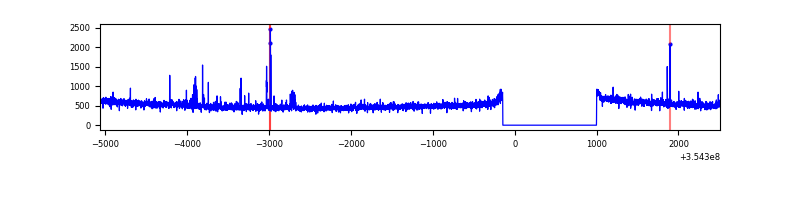 |
| C | 7571 | 6426 | 8 | 8 | 0.11% | 0.12% | 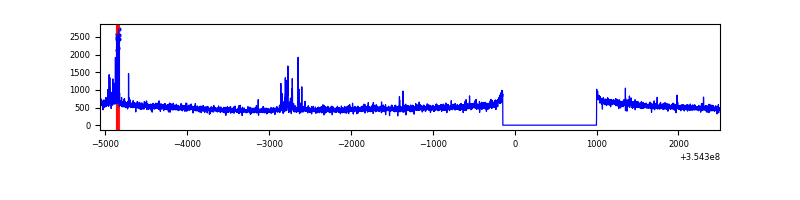 |
| D | 7572 | 6427 | 1970 | 1970 | 26.02% | 30.65% | 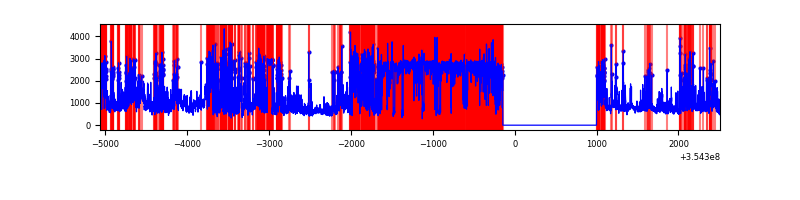 |
Top three noisy pixels from each quadrant. If the there are fewer than three noisy pixels in the level2.evt file, extra rows are filled as -1
| Pixel properties | Quadrant properties | ||||||
|---|---|---|---|---|---|---|---|
| Quadrant | DetID | PixID | Counts | Sigma | Mean | Median | Sigma |
| A | 13 | 254 | 11424 | 63.88 | 833 | 818 | 166.0 |
| A | 3 | 137 | 7943 | 42.92 | 833 | 818 | 166.0 |
| A | 0 | 226 | 7118 | 37.95 | 833 | 818 | 166.0 |
| B | 0 | 189 | 61683 | 385.25 | 819 | 800 | 158.0 |
| B | 0 | 229 | 43329 | 269.11 | 819 | 800 | 158.0 |
| B | 12 | 111 | 18934 | 114.75 | 819 | 800 | 158.0 |
| C | 14 | 238 | 129337 | 705.0 | 782 | 787 | 182.3 |
| C | 10 | 22 | 93758 | 509.88 | 782 | 787 | 182.3 |
| C | 2 | 114 | 15132 | 78.67 | 782 | 787 | 182.3 |
| D | 7 | 80 | 6352267 | 42264.26 | 636 | 620 | 150.3 |
| D | 8 | 195 | 443125 | 2944.46 | 636 | 620 | 150.3 |
| D | 7 | 238 | 162036 | 1074.07 | 636 | 620 | 150.3 |
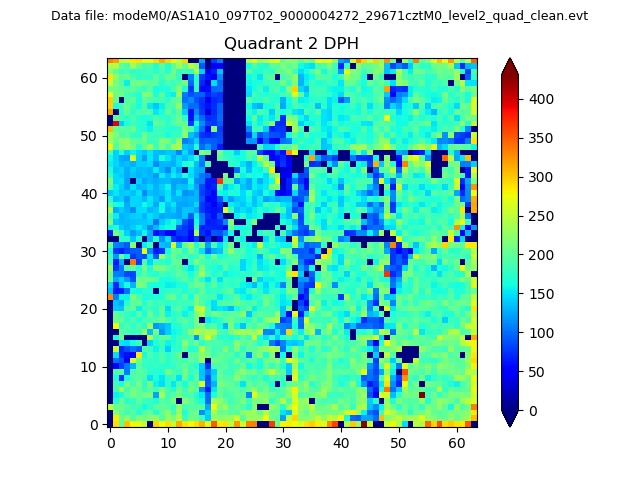
Histogram calculated using DETX and DETY for each event in the final _common_clean file
| Quadrant A | 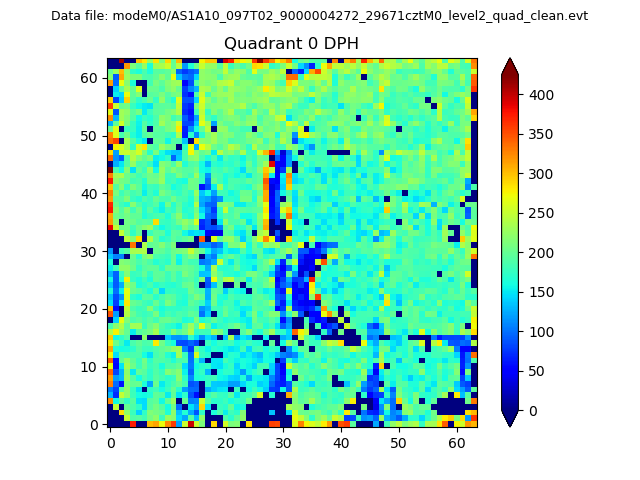 |
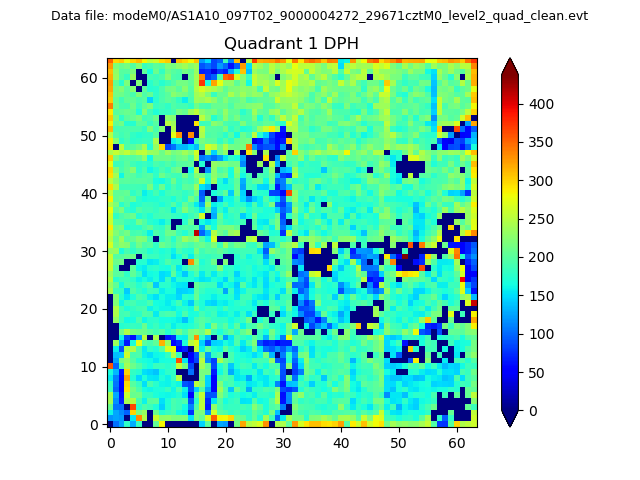 |
Quadrant B |
|---|---|---|---|
| Quadrant D | 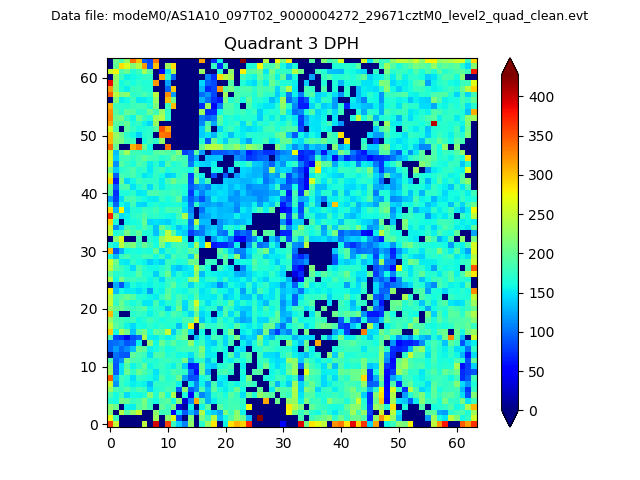 |
 |
Quadrant C |
| Plot type | Count rate plots | Images |
|---|---|---|
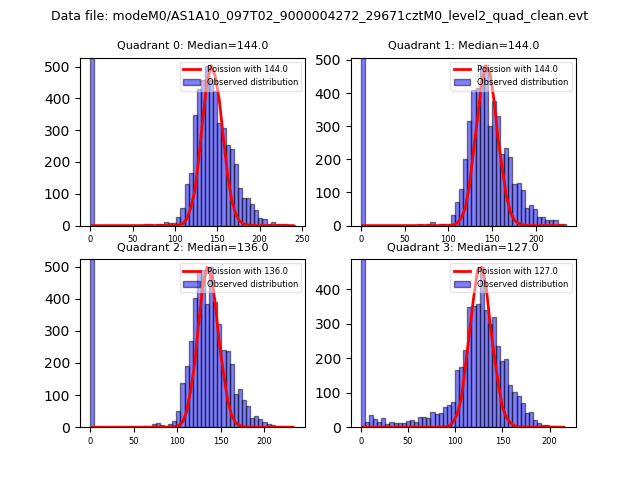
| Comparison with Poisson distribution Blue bars denote a histogram of data divided into 1 sec bins. Red curve is a Poisson curve with rate = median count rate of data. |
 |
 |
| Quadrant-wise count rates Data is divided into 100 sec bins |
 |
|
| Module-wise count rates for Quadrant A Data is divided into 100 sec bins |
 |
 |
| Module-wise count rates for Quadrant B Data is divided into 100 sec bins |
 |
 |
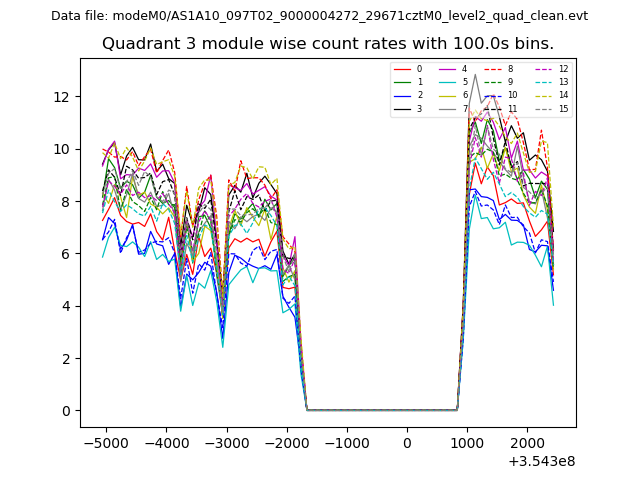
| Module-wise count rates for Quadrant C Data is divided into 100 sec bins |
 |
 |
| Module-wise count rates for Quadrant D Data is divided into 100 sec bins |
 |
 |
| Parameter | Plot |
|---|---|
| CZT HV Monitor |  |
| D_VDD | 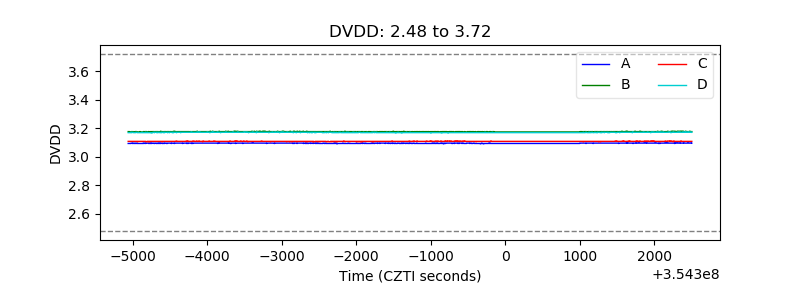 |
| Temperature 1 |  |
| Veto HV Monitor | 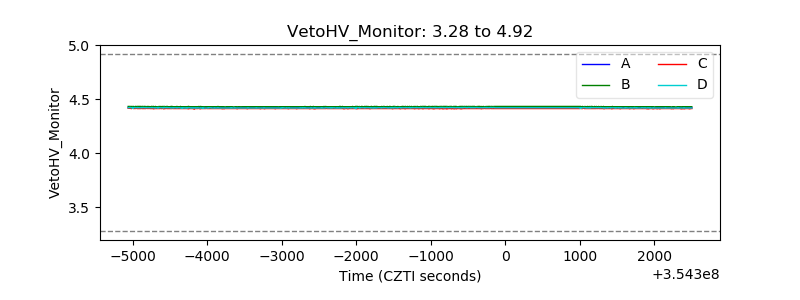 |
| Veto LLD |  |
| Alpha Counter | 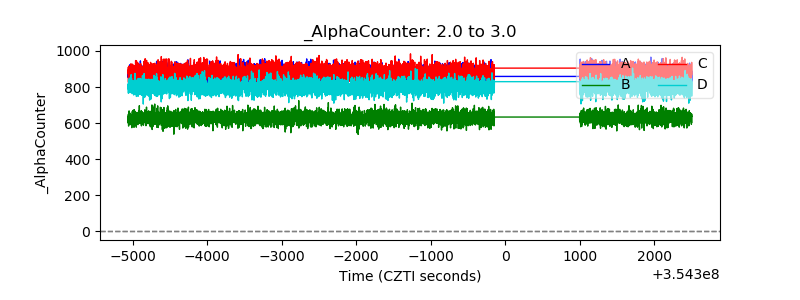 |
| _CPM_Rate | 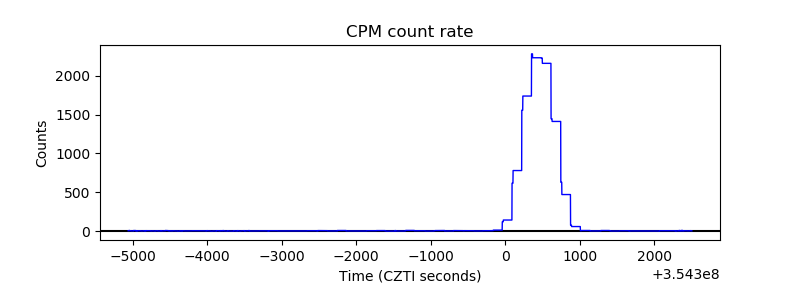 |
| CZT Counter | 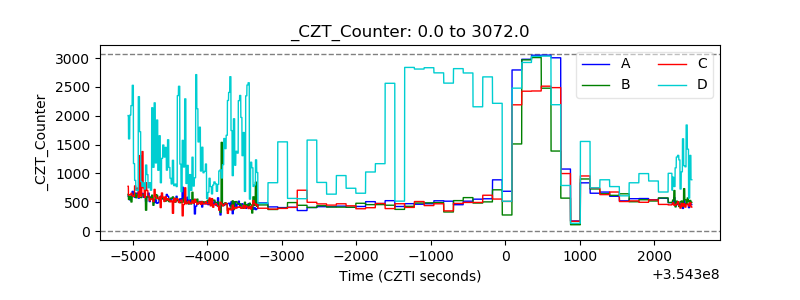 |
| +2.5 Volts monitor |  |
| +5 Volts monitor |  |
| _ROLL_ROT | 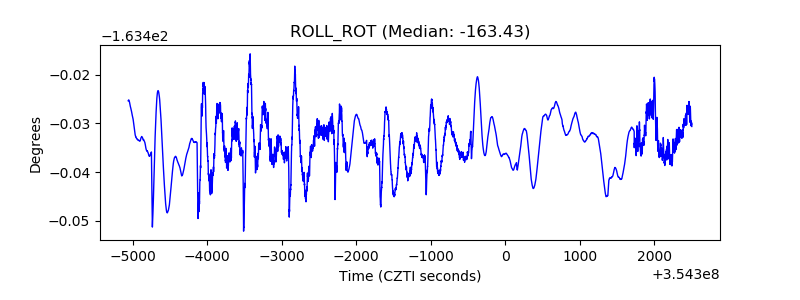 |
| _Roll_DEC | 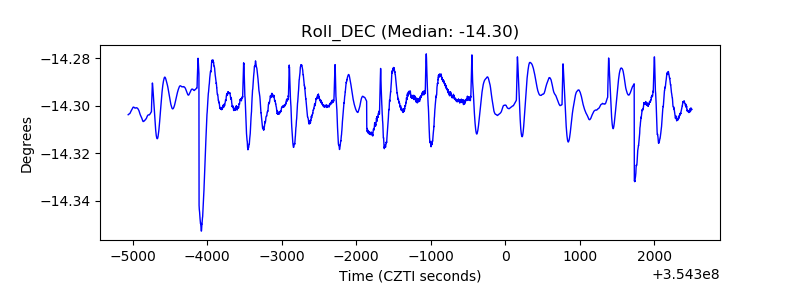 |
| _Roll_RA | 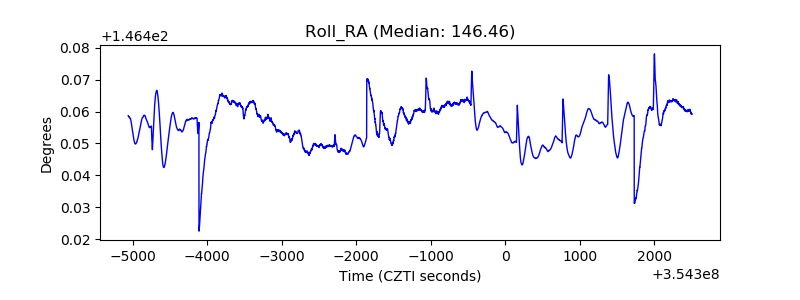 |
| Veto Counter | 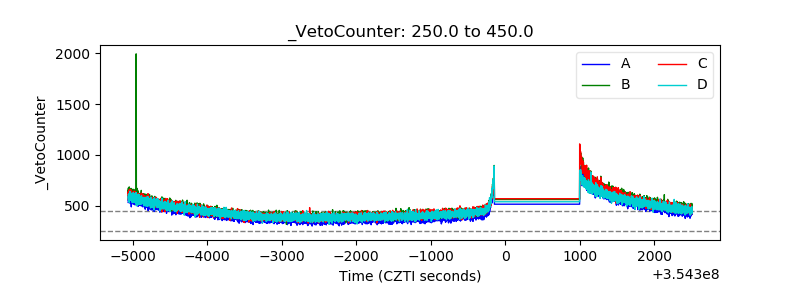 |