| Param | Original file | Final file |
|---|---|---|
| Filename | modeM0/AS1A10_097T02_9000004272_29673cztM0_level2.evt | modeM0/AS1A10_097T02_9000004272_29673cztM0_level2_quad_clean.evt |
| Size (bytes) | 461,836,800 | 92,701,440 |
| Size | 440.4 MB | 88.4 MB |
| Events in quadrant A | 3,135,244 | 615,263 |
| Events in quadrant B | 3,329,141 | 623,529 |
| Events in quadrant C | 3,356,149 | 580,115 |
| Events in quadrant D | 3,752,774 | 563,095 |
| Mode M0 | |||
|---|---|---|---|
| Quadrant | BADHDUFLAG | Total packets | Discarded packets |
| A | 0 | 13087 | 1 |
| B | 0 | 13677 | 1 |
| C | 0 | 13700 | 1 |
| D | 0 | 15225 | 1 |
| Mode SS | |||
|---|---|---|---|
| Quadrant | BADHDUFLAG | Total packets | Discarded packets |
| A | 0 | 124 | 0 |
| B | 0 | 124 | 0 |
| C | 0 | 124 | 0 |
| D | 0 | 124 | 0 |
| Mode M9 | |||
|---|---|---|---|
| Quadrant | BADHDUFLAG | Total packets | Discarded packets |
| A | 0 | 13 | 0 |
| B | 0 | 13 | 0 |
| C | 0 | 13 | 0 |
| D | 0 | 13 | 0 |
| Quadrant | Total seconds | Saturated seconds | Saturation percentage |
|---|---|---|---|
| A | 6090 | 37 | 0.607553% |
| B | 6091 | 79 | 1.296996% |
| C | 6091 | 78 | 1.280578% |
| D | 6091 | 56 | 0.919389% |
Noise dominated data is calculated using 1-second bins in cleaned event files. If a bin has >2000 counts, and if more than 50% of those come from <1% of pixels, then it is considered to be noise-dominated and hence unusable.
| Quadrant | # 1 sec bins | Bins with >0 counts | Bins with >2000 counts | High rate bins dominated by noise | Noise dominated (total time) | Noise dominated (detector-on time) | Marked lightcurve |
|---|---|---|---|---|---|---|---|
| A | 7400 | 6091 | 0 | 0 | 0.00% | 0.00% |  |
| B | 7401 | 6092 | 29 | 29 | 0.39% | 0.48% |  |
| C | 7401 | 6092 | 16 | 16 | 0.22% | 0.26% |  |
| D | 7401 | 6092 | 34 | 34 | 0.46% | 0.56% |  |
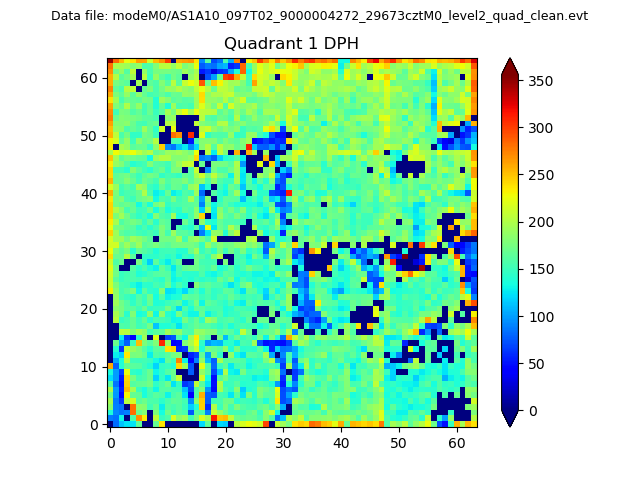
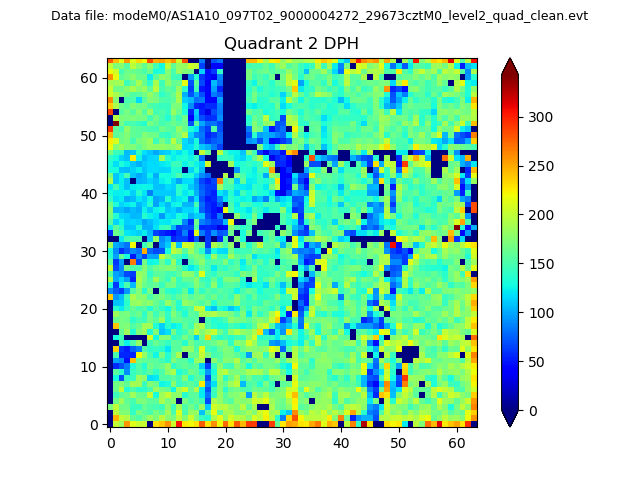
Top three noisy pixels from each quadrant. If the there are fewer than three noisy pixels in the level2.evt file, extra rows are filled as -1
| Pixel properties | Quadrant properties | ||||||
|---|---|---|---|---|---|---|---|
| Quadrant | DetID | PixID | Counts | Sigma | Mean | Median | Sigma |
| A | 13 | 254 | 11731 | 67.72 | 811 | 799 | 161.4 |
| A | 3 | 137 | 7495 | 41.48 | 811 | 799 | 161.4 |
| A | 0 | 226 | 7002 | 38.43 | 811 | 799 | 161.4 |
| B | 0 | 229 | 143972 | 944.44 | 805 | 786 | 151.6 |
| B | 0 | 189 | 20130 | 127.59 | 805 | 786 | 151.6 |
| B | 12 | 111 | 17804 | 112.25 | 805 | 786 | 151.6 |
| C | 14 | 238 | 134863 | 751.38 | 766 | 772 | 178.5 |
| C | 10 | 22 | 120040 | 668.32 | 766 | 772 | 178.5 |
| C | 3 | 233 | 56911 | 314.58 | 766 | 772 | 178.5 |
| D | 8 | 195 | 444941 | 2445.46 | 769 | 751 | 181.6 |
| D | 7 | 80 | 279991 | 1537.34 | 769 | 751 | 181.6 |
| D | 2 | 250 | 47542 | 257.6 | 769 | 751 | 181.6 |
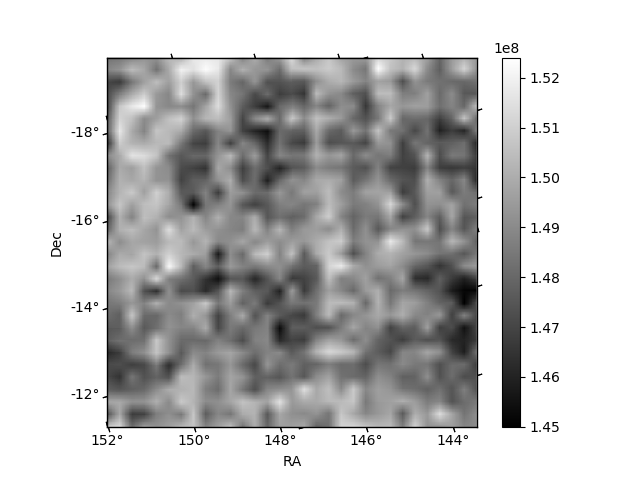
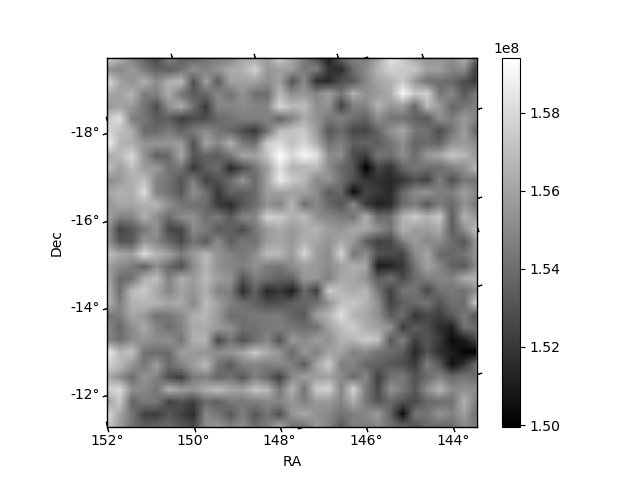
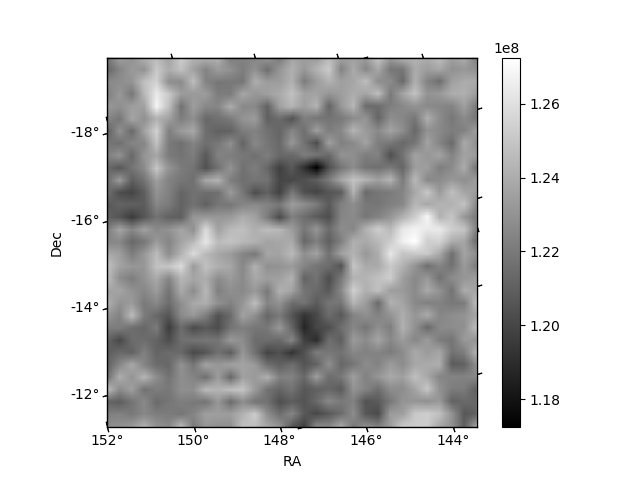
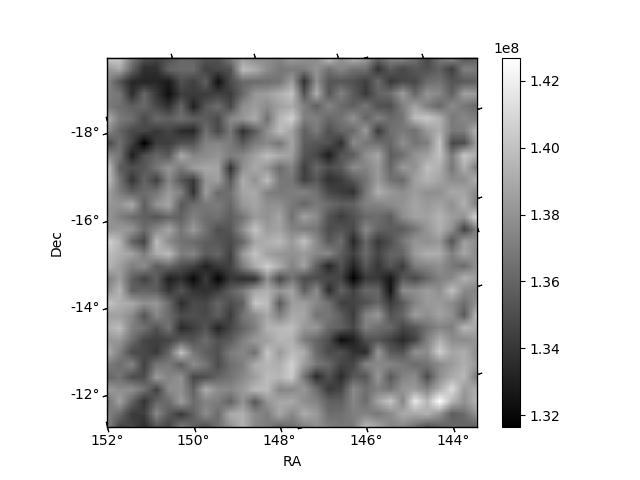
Histogram calculated using DETX and DETY for each event in the final _common_clean file
| Quadrant A | 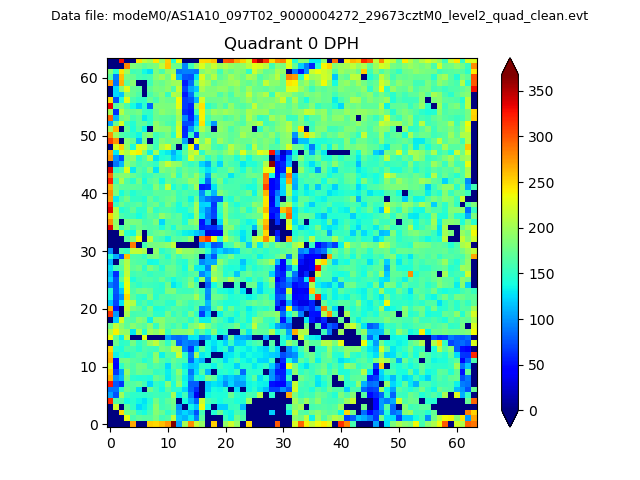 |
 |
Quadrant B |
|---|---|---|---|
| Quadrant D | 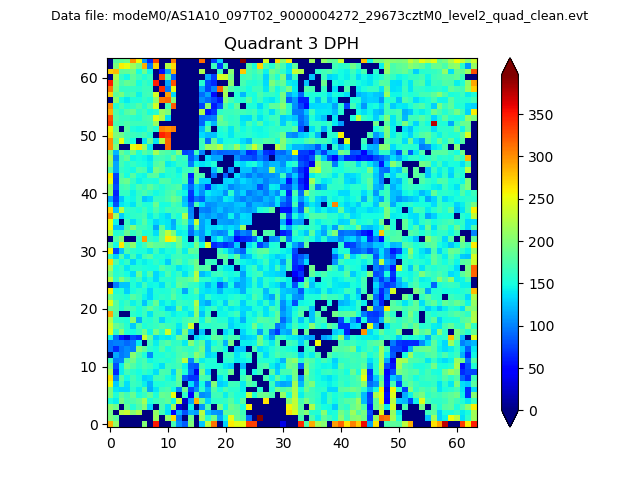 |
 |
Quadrant C |
| Plot type | Count rate plots | Images |
|---|---|---|
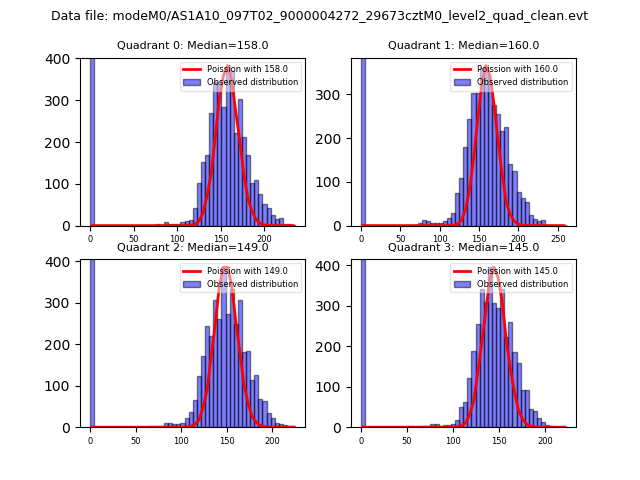
| Comparison with Poisson distribution Blue bars denote a histogram of data divided into 1 sec bins. Red curve is a Poisson curve with rate = median count rate of data. |
 |
 |
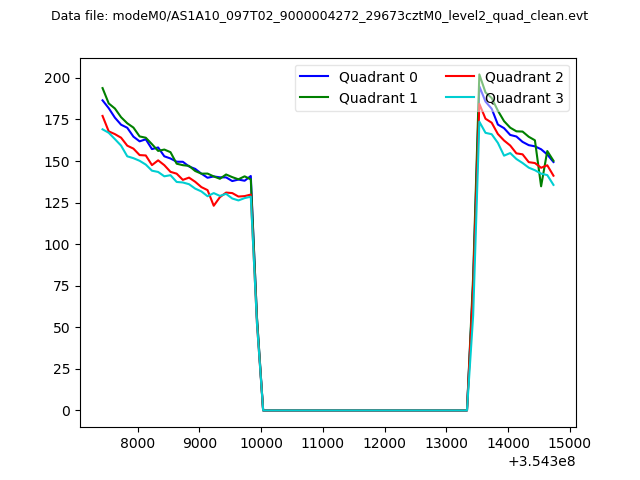
| Quadrant-wise count rates Data is divided into 100 sec bins |
 |
|
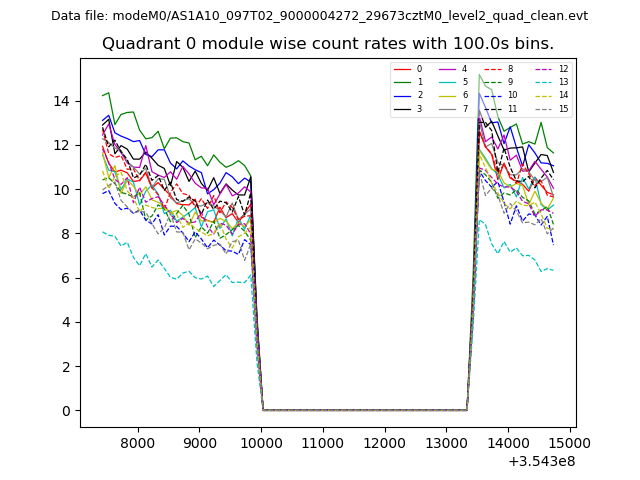
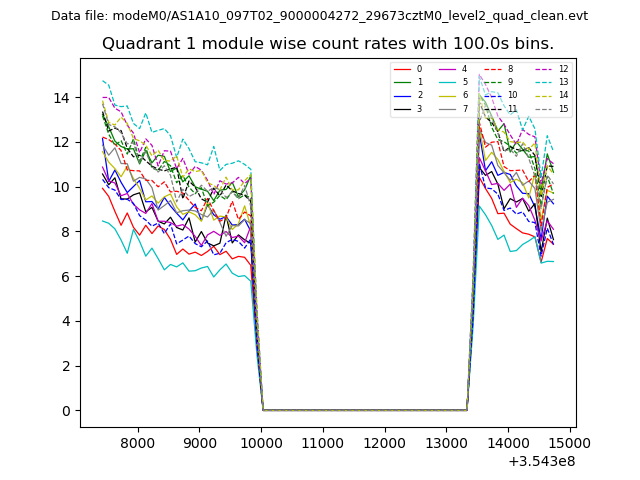
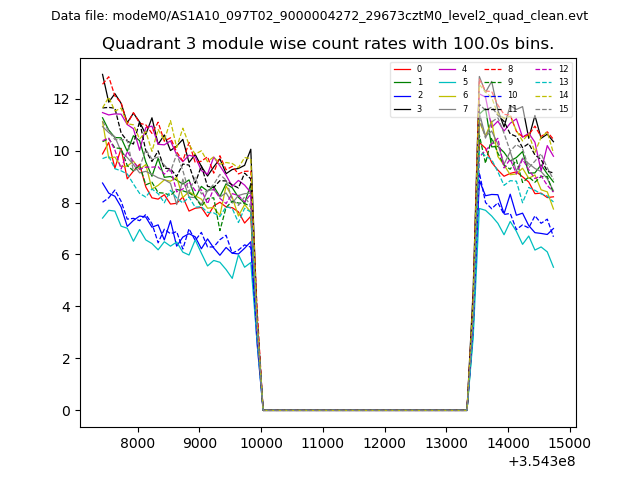
| Module-wise count rates for Quadrant A Data is divided into 100 sec bins |
 |
 |
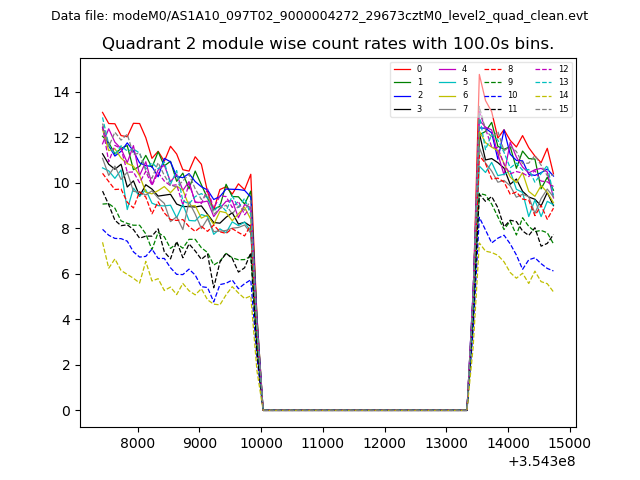
| Module-wise count rates for Quadrant B Data is divided into 100 sec bins |
 |
 |
| Module-wise count rates for Quadrant C Data is divided into 100 sec bins |
 |
 |
| Module-wise count rates for Quadrant D Data is divided into 100 sec bins |
 |
 |
| Parameter | Plot |
|---|---|
| CZT HV Monitor | 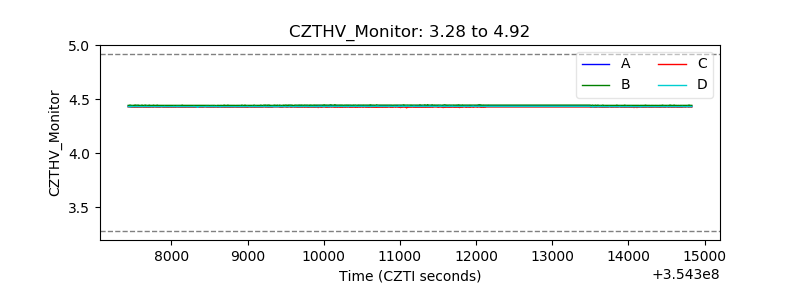 |
| D_VDD | 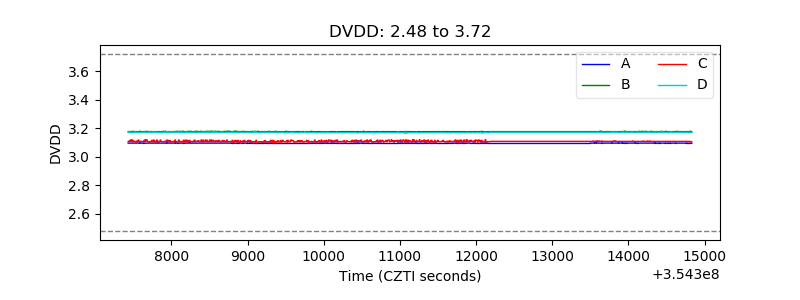 |
| Temperature 1 | 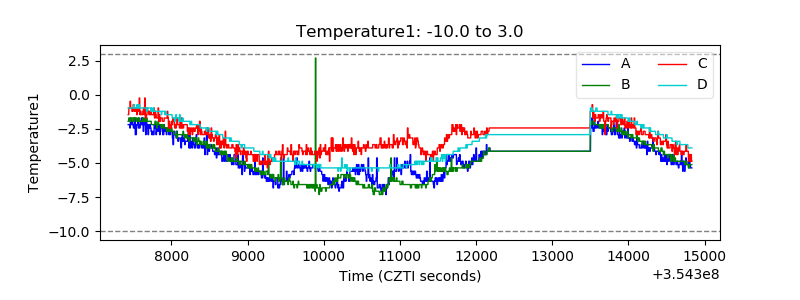 |
| Veto HV Monitor | 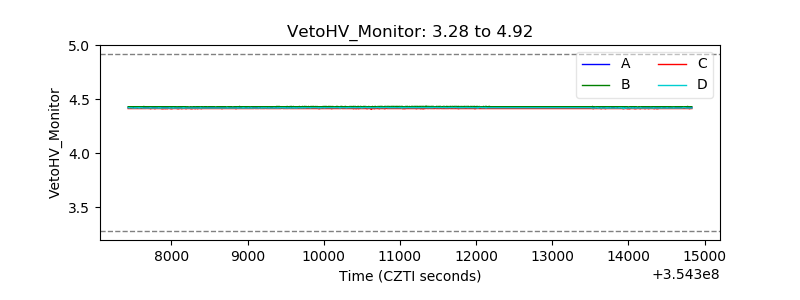 |
| Veto LLD | 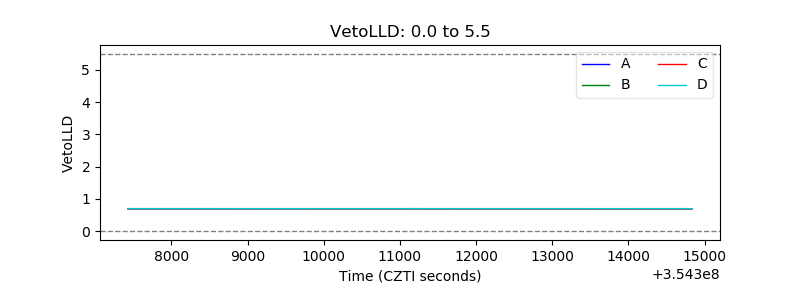 |
| Alpha Counter |  |
| _CPM_Rate | 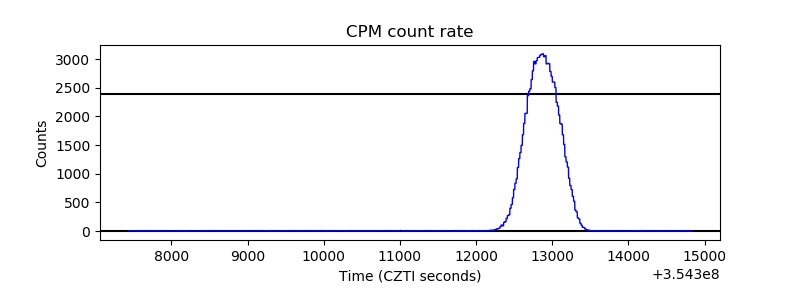 |
| CZT Counter | 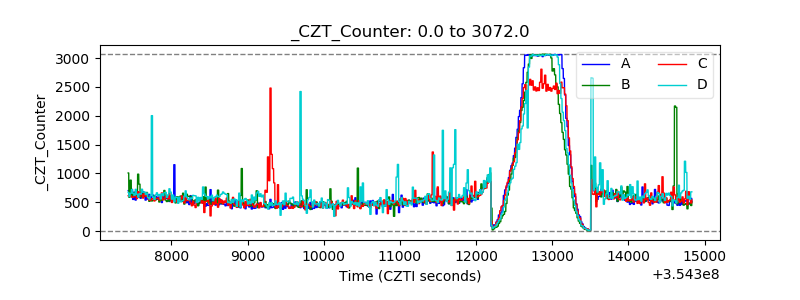 |
| +2.5 Volts monitor |  |
| +5 Volts monitor | 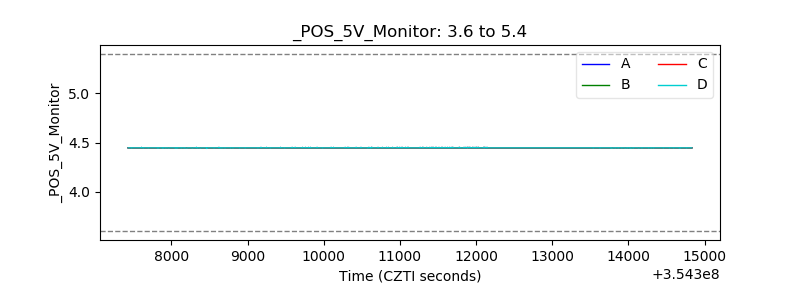 |
| _ROLL_ROT |  |
| _Roll_DEC | 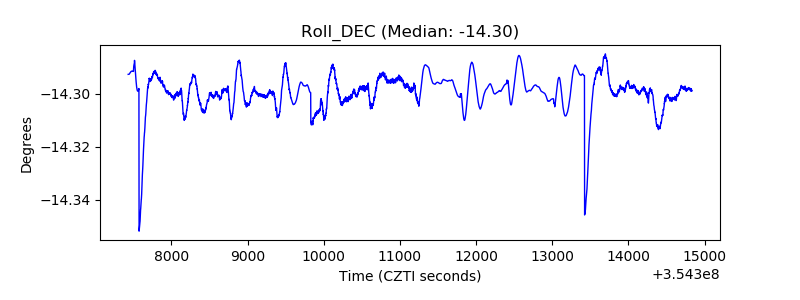 |
| _Roll_RA | 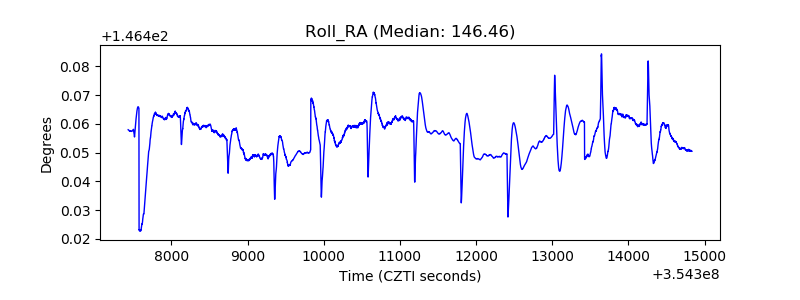 |
| Veto Counter | 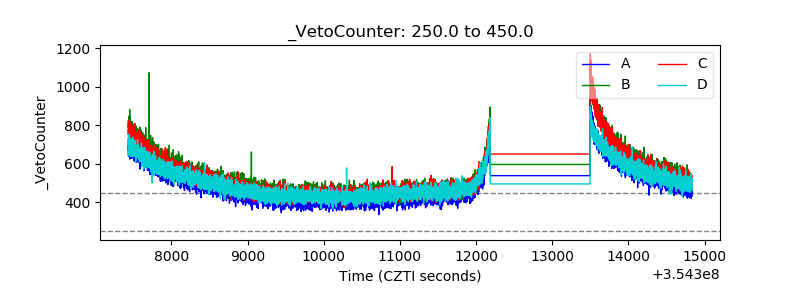 |