| Param | Original file | Final file |
|---|---|---|
| Filename | modeM0/AS1A10_097T02_9000004272_29675cztM0_level2.evt | modeM0/AS1A10_097T02_9000004272_29675cztM0_level2_quad_clean.evt |
| Size (bytes) | 468,146,880 | 92,266,560 |
| Size | 446.5 MB | 88.0 MB |
| Events in quadrant A | 3,153,852 | 599,587 |
| Events in quadrant B | 3,456,217 | 618,751 |
| Events in quadrant C | 3,583,066 | 577,081 |
| Events in quadrant D | 3,557,033 | 559,210 |
| Mode M0 | |||
|---|---|---|---|
| Quadrant | BADHDUFLAG | Total packets | Discarded packets |
| A | 0 | 13293 | 3 |
| B | 0 | 14136 | 2 |
| C | 0 | 14479 | 2 |
| D | 0 | 14459 | 2 |
| Mode SS | |||
|---|---|---|---|
| Quadrant | BADHDUFLAG | Total packets | Discarded packets |
| A | 0 | 128 | 0 |
| B | 0 | 128 | 0 |
| C | 0 | 128 | 0 |
| D | 0 | 128 | 0 |
| Mode M9 | |||
|---|---|---|---|
| Quadrant | BADHDUFLAG | Total packets | Discarded packets |
| A | 0 | 15 | 0 |
| B | 0 | 16 | 0 |
| C | 0 | 16 | 0 |
| D | 0 | 16 | 0 |
| Quadrant | Total seconds | Saturated seconds | Saturation percentage |
|---|---|---|---|
| A | 6298 | 65 | 1.032074% |
| B | 6298 | 103 | 1.635440% |
| C | 6298 | 272 | 4.318831% |
| D | 6298 | 40 | 0.635122% |
Noise dominated data is calculated using 1-second bins in cleaned event files. If a bin has >2000 counts, and if more than 50% of those come from <1% of pixels, then it is considered to be noise-dominated and hence unusable.
| Quadrant | # 1 sec bins | Bins with >0 counts | Bins with >2000 counts | High rate bins dominated by noise | Noise dominated (total time) | Noise dominated (detector-on time) | Marked lightcurve |
|---|---|---|---|---|---|---|---|
| A | 7493 | 6299 | 0 | 0 | 0.00% | 0.00% | 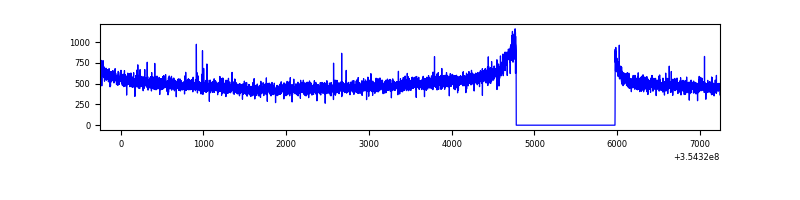 |
| B | 7493 | 6298 | 11 | 11 | 0.15% | 0.17% | 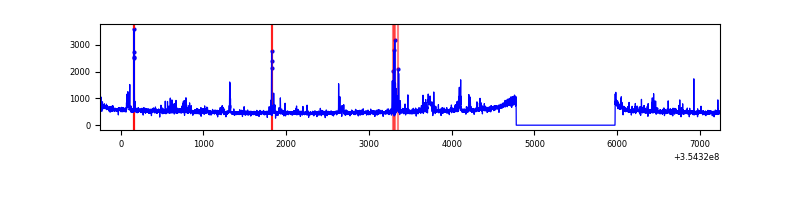 |
| C | 7493 | 6299 | 16 | 16 | 0.21% | 0.25% | 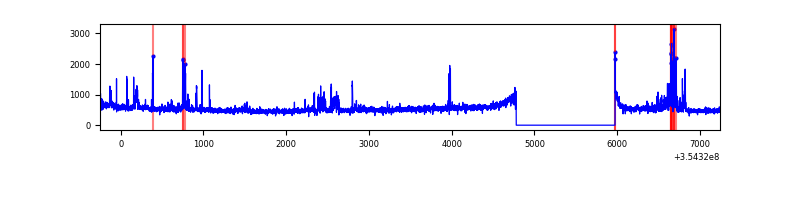 |
| D | 7493 | 6299 | 14 | 14 | 0.19% | 0.22% | 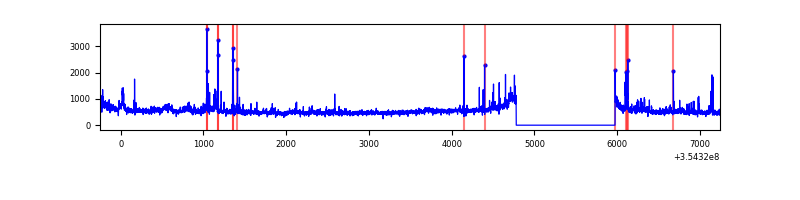 |
Top three noisy pixels from each quadrant. If the there are fewer than three noisy pixels in the level2.evt file, extra rows are filled as -1
| Pixel properties | Quadrant properties | ||||||
|---|---|---|---|---|---|---|---|
| Quadrant | DetID | PixID | Counts | Sigma | Mean | Median | Sigma |
| A | 13 | 254 | 12001 | 67.83 | 816 | 801 | 165.1 |
| A | 3 | 137 | 8056 | 43.93 | 816 | 801 | 165.1 |
| A | 0 | 226 | 6895 | 36.9 | 816 | 801 | 165.1 |
| B | 0 | 229 | 192734 | 1233.69 | 817 | 795 | 155.6 |
| B | 0 | 190 | 33265 | 208.7 | 817 | 795 | 155.6 |
| B | 10 | 245 | 22000 | 136.3 | 817 | 795 | 155.6 |
| C | 3 | 233 | 174479 | 963.58 | 771 | 779 | 180.3 |
| C | 14 | 238 | 168922 | 932.76 | 771 | 779 | 180.3 |
| C | 10 | 22 | 155111 | 856.14 | 771 | 779 | 180.3 |
| D | 8 | 195 | 342285 | 1836.09 | 778 | 757 | 186.0 |
| D | 7 | 80 | 98885 | 527.54 | 778 | 757 | 186.0 |
| D | 2 | 250 | 50618 | 268.06 | 778 | 757 | 186.0 |
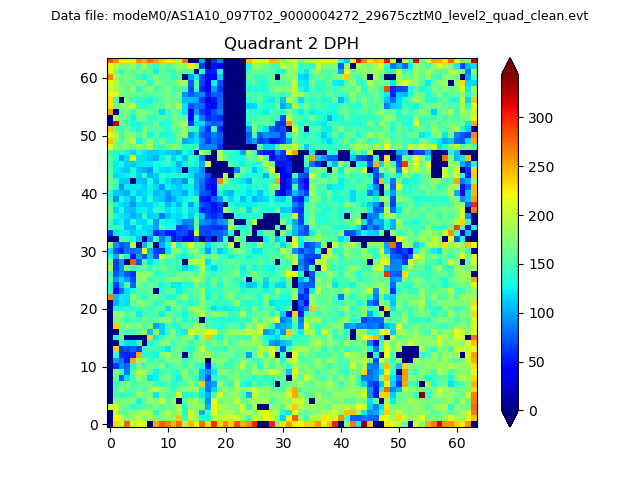
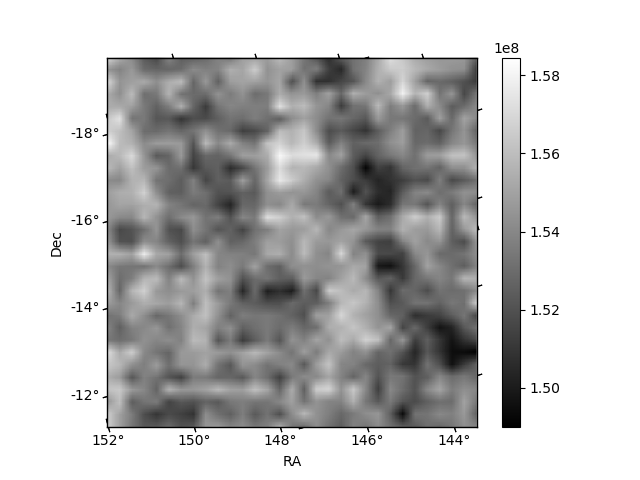
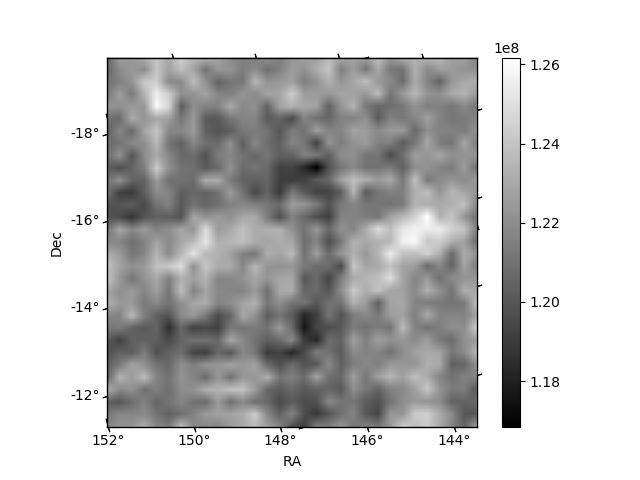
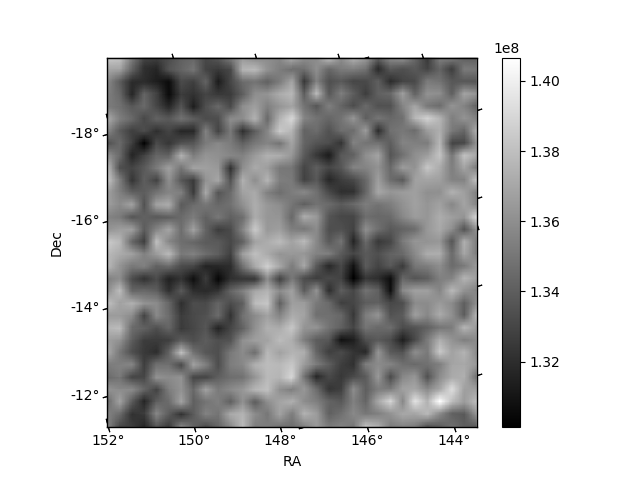
Histogram calculated using DETX and DETY for each event in the final _common_clean file
| Quadrant A | 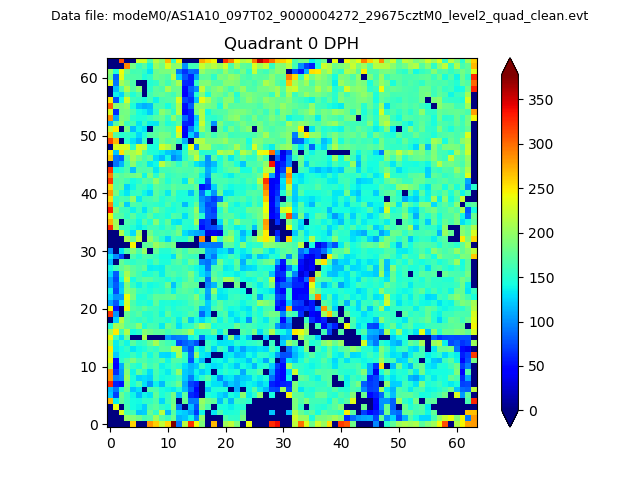 |
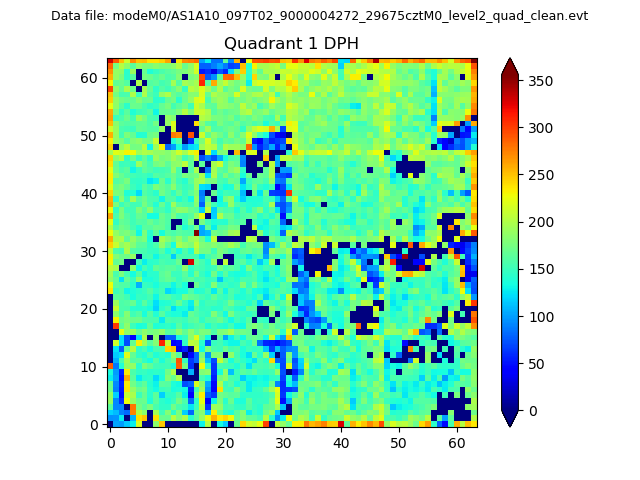 |
Quadrant B |
|---|---|---|---|
| Quadrant D | 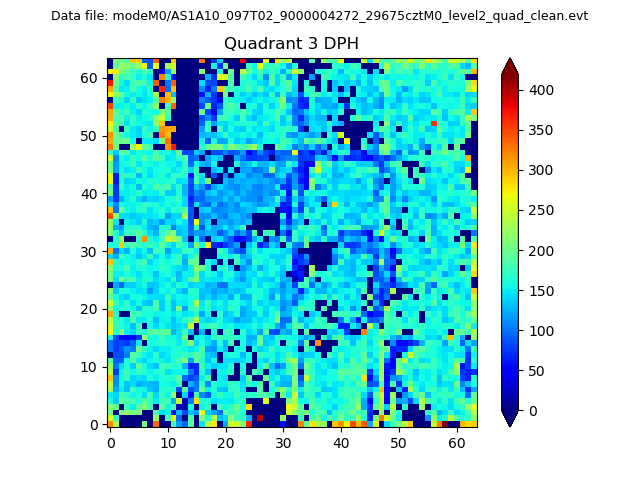 |
 |
Quadrant C |
| Plot type | Count rate plots | Images |
|---|---|---|
| Comparison with Poisson distribution Blue bars denote a histogram of data divided into 1 sec bins. Red curve is a Poisson curve with rate = median count rate of data. |
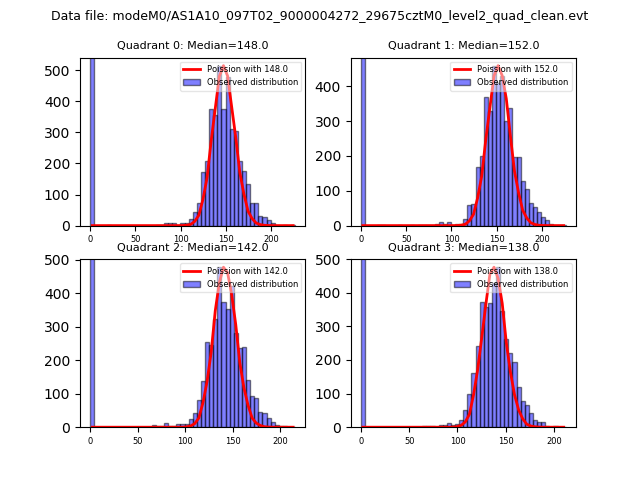 |
 |
| Quadrant-wise count rates Data is divided into 100 sec bins |
 |
|
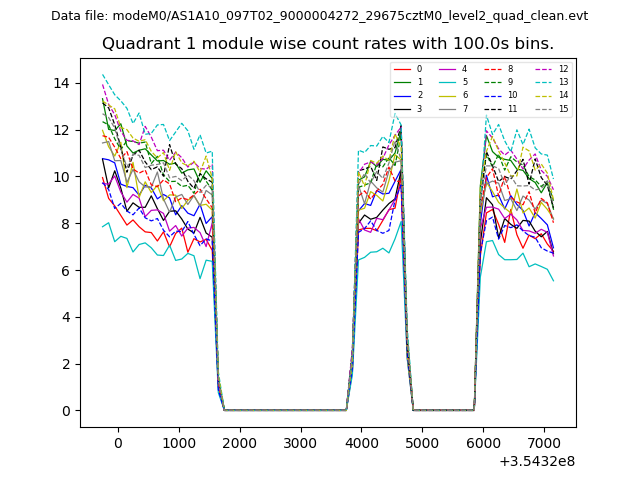
| Module-wise count rates for Quadrant A Data is divided into 100 sec bins |
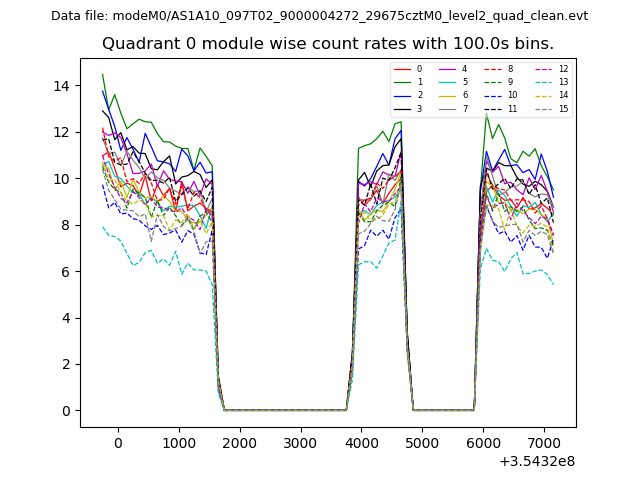 |
 |
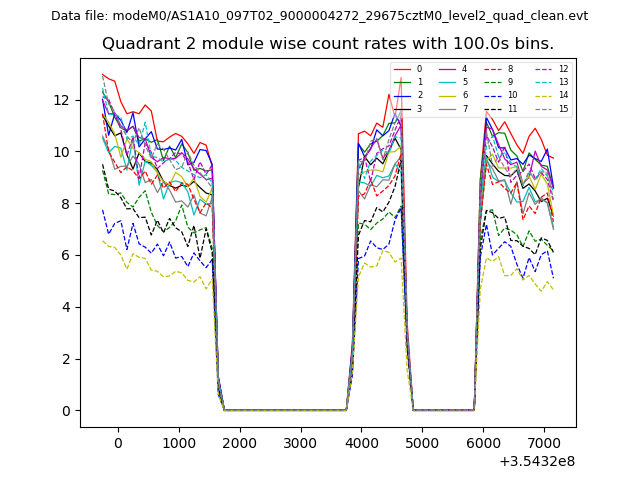
| Module-wise count rates for Quadrant B Data is divided into 100 sec bins |
 |
 |
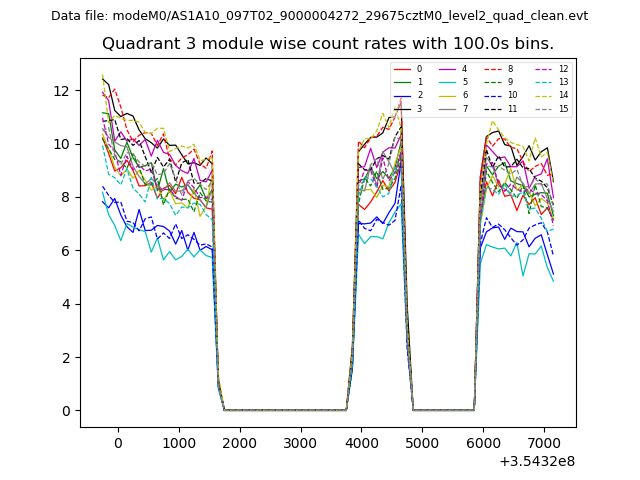
| Module-wise count rates for Quadrant C Data is divided into 100 sec bins |
 |
 |
| Module-wise count rates for Quadrant D Data is divided into 100 sec bins |
 |
 |
| Parameter | Plot |
|---|---|
| CZT HV Monitor | 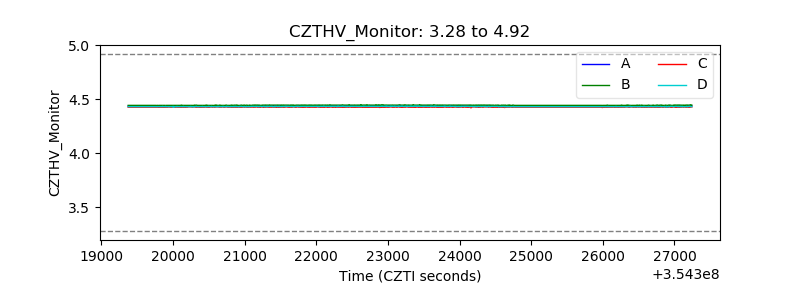 |
| D_VDD | 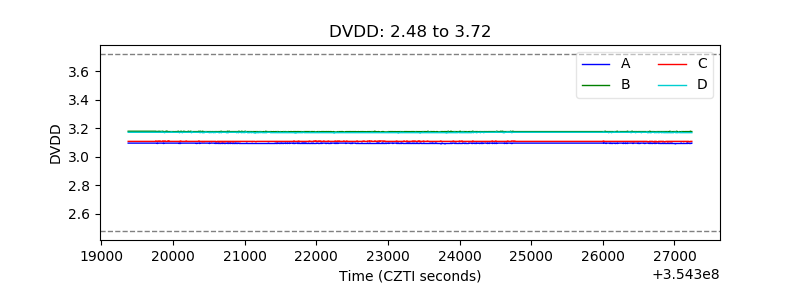 |
| Temperature 1 | 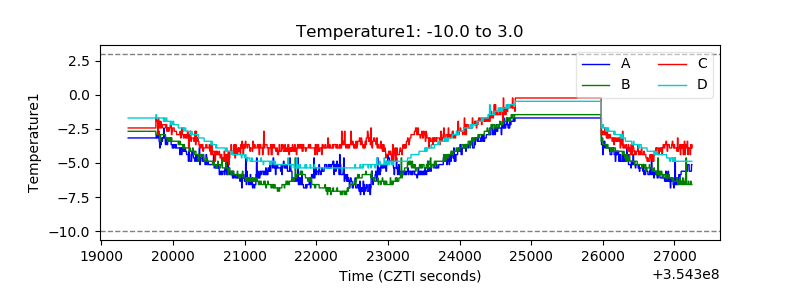 |
| Veto HV Monitor | 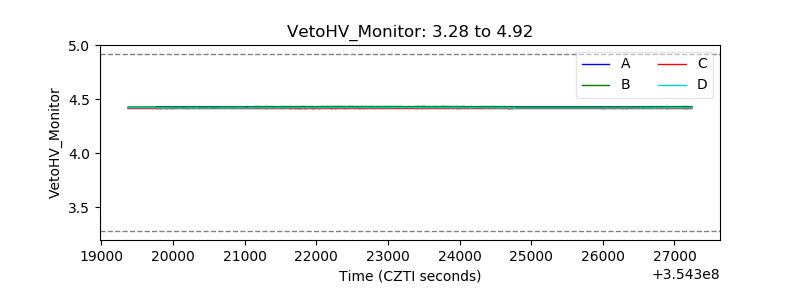 |
| Veto LLD | 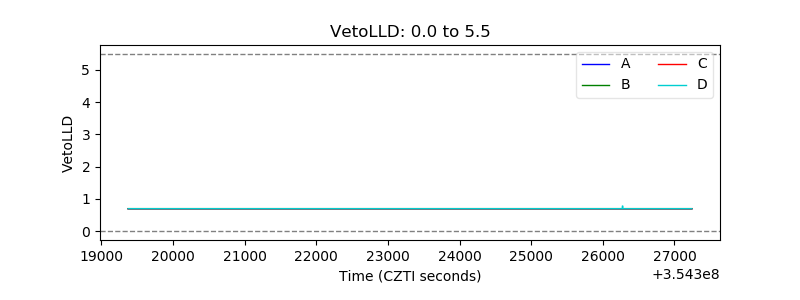 |
| Alpha Counter | 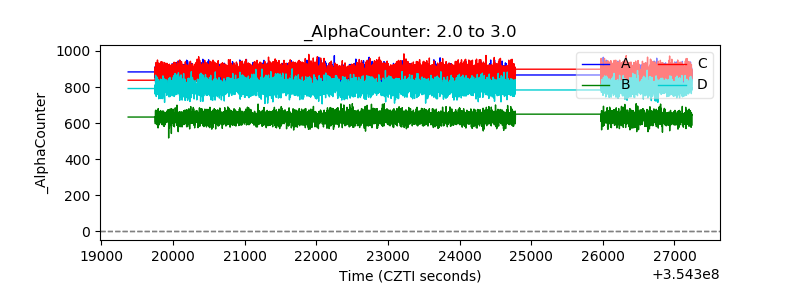 |
| _CPM_Rate | 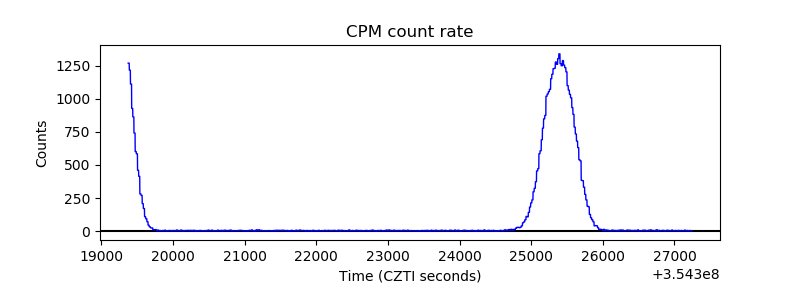 |
| CZT Counter | 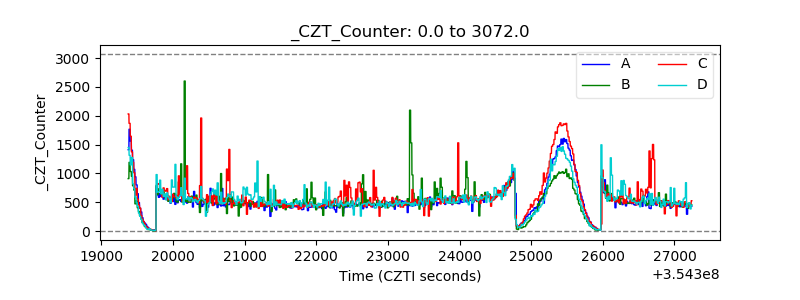 |
| +2.5 Volts monitor |  |
| +5 Volts monitor |  |
| _ROLL_ROT | 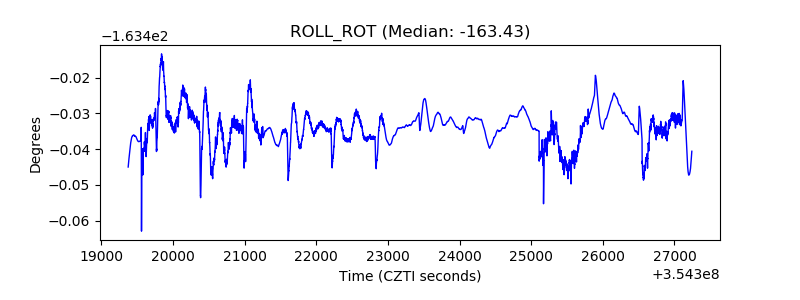 |
| _Roll_DEC | 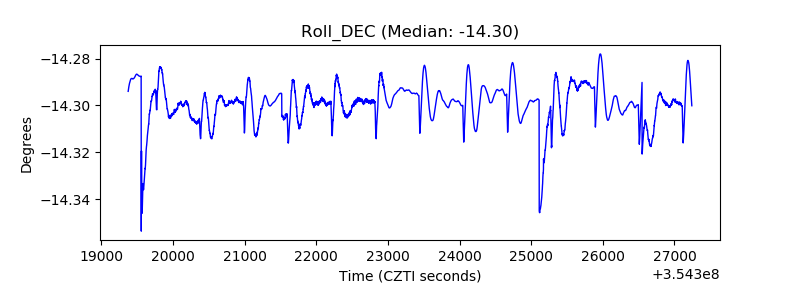 |
| _Roll_RA |  |
| Veto Counter | 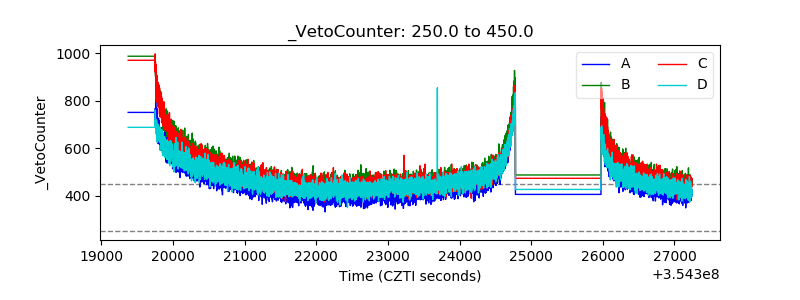 |