| Param | Original file | Final file |
|---|---|---|
| Filename | modeM0/AS1A10_097T02_9000004272_29676cztM0_level2.evt | modeM0/AS1A10_097T02_9000004272_29676cztM0_level2_quad_clean.evt |
| Size (bytes) | 175,855,680 | 37,169,280 |
| Size | 167.7 MB | 35.4 MB |
| Events in quadrant A | 1,167,373 | 243,863 |
| Events in quadrant B | 1,234,916 | 250,319 |
| Events in quadrant C | 1,316,837 | 232,756 |
| Events in quadrant D | 1,442,776 | 226,924 |
| Mode M0 | |||
|---|---|---|---|
| Quadrant | BADHDUFLAG | Total packets | Discarded packets |
| A | 0 | 5044 | 1 |
| B | 0 | 5164 | 1 |
| C | 0 | 5440 | 1 |
| D | 0 | 5848 | 1 |
| Mode SS | |||
|---|---|---|---|
| Quadrant | BADHDUFLAG | Total packets | Discarded packets |
| A | 0 | 50 | 0 |
| B | 0 | 50 | 0 |
| C | 0 | 50 | 0 |
| D | 0 | 50 | 0 |
| Mode M9 | |||
|---|---|---|---|
| Quadrant | BADHDUFLAG | Total packets | Discarded packets |
| A | 0 | 12 | 0 |
| B | 0 | 12 | 0 |
| C | 0 | 12 | 0 |
| D | 0 | 12 | 0 |
| Quadrant | Total seconds | Saturated seconds | Saturation percentage |
|---|---|---|---|
| A | 2376 | 59 | 2.483165% |
| B | 2377 | 76 | 3.197308% |
| C | 2377 | 89 | 3.744215% |
| D | 2377 | 42 | 1.766933% |
Noise dominated data is calculated using 1-second bins in cleaned event files. If a bin has >2000 counts, and if more than 50% of those come from <1% of pixels, then it is considered to be noise-dominated and hence unusable.
| Quadrant | # 1 sec bins | Bins with >0 counts | Bins with >2000 counts | High rate bins dominated by noise | Noise dominated (total time) | Noise dominated (detector-on time) | Marked lightcurve |
|---|---|---|---|---|---|---|---|
| A | 3571 | 2377 | 0 | 0 | 0.00% | 0.00% | 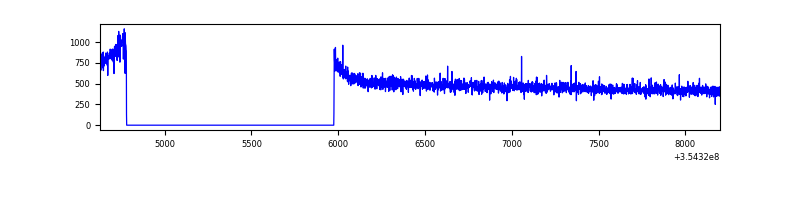 |
| B | 3572 | 2377 | 0 | 0 | 0.00% | 0.00% | 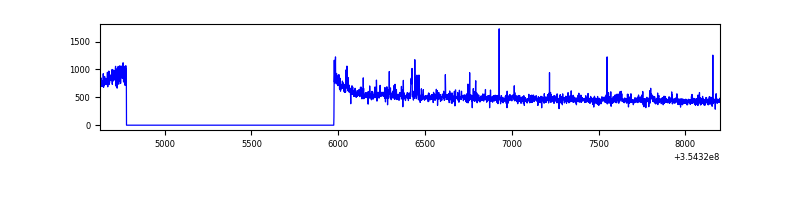 |
| C | 3572 | 2378 | 12 | 12 | 0.34% | 0.50% | 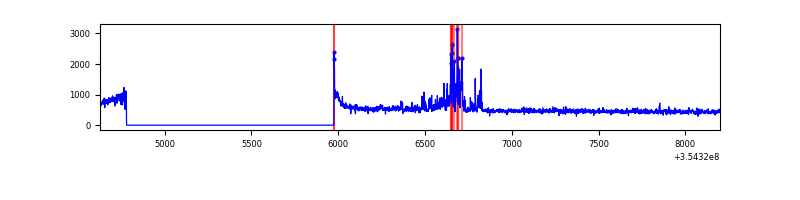 |
| D | 3572 | 2378 | 17 | 17 | 0.48% | 0.71% | 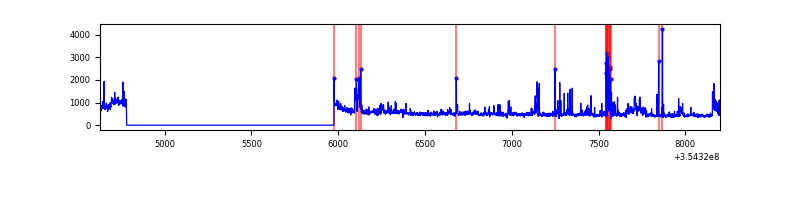 |
Top three noisy pixels from each quadrant. If the there are fewer than three noisy pixels in the level2.evt file, extra rows are filled as -1
| Pixel properties | Quadrant properties | ||||||
|---|---|---|---|---|---|---|---|
| Quadrant | DetID | PixID | Counts | Sigma | Mean | Median | Sigma |
| A | 13 | 254 | 4552 | 68.24 | 302 | 295 | 62.4 |
| A | 3 | 137 | 3043 | 44.05 | 302 | 295 | 62.4 |
| A | 0 | 226 | 2494 | 35.25 | 302 | 295 | 62.4 |
| B | 0 | 229 | 28749 | 473.88 | 304 | 296 | 60.0 |
| B | 12 | 111 | 7214 | 115.22 | 304 | 296 | 60.0 |
| B | 0 | 190 | 6427 | 102.11 | 304 | 296 | 60.0 |
| C | 10 | 22 | 100467 | 1432.9 | 288 | 291 | 69.9 |
| C | 14 | 238 | 51722 | 735.66 | 288 | 291 | 69.9 |
| C | 3 | 233 | 28249 | 399.91 | 288 | 291 | 69.9 |
| D | 8 | 195 | 85909 | 1213.27 | 287 | 279 | 70.6 |
| D | 13 | 104 | 81717 | 1153.87 | 287 | 279 | 70.6 |
| D | 7 | 238 | 65518 | 924.35 | 287 | 279 | 70.6 |
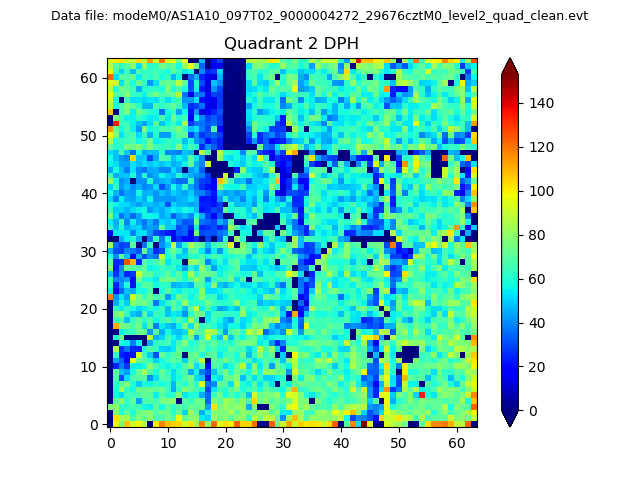
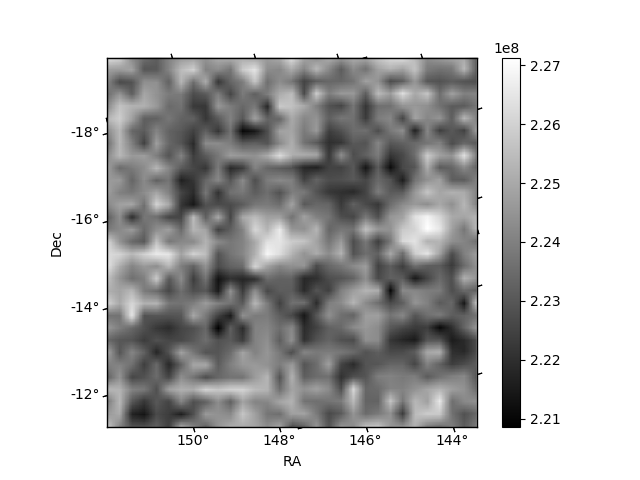
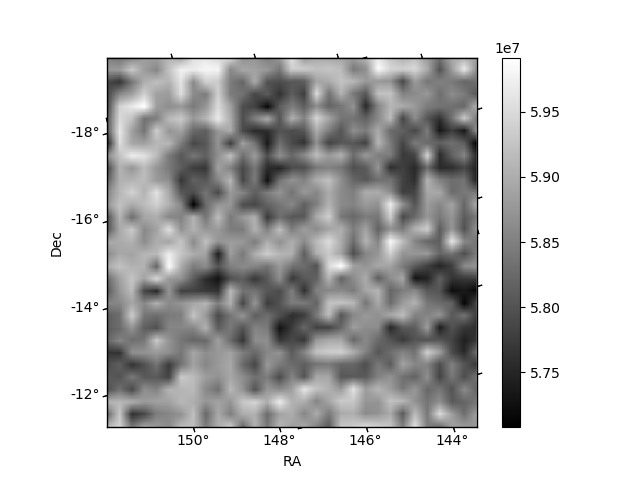
Histogram calculated using DETX and DETY for each event in the final _common_clean file
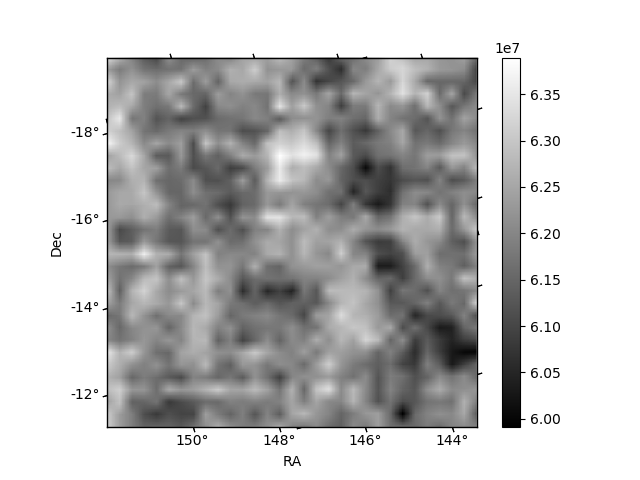
| Quadrant A | 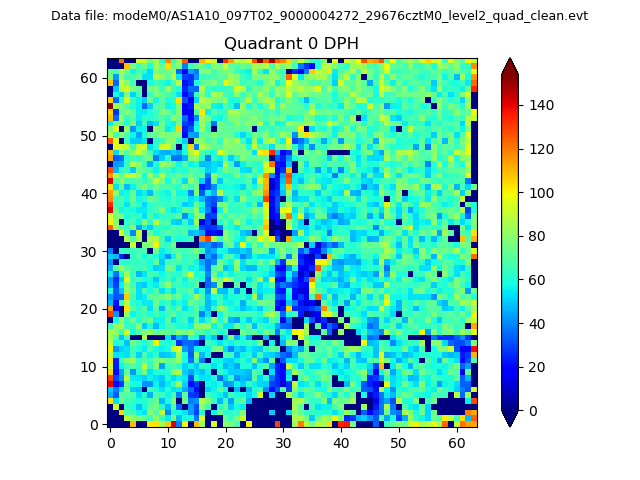 |
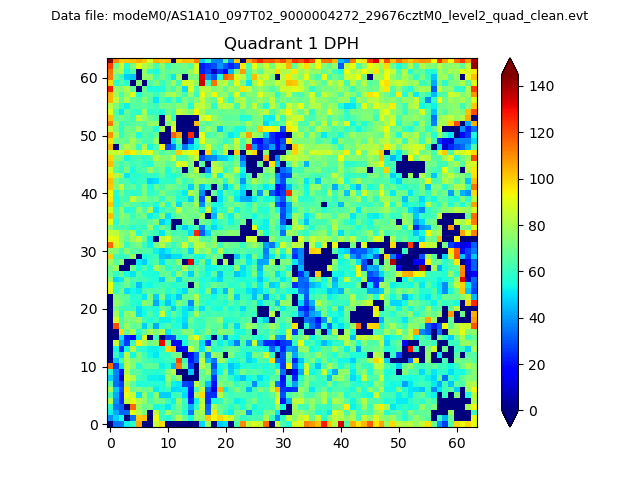 |
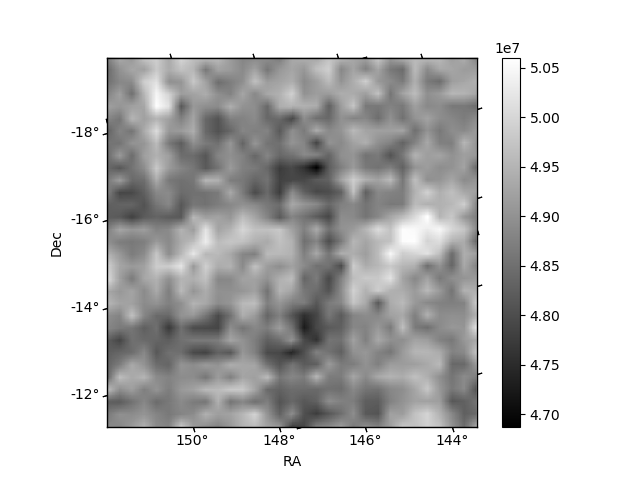
Quadrant B |
|---|---|---|---|
| Quadrant D | 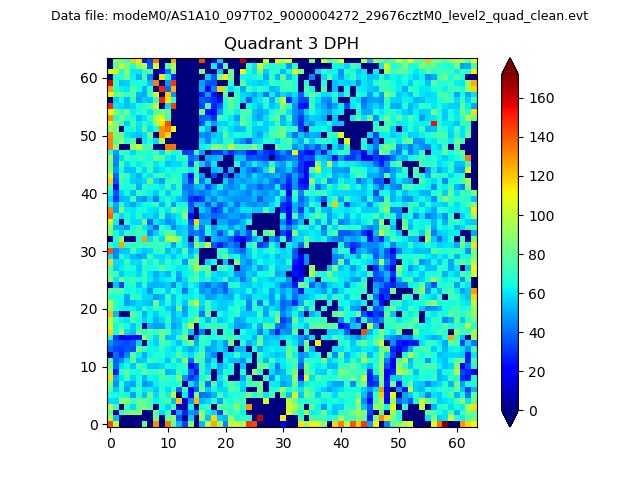 |
 |
Quadrant C |
| Plot type | Count rate plots | Images |
|---|---|---|
| Comparison with Poisson distribution Blue bars denote a histogram of data divided into 1 sec bins. Red curve is a Poisson curve with rate = median count rate of data. |
 |
 |
| Quadrant-wise count rates Data is divided into 100 sec bins |
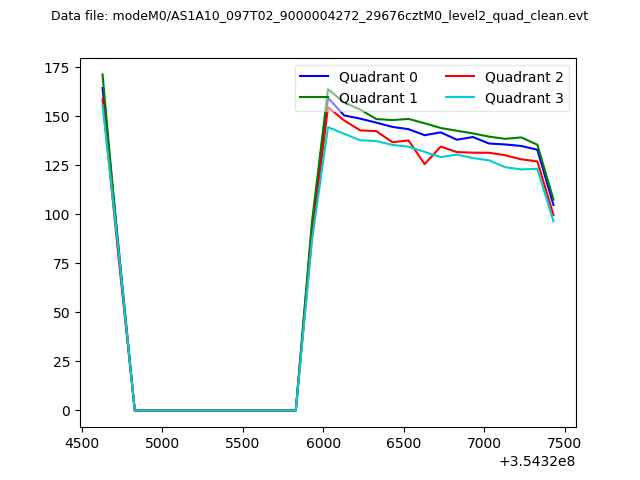 |
|
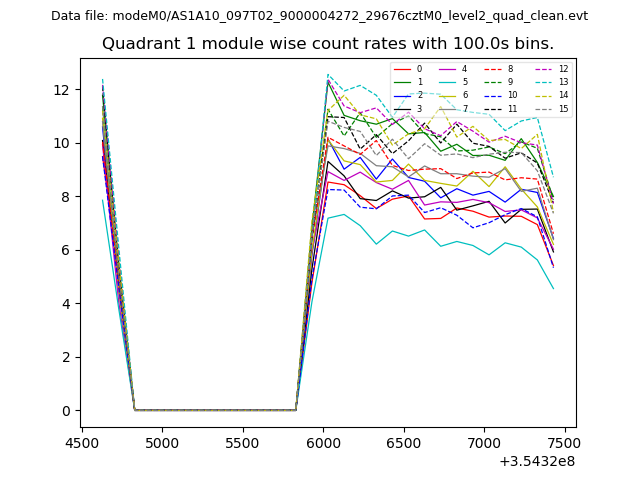
| Module-wise count rates for Quadrant A Data is divided into 100 sec bins |
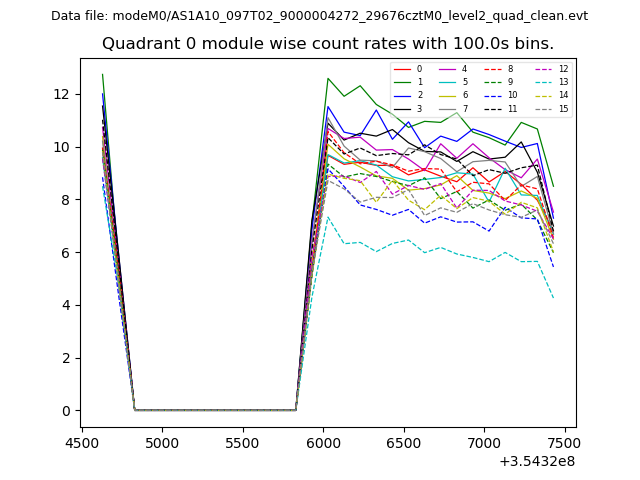 |
 |
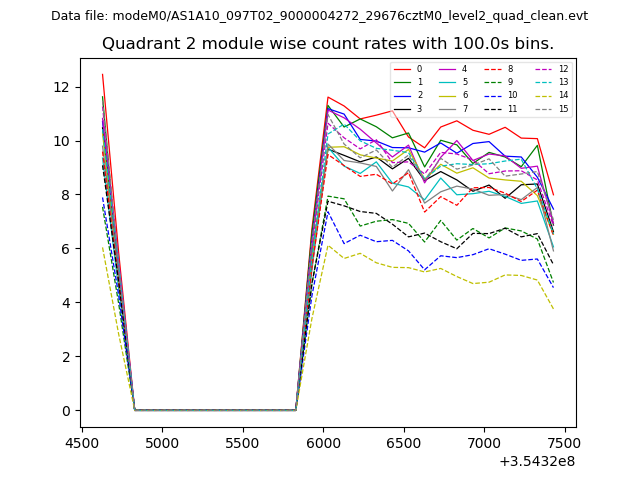
| Module-wise count rates for Quadrant B Data is divided into 100 sec bins |
 |
 |
| Module-wise count rates for Quadrant C Data is divided into 100 sec bins |
 |
 |
| Module-wise count rates for Quadrant D Data is divided into 100 sec bins |
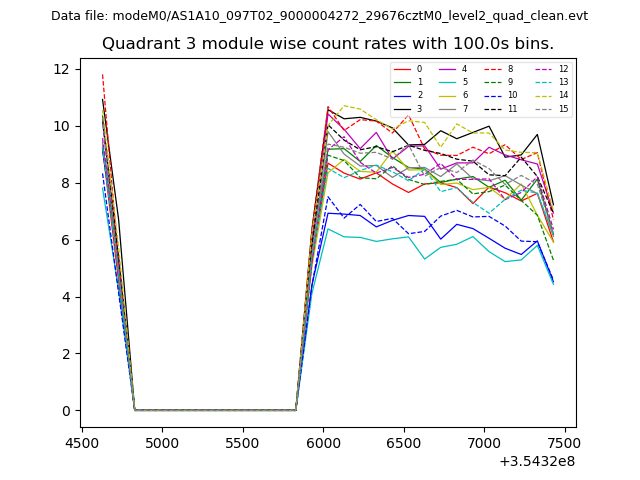 |
 |
| Parameter | Plot |
|---|---|
| CZT HV Monitor | 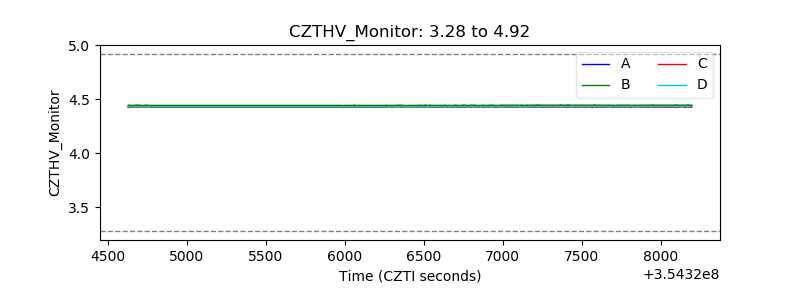 |
| D_VDD | 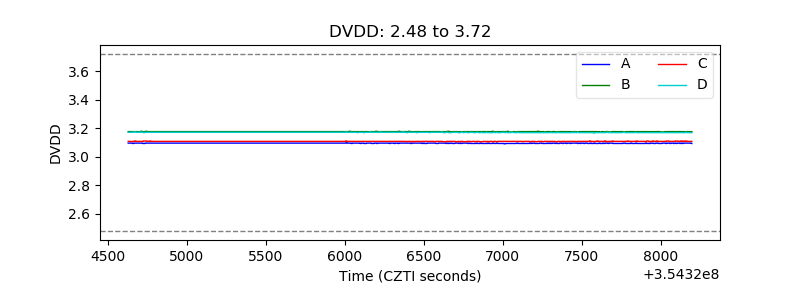 |
| Temperature 1 | 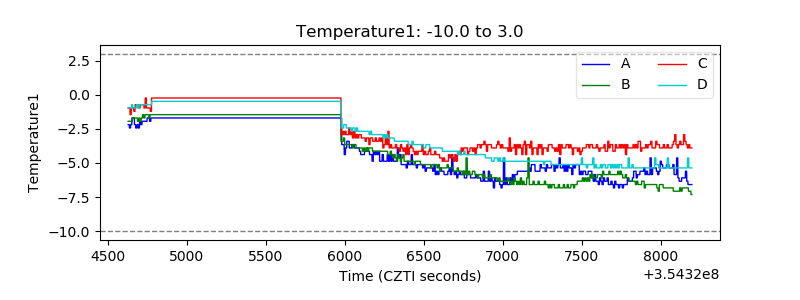 |
| Veto HV Monitor | 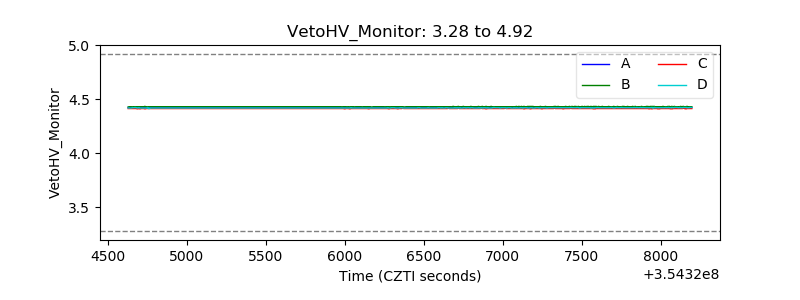 |
| Veto LLD | 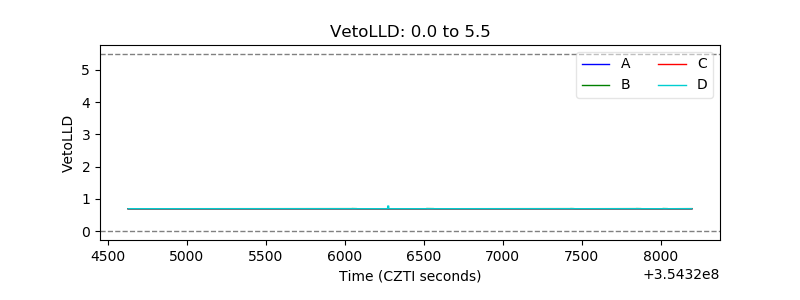 |
| Alpha Counter | 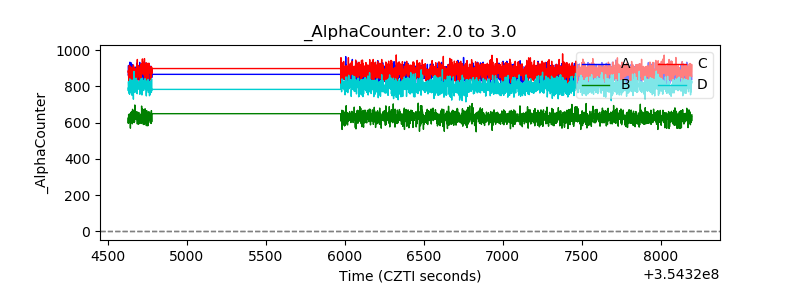 |
| _CPM_Rate | 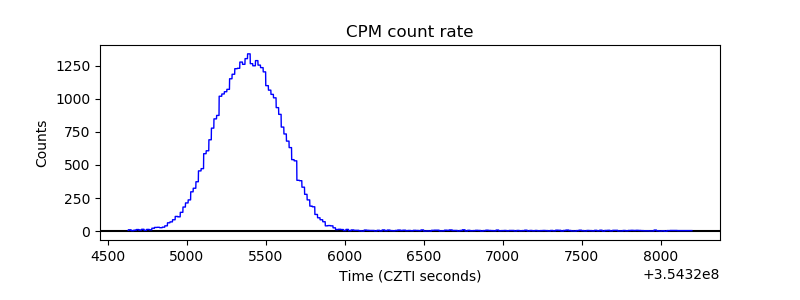 |
| CZT Counter | 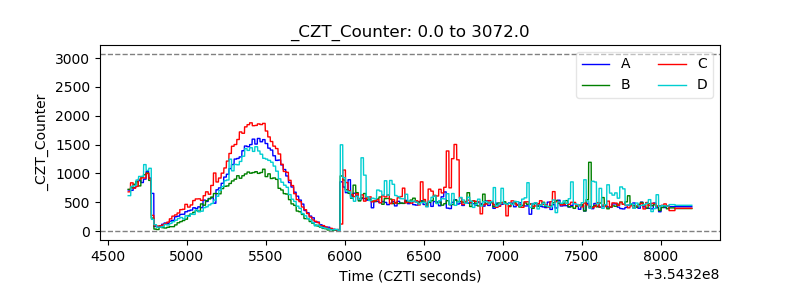 |
| +2.5 Volts monitor |  |
| +5 Volts monitor |  |
| _ROLL_ROT | 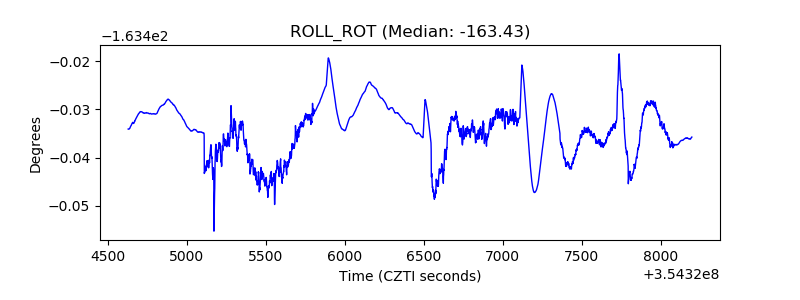 |
| _Roll_DEC | 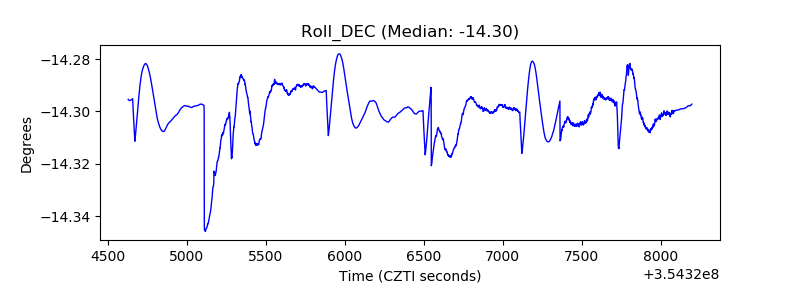 |
| _Roll_RA | 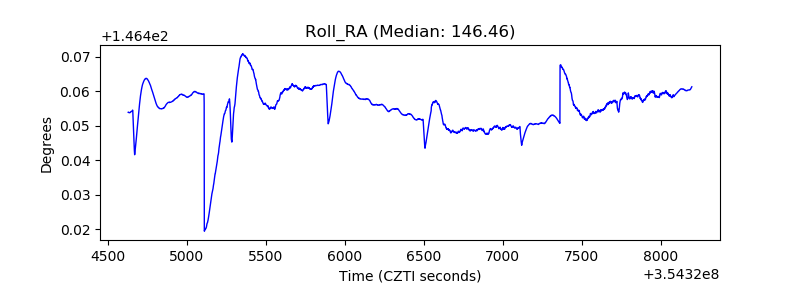 |
| Veto Counter | 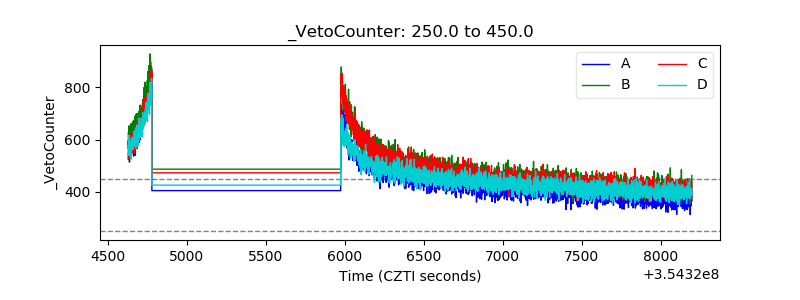 |