| Param | Original file | Final file |
|---|---|---|
| Filename | modeM0/AS1A10_093T01_9000004274_29676cztM0_level2.evt | modeM0/AS1A10_093T01_9000004274_29676cztM0_level2_quad_clean.evt |
| Size (bytes) | 302,999,040 | 51,448,320 |
| Size | 289.0 MB | 49.1 MB |
| Events in quadrant A | 1,790,083 | 337,575 |
| Events in quadrant B | 1,828,843 | 347,082 |
| Events in quadrant C | 2,012,935 | 314,079 |
| Events in quadrant D | 3,294,920 | 300,045 |
| Mode SS | |||
|---|---|---|---|
| Quadrant | BADHDUFLAG | Total packets | Discarded packets |
| A | 0 | 74 | 0 |
| B | 0 | 74 | 0 |
| C | 0 | 74 | 0 |
| D | 0 | 74 | 0 |
| Mode M9 | |||
|---|---|---|---|
| Quadrant | BADHDUFLAG | Total packets | Discarded packets |
| A | 0 | 10 | 0 |
| B | 0 | 10 | 0 |
| C | 0 | 10 | 0 |
| D | 0 | 10 | 0 |
| Mode M0 | |||
|---|---|---|---|
| Quadrant | BADHDUFLAG | Total packets | Discarded packets |
| A | 0 | 7607 | 1 |
| B | 0 | 7660 | 1 |
| C | 0 | 8223 | 1 |
| D | 0 | 12324 | 1 |
| Quadrant | Total seconds | Saturated seconds | Saturation percentage |
|---|---|---|---|
| A | 3659 | 69 | 1.885761% |
| B | 3659 | 77 | 2.104400% |
| C | 3659 | 206 | 5.629954% |
| D | 3659 | 282 | 7.707024% |
Noise dominated data is calculated using 1-second bins in cleaned event files. If a bin has >2000 counts, and if more than 50% of those come from <1% of pixels, then it is considered to be noise-dominated and hence unusable.
| Quadrant | # 1 sec bins | Bins with >0 counts | Bins with >2000 counts | High rate bins dominated by noise | Noise dominated (total time) | Noise dominated (detector-on time) | Marked lightcurve |
|---|---|---|---|---|---|---|---|
| A | 4614 | 3659 | 0 | 0 | 0.00% | 0.00% | 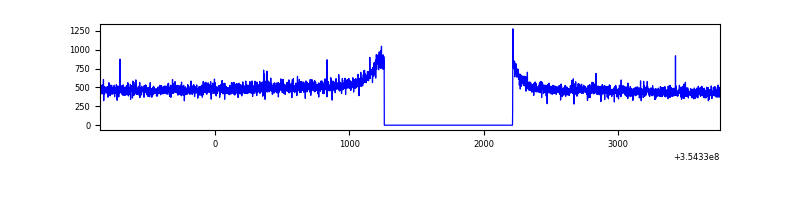 |
| B | 4614 | 3659 | 0 | 0 | 0.00% | 0.00% | 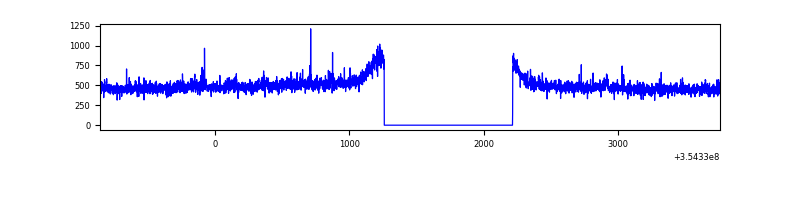 |
| C | 4614 | 3659 | 16 | 16 | 0.35% | 0.44% | 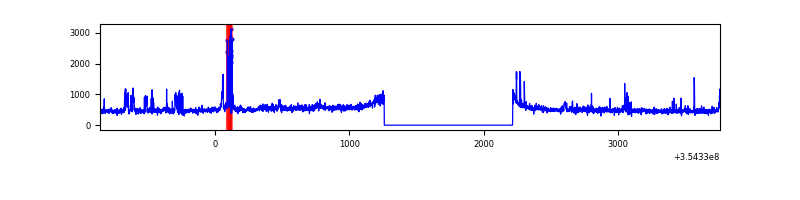 |
| D | 4614 | 3659 | 212 | 212 | 4.59% | 5.79% | 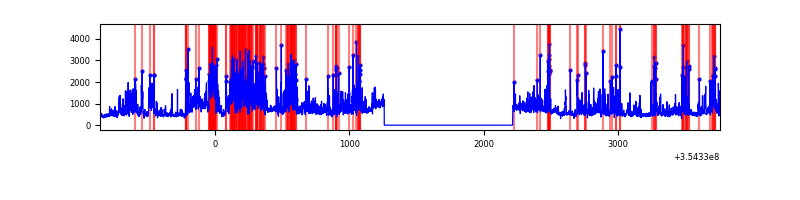 |
Top three noisy pixels from each quadrant. If the there are fewer than three noisy pixels in the level2.evt file, extra rows are filled as -1
| Pixel properties | Quadrant properties | ||||||
|---|---|---|---|---|---|---|---|
| Quadrant | DetID | PixID | Counts | Sigma | Mean | Median | Sigma |
| A | 13 | 254 | 6486 | 63.96 | 461 | 451 | 94.4 |
| A | 1 | 113 | 5399 | 52.44 | 461 | 451 | 94.4 |
| A | 3 | 137 | 4572 | 43.67 | 461 | 451 | 94.4 |
| B | 0 | 229 | 18269 | 198.87 | 458 | 447 | 89.6 |
| B | 12 | 111 | 11027 | 118.06 | 458 | 447 | 89.6 |
| B | 11 | 111 | 10185 | 108.66 | 458 | 447 | 89.6 |
| C | 3 | 233 | 137823 | 1332.33 | 436 | 439 | 103.1 |
| C | 14 | 238 | 105027 | 1014.28 | 436 | 439 | 103.1 |
| C | 14 | 254 | 46601 | 447.67 | 436 | 439 | 103.1 |
| D | 7 | 80 | 1047636 | 10042.91 | 436 | 422 | 104.3 |
| D | 7 | 238 | 352707 | 3378.46 | 436 | 422 | 104.3 |
| D | 8 | 195 | 174489 | 1669.32 | 436 | 422 | 104.3 |
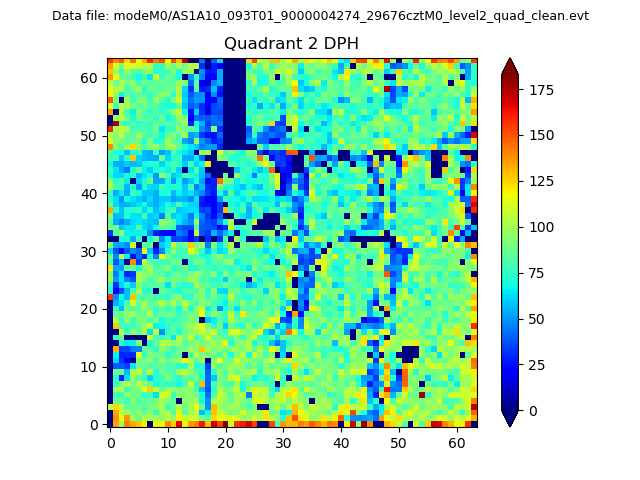
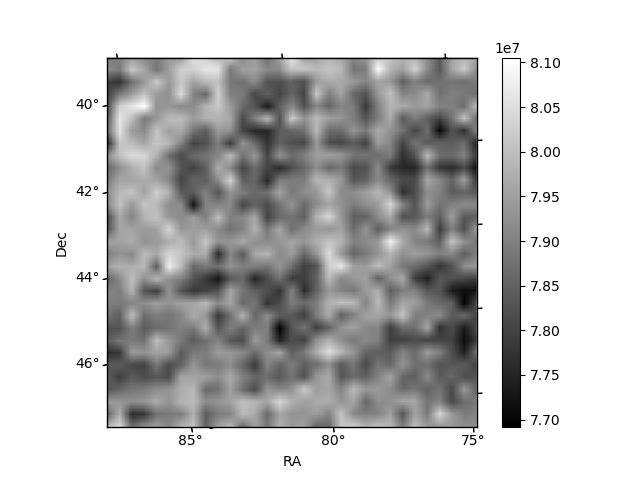
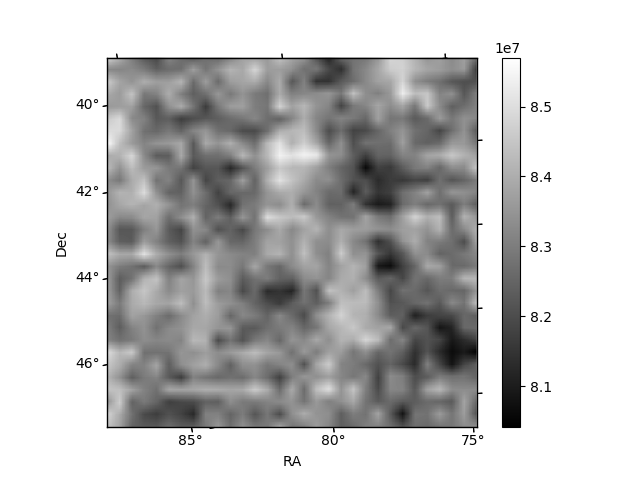
Histogram calculated using DETX and DETY for each event in the final _common_clean file
| Quadrant A | 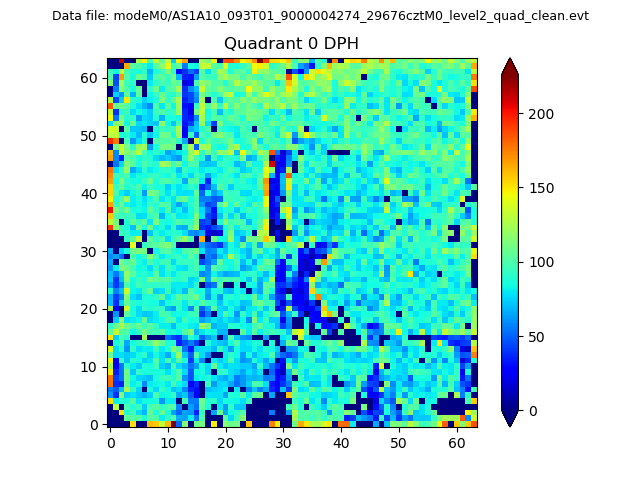 |
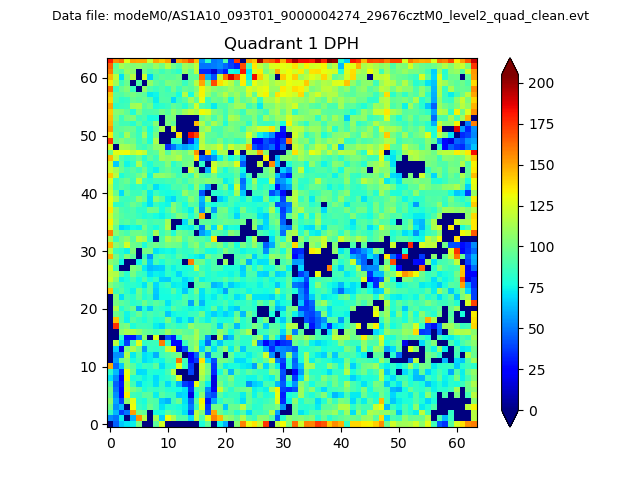 |
Quadrant B |
|---|---|---|---|
| Quadrant D | 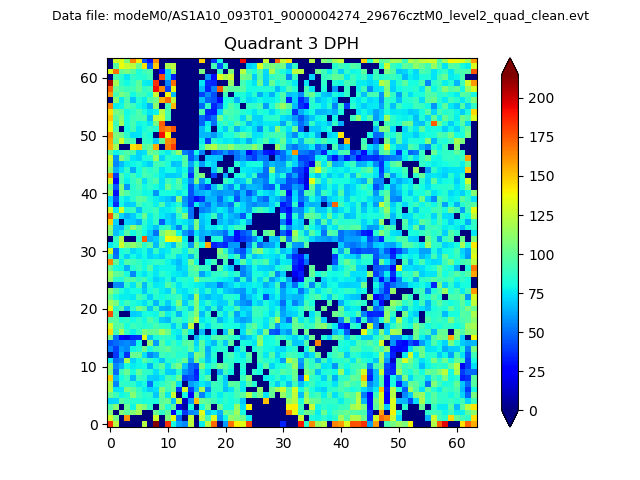 |
 |
Quadrant C |
| Plot type | Count rate plots | Images |
|---|---|---|
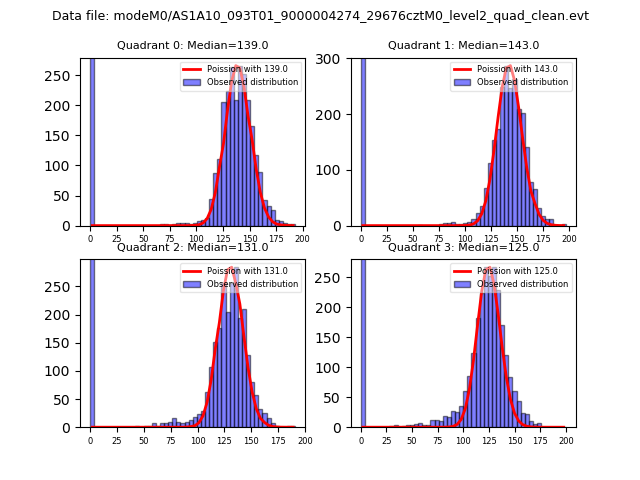
| Comparison with Poisson distribution Blue bars denote a histogram of data divided into 1 sec bins. Red curve is a Poisson curve with rate = median count rate of data. |
 |
 |
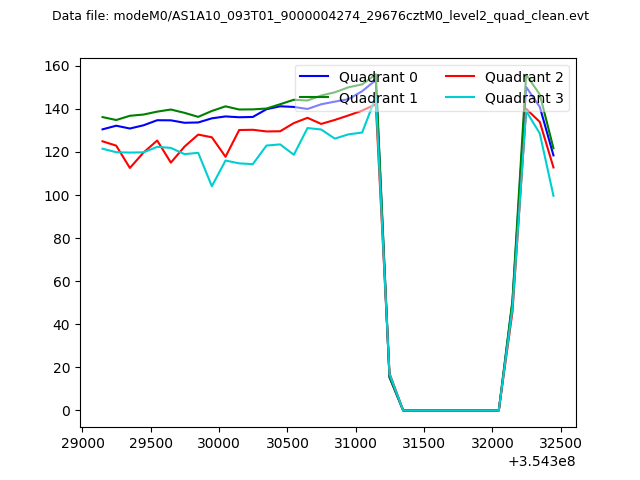
| Quadrant-wise count rates Data is divided into 100 sec bins |
 |
|
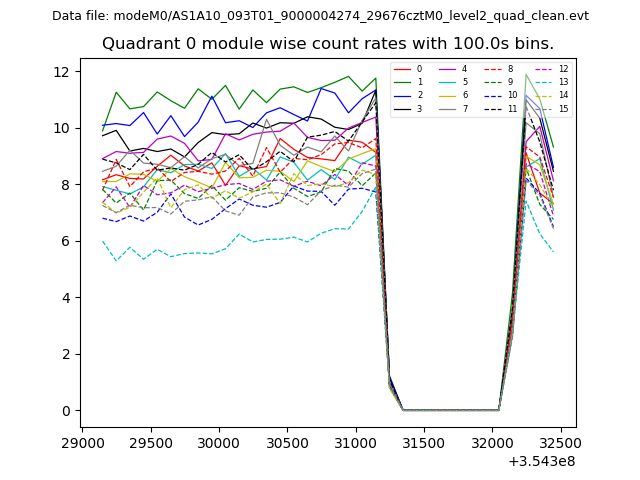
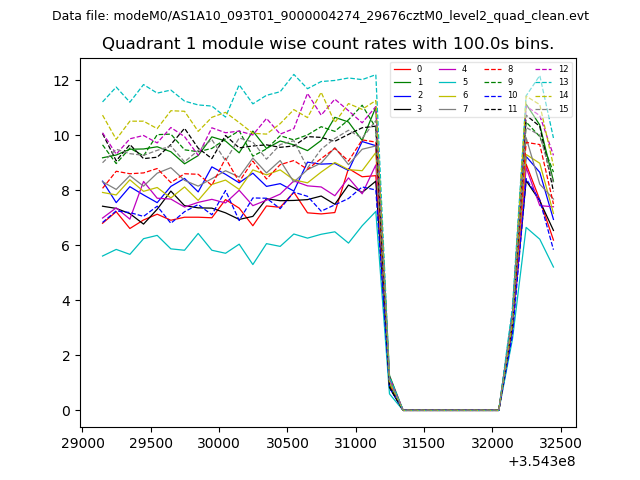
| Module-wise count rates for Quadrant A Data is divided into 100 sec bins |
 |
 |
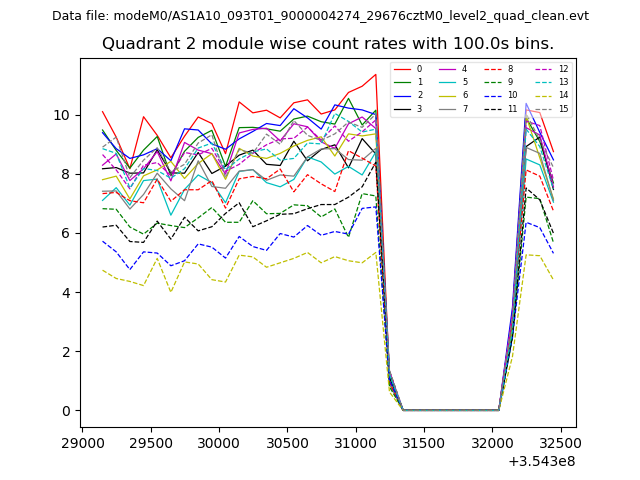
| Module-wise count rates for Quadrant B Data is divided into 100 sec bins |
 |
 |
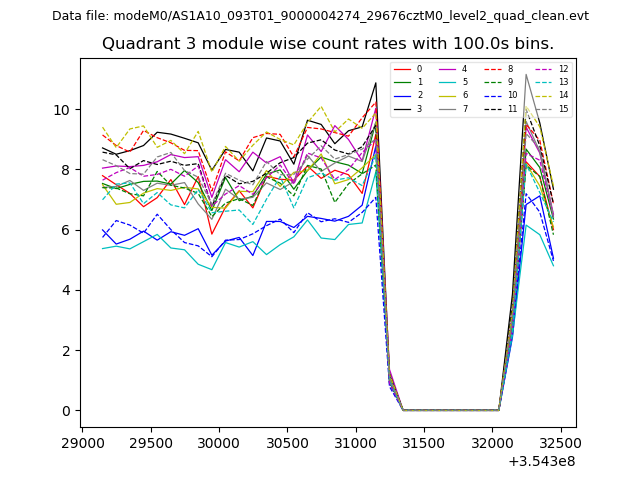
| Module-wise count rates for Quadrant C Data is divided into 100 sec bins |
 |
 |
| Module-wise count rates for Quadrant D Data is divided into 100 sec bins |
 |
 |
| Parameter | Plot |
|---|---|
| CZT HV Monitor | 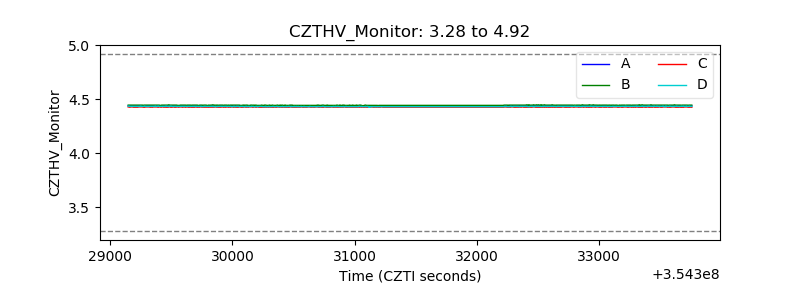 |
| D_VDD | 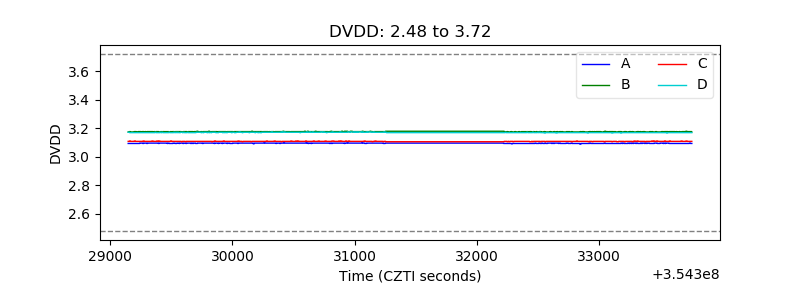 |
| Temperature 1 | 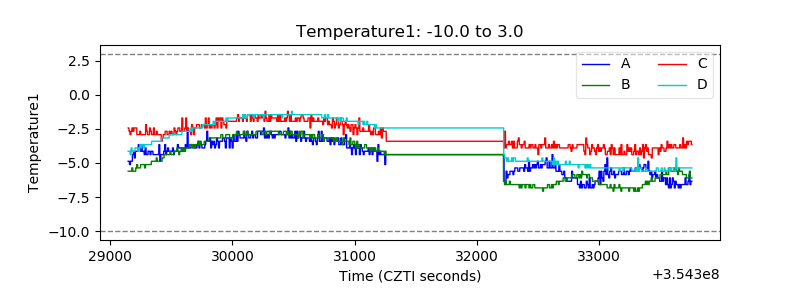 |
| Veto HV Monitor | 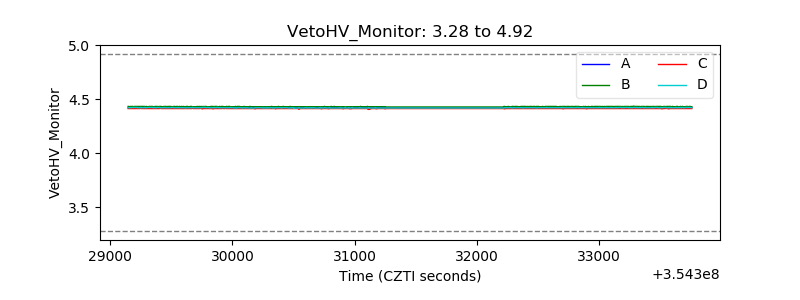 |
| Veto LLD |  |
| Alpha Counter | 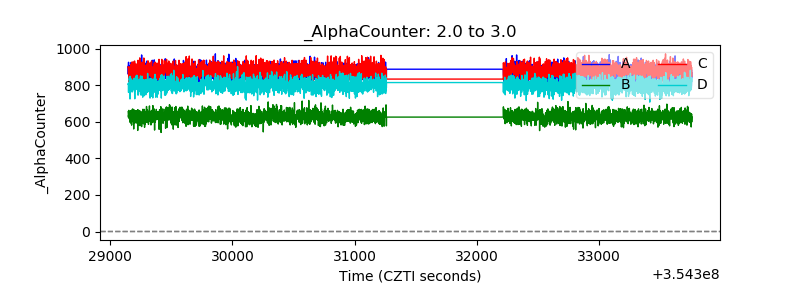 |
| _CPM_Rate | 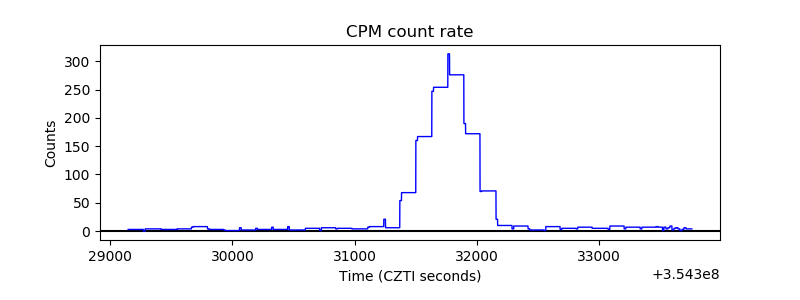 |
| CZT Counter | 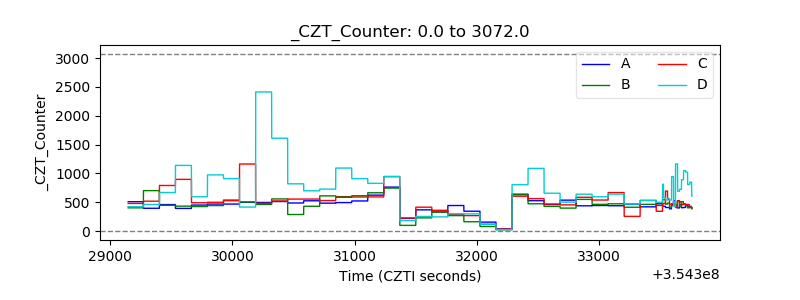 |
| +2.5 Volts monitor |  |
| +5 Volts monitor |  |
| _ROLL_ROT | 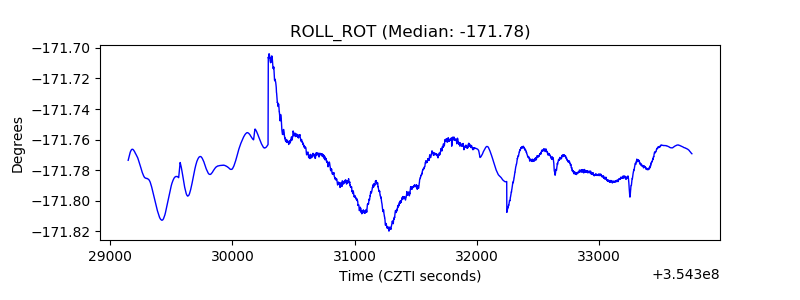 |
| _Roll_DEC | 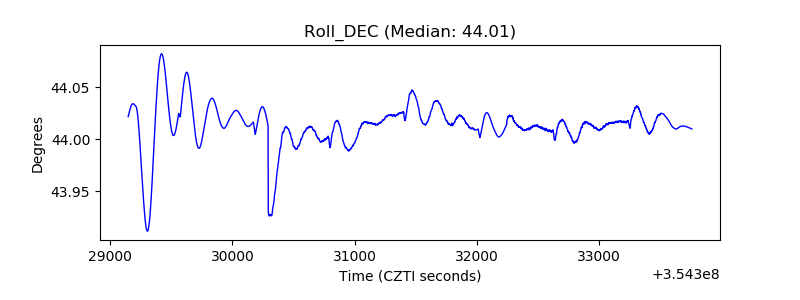 |
| _Roll_RA | 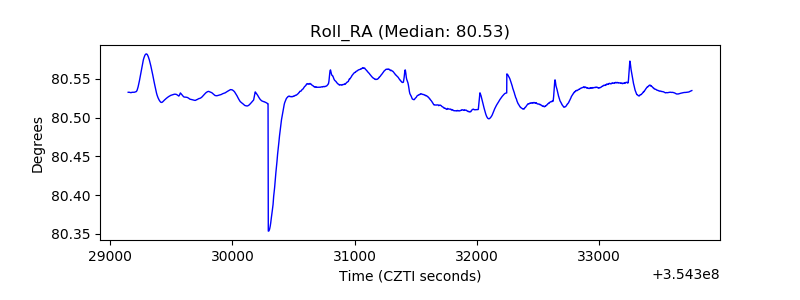 |
| Veto Counter | 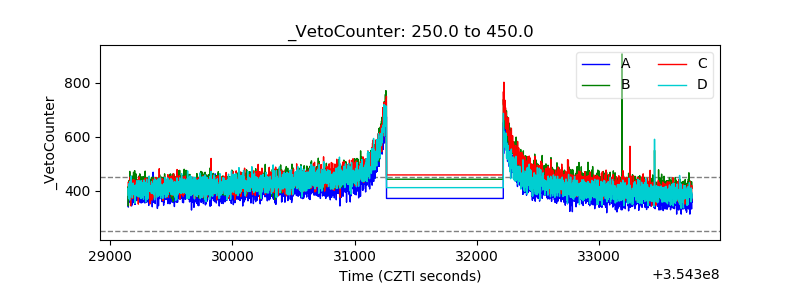 |