| Param | Original file | Final file |
|---|---|---|
| Filename | modeM0/AS1A10_093T01_9000004274_29682cztM0_level2.evt | modeM0/AS1A10_093T01_9000004274_29682cztM0_level2_quad_clean.evt |
| Size (bytes) | 928,768,320 | 150,246,720 |
| Size | 885.7 MB | 143.3 MB |
| Events in quadrant A | 5,192,792 | 979,860 |
| Events in quadrant B | 5,923,123 | 995,302 |
| Events in quadrant C | 5,623,175 | 926,159 |
| Events in quadrant D | 10,615,707 | 857,599 |
| Mode SS | |||
|---|---|---|---|
| Quadrant | BADHDUFLAG | Total packets | Discarded packets |
| A | 0 | 234 | 0 |
| B | 0 | 234 | 0 |
| C | 0 | 234 | 0 |
| D | 0 | 234 | 0 |
| Mode M9 | |||
|---|---|---|---|
| Quadrant | BADHDUFLAG | Total packets | Discarded packets |
| A | 0 | 10 | 0 |
| B | 0 | 10 | 0 |
| C | 0 | 10 | 0 |
| D | 0 | 10 | 0 |
| Mode M0 | |||
|---|---|---|---|
| Quadrant | BADHDUFLAG | Total packets | Discarded packets |
| A | 0 | 23181 | 2 |
| B | 0 | 24757 | 2 |
| C | 0 | 24061 | 2 |
| D | 0 | 39463 | 2 |
| Quadrant | Total seconds | Saturated seconds | Saturation percentage |
|---|---|---|---|
| A | 11431 | 113 | 0.988540% |
| B | 11432 | 179 | 1.565780% |
| C | 11432 | 205 | 1.793212% |
| D | 11432 | 1086 | 9.499650% |
Noise dominated data is calculated using 1-second bins in cleaned event files. If a bin has >2000 counts, and if more than 50% of those come from <1% of pixels, then it is considered to be noise-dominated and hence unusable.
| Quadrant | # 1 sec bins | Bins with >0 counts | Bins with >2000 counts | High rate bins dominated by noise | Noise dominated (total time) | Noise dominated (detector-on time) | Marked lightcurve |
|---|---|---|---|---|---|---|---|
| A | 12506 | 11432 | 0 | 0 | 0.00% | 0.00% | 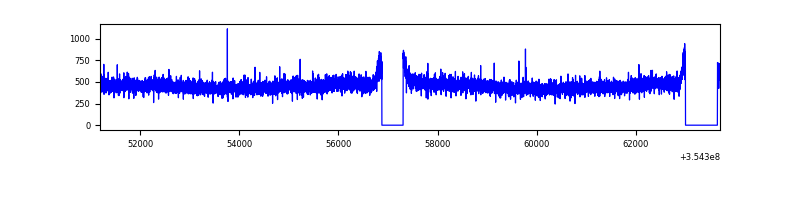 |
| B | 12507 | 11434 | 51 | 51 | 0.41% | 0.45% | 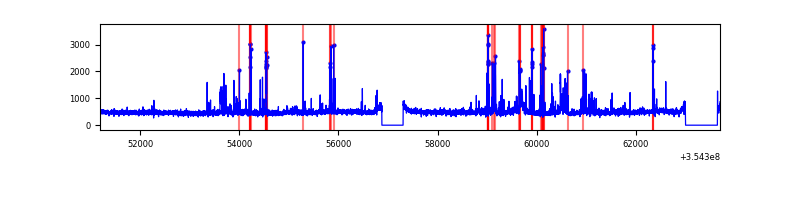 |
| C | 12507 | 11434 | 22 | 22 | 0.18% | 0.19% | 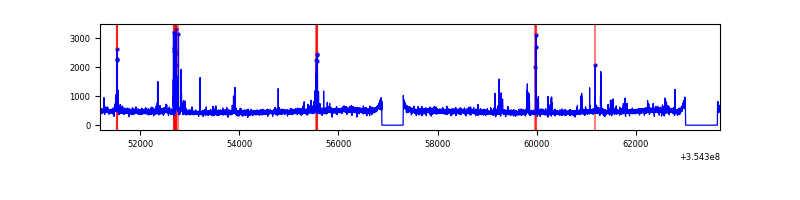 |
| D | 12507 | 11432 | 950 | 950 | 7.60% | 8.31% | 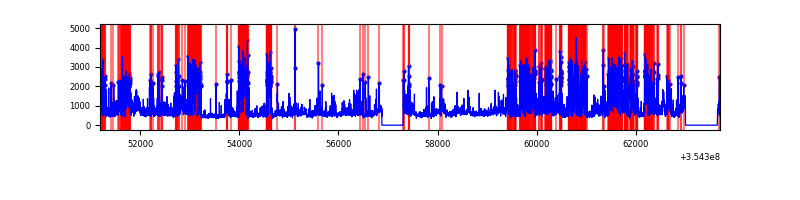 |
Top three noisy pixels from each quadrant. If the there are fewer than three noisy pixels in the level2.evt file, extra rows are filled as -1
| Pixel properties | Quadrant properties | ||||||
|---|---|---|---|---|---|---|---|
| Quadrant | DetID | PixID | Counts | Sigma | Mean | Median | Sigma |
| A | 13 | 254 | 22260 | 77.29 | 1344 | 1313 | 271.0 |
| A | 3 | 137 | 13467 | 44.85 | 1344 | 1313 | 271.0 |
| A | 0 | 226 | 11442 | 37.37 | 1344 | 1313 | 271.0 |
| B | 0 | 229 | 528786 | 2080.15 | 1335 | 1300 | 253.6 |
| B | 10 | 245 | 48976 | 188.01 | 1335 | 1300 | 253.6 |
| B | 0 | 189 | 40813 | 155.82 | 1335 | 1300 | 253.6 |
| C | 14 | 238 | 224065 | 742.75 | 1286 | 1292 | 299.9 |
| C | 10 | 22 | 187295 | 620.15 | 1286 | 1292 | 299.9 |
| C | 7 | 247 | 70844 | 231.89 | 1286 | 1292 | 299.9 |
| D | 7 | 80 | 4046481 | 13493.8 | 1258 | 1223 | 299.8 |
| D | 8 | 195 | 758246 | 2525.21 | 1258 | 1223 | 299.8 |
| D | 7 | 238 | 698461 | 2325.78 | 1258 | 1223 | 299.8 |
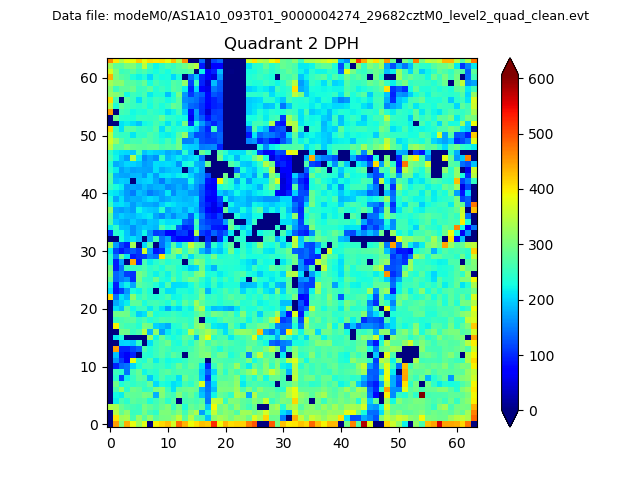
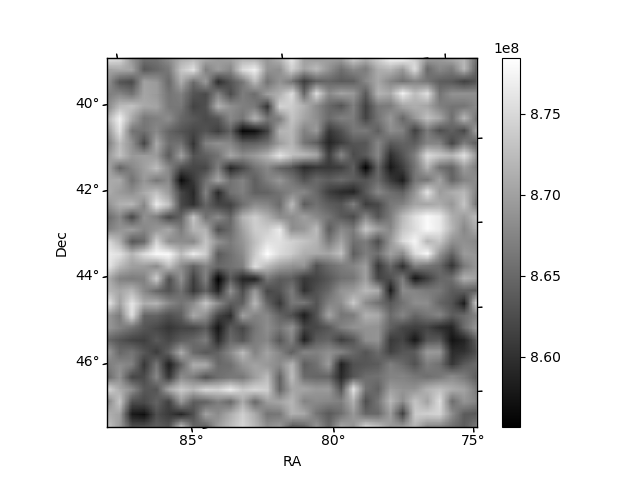
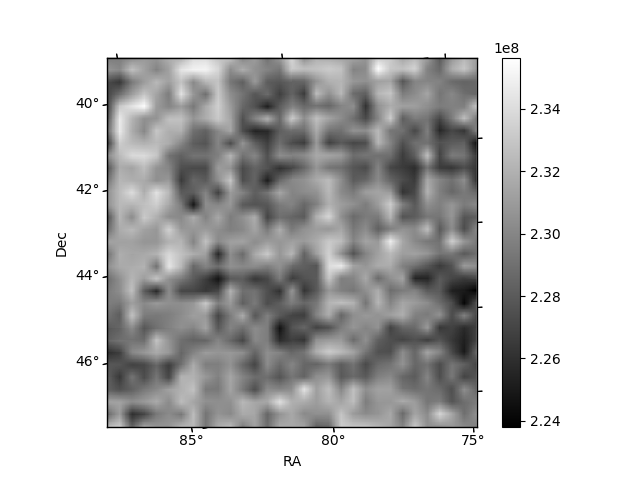
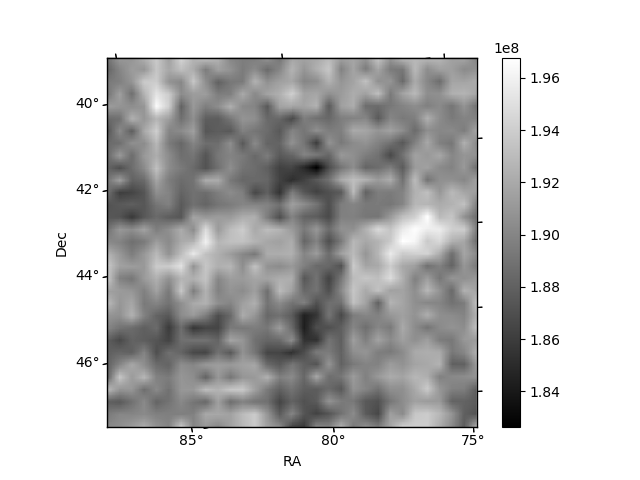
Histogram calculated using DETX and DETY for each event in the final _common_clean file
| Quadrant A | 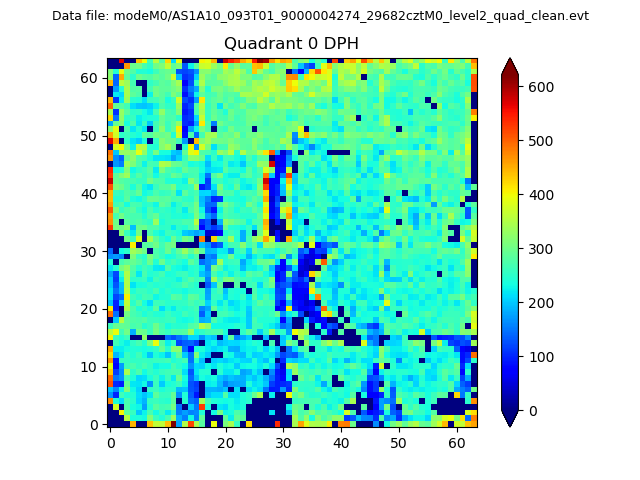 |
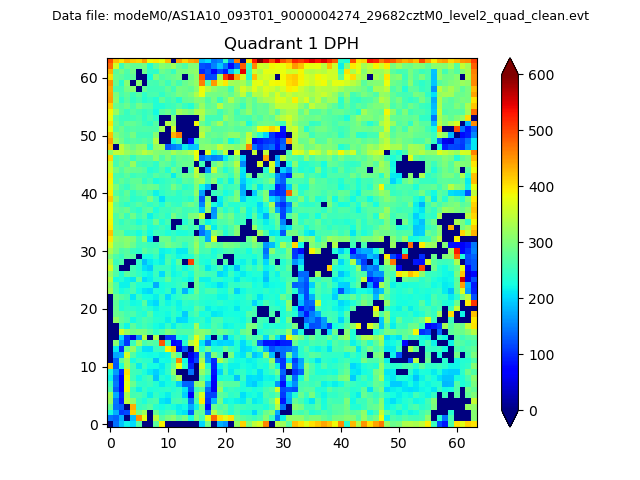 |
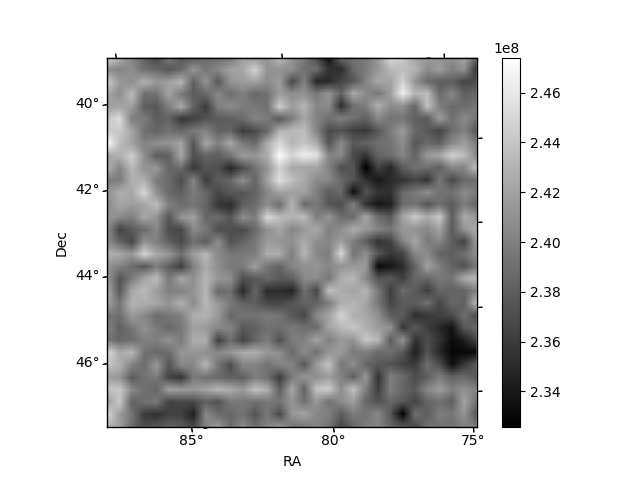
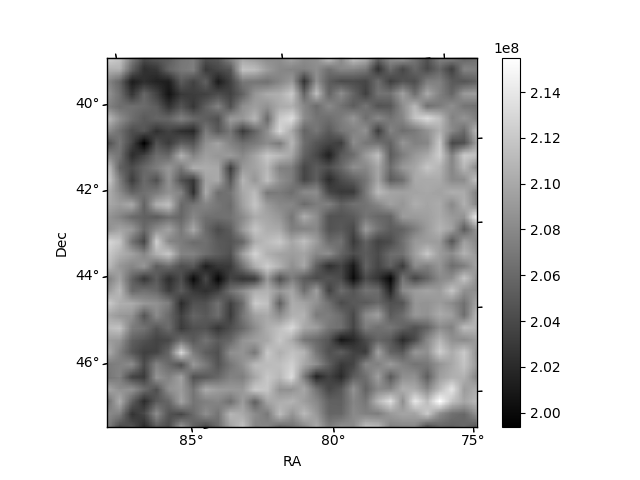
Quadrant B |
|---|---|---|---|
| Quadrant D | 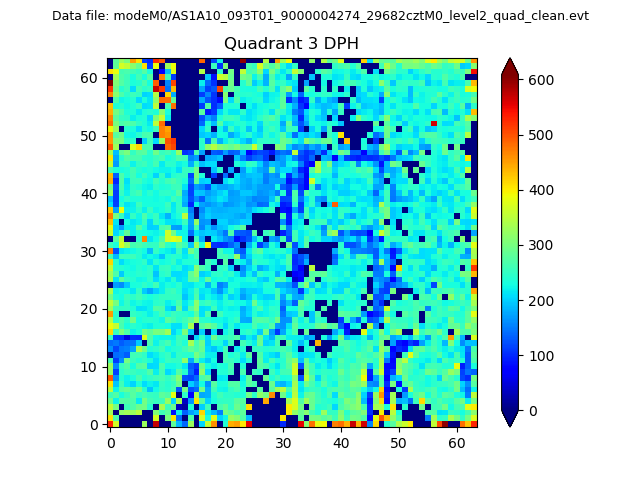 |
 |
Quadrant C |
| Plot type | Count rate plots | Images |
|---|---|---|
| Comparison with Poisson distribution Blue bars denote a histogram of data divided into 1 sec bins. Red curve is a Poisson curve with rate = median count rate of data. |
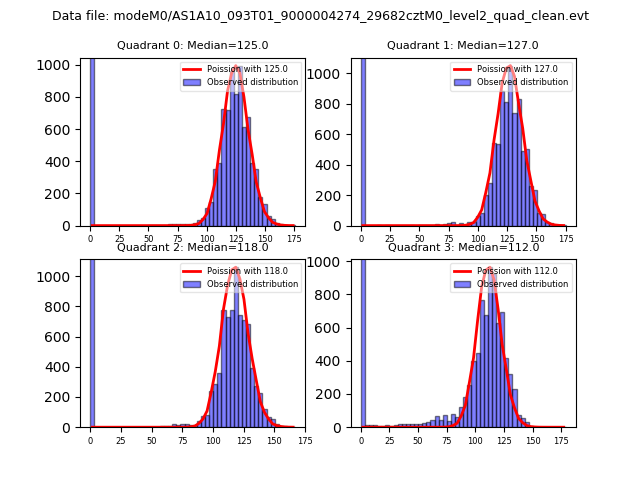 |
 |
| Quadrant-wise count rates Data is divided into 100 sec bins |
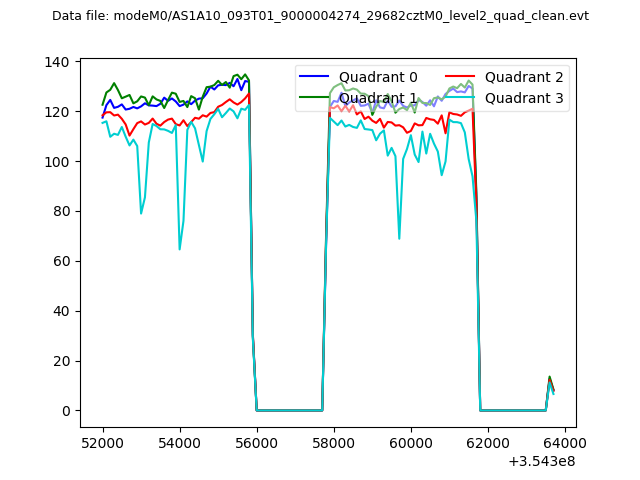 |
|
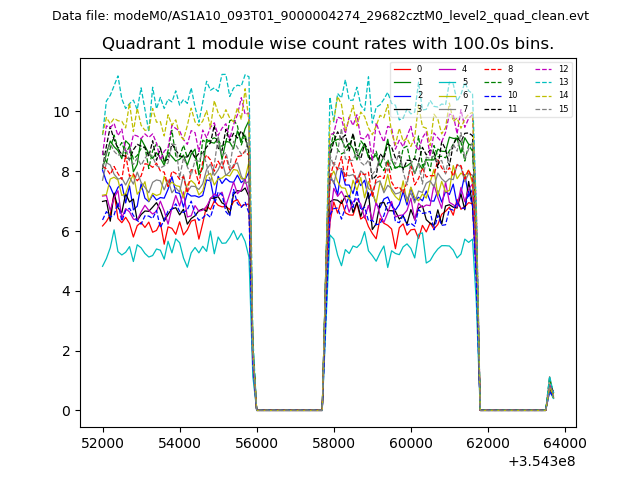
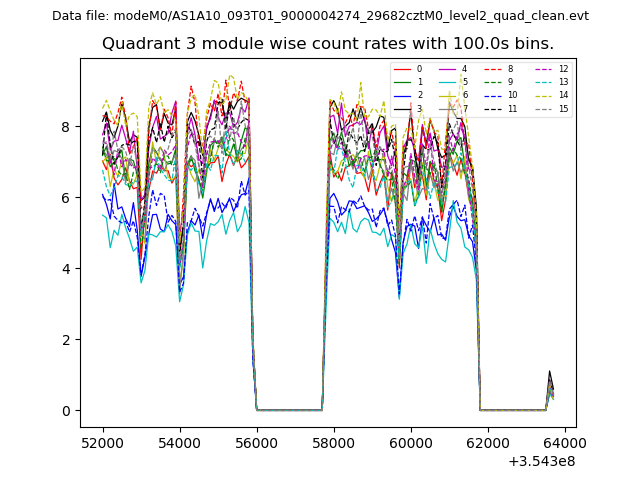
| Module-wise count rates for Quadrant A Data is divided into 100 sec bins |
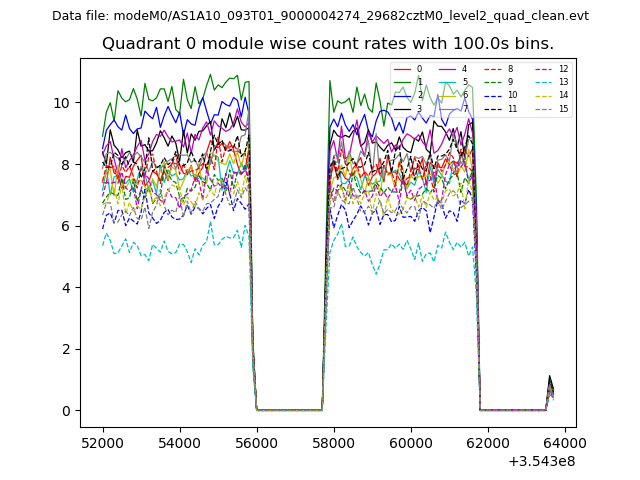 |
 |
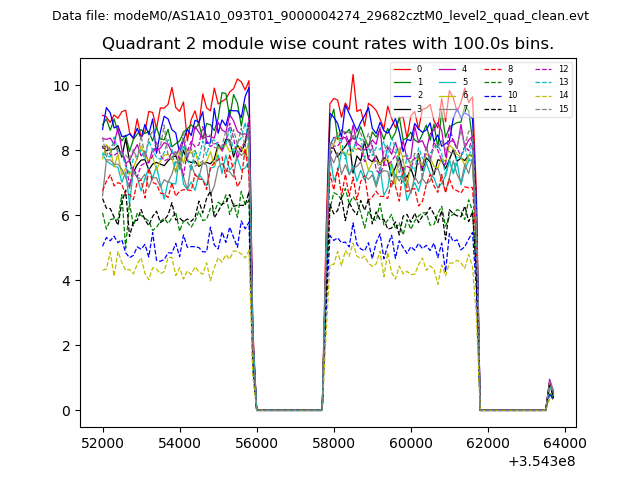
| Module-wise count rates for Quadrant B Data is divided into 100 sec bins |
 |
 |
| Module-wise count rates for Quadrant C Data is divided into 100 sec bins |
 |
 |
| Module-wise count rates for Quadrant D Data is divided into 100 sec bins |
 |
 |
| Parameter | Plot |
|---|---|
| CZT HV Monitor | 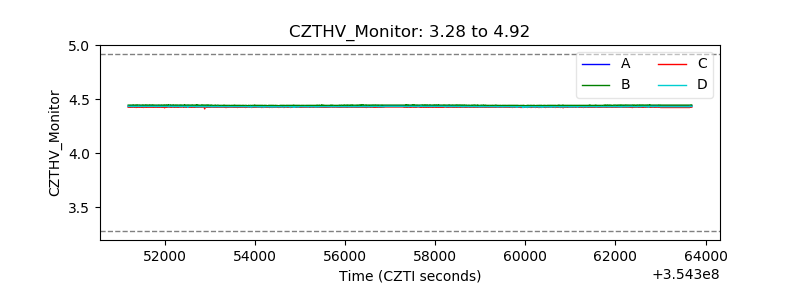 |
| D_VDD | 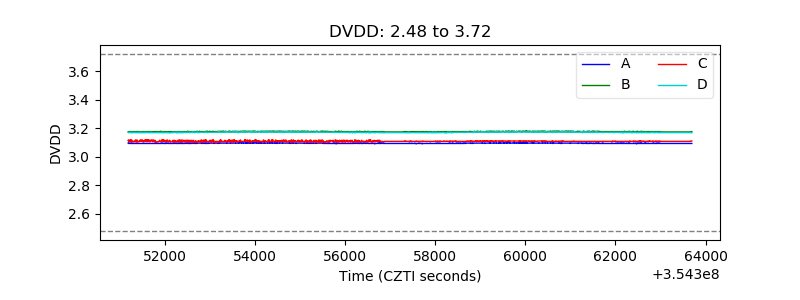 |
| Temperature 1 | 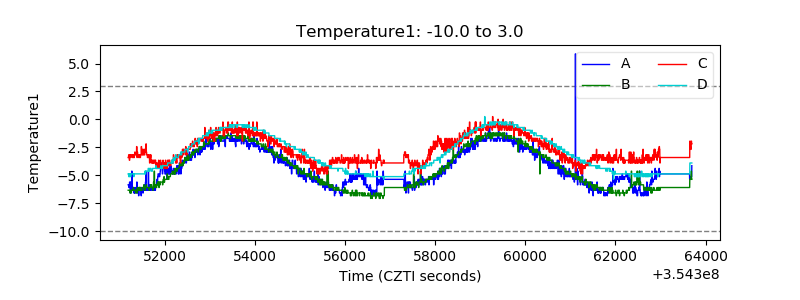 |
| Veto HV Monitor | 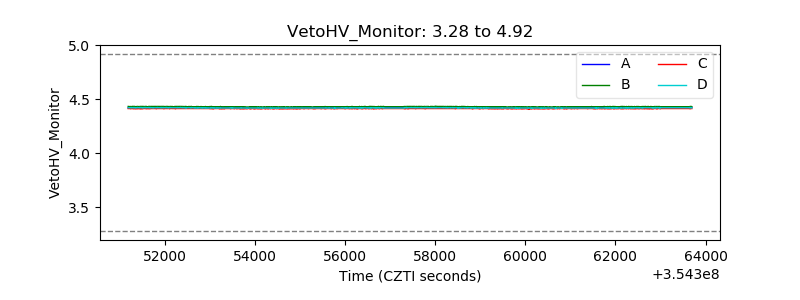 |
| Veto LLD | 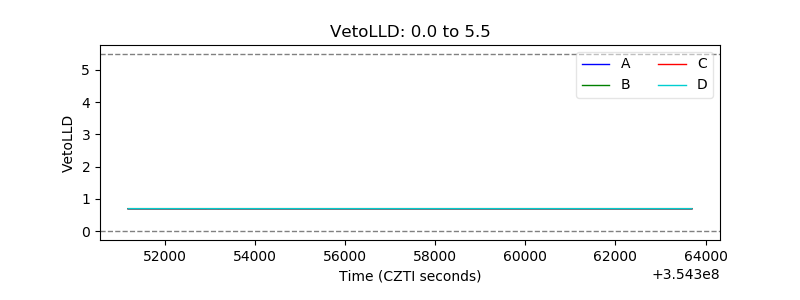 |
| Alpha Counter | 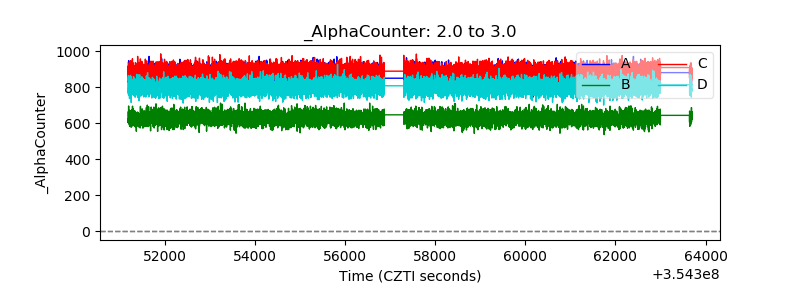 |
| _CPM_Rate | 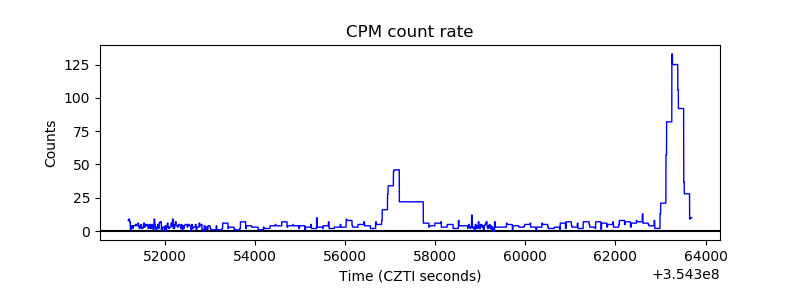 |
| CZT Counter | 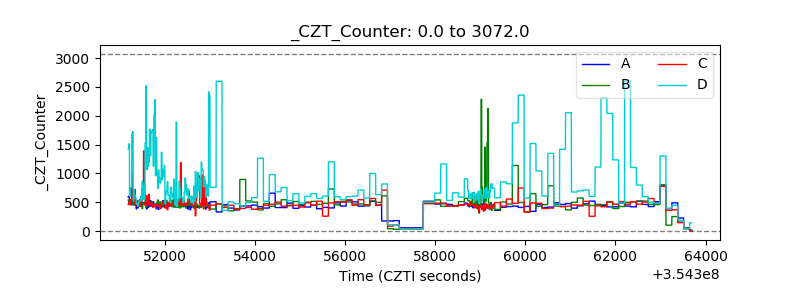 |
| +2.5 Volts monitor |  |
| +5 Volts monitor |  |
| _ROLL_ROT | 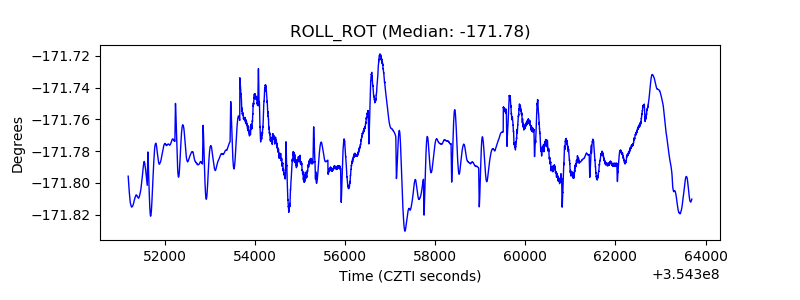 |
| _Roll_DEC | 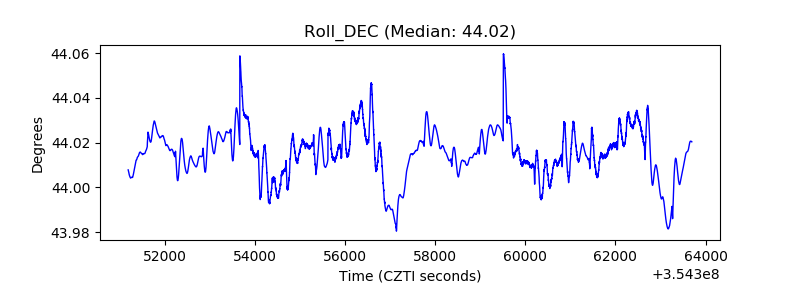 |
| _Roll_RA | 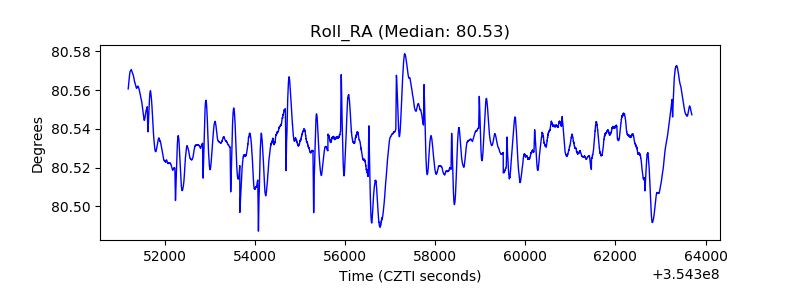 |
| Veto Counter | 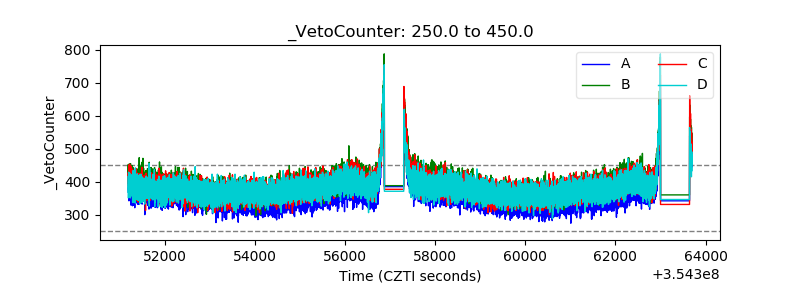 |