| Param | Original file | Final file |
|---|---|---|
| Filename | modeM0/AS1A10_093T01_9000004274_29683cztM0_level2.evt | modeM0/AS1A10_093T01_9000004274_29683cztM0_level2_quad_clean.evt |
| Size (bytes) | 960,145,920 | 174,876,480 |
| Size | 915.7 MB | 166.8 MB |
| Events in quadrant A | 5,814,244 | 1,158,270 |
| Events in quadrant B | 6,132,659 | 1,175,945 |
| Events in quadrant C | 6,174,145 | 1,084,383 |
| Events in quadrant D | 10,125,356 | 1,027,611 |
| Mode SS | |||
|---|---|---|---|
| Quadrant | BADHDUFLAG | Total packets | Discarded packets |
| A | 0 | 250 | 0 |
| B | 0 | 250 | 0 |
| C | 0 | 250 | 0 |
| D | 0 | 250 | 0 |
| Mode M9 | |||
|---|---|---|---|
| Quadrant | BADHDUFLAG | Total packets | Discarded packets |
| A | 0 | 21 | 0 |
| B | 0 | 22 | 0 |
| C | 0 | 22 | 0 |
| D | 0 | 22 | 0 |
| Mode M0 | |||
|---|---|---|---|
| Quadrant | BADHDUFLAG | Total packets | Discarded packets |
| A | 0 | 25484 | 3 |
| B | 0 | 26154 | 3 |
| C | 0 | 26235 | 3 |
| D | 0 | 38008 | 3 |
| Quadrant | Total seconds | Saturated seconds | Saturation percentage |
|---|---|---|---|
| A | 12298 | 79 | 0.642381% |
| B | 12298 | 96 | 0.780615% |
| C | 12298 | 281 | 2.284924% |
| D | 12298 | 1051 | 8.546105% |
Noise dominated data is calculated using 1-second bins in cleaned event files. If a bin has >2000 counts, and if more than 50% of those come from <1% of pixels, then it is considered to be noise-dominated and hence unusable.
| Quadrant | # 1 sec bins | Bins with >0 counts | Bins with >2000 counts | High rate bins dominated by noise | Noise dominated (total time) | Noise dominated (detector-on time) | Marked lightcurve |
|---|---|---|---|---|---|---|---|
| A | 14048 | 12299 | 11 | 11 | 0.08% | 0.09% | 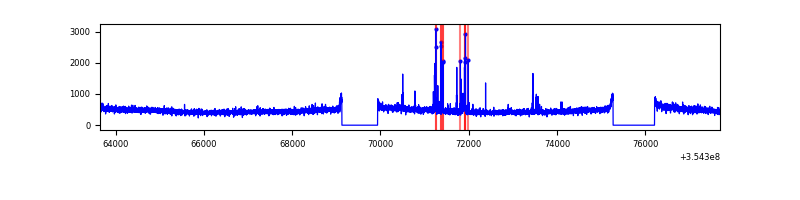 |
| B | 14048 | 12299 | 25 | 25 | 0.18% | 0.20% | 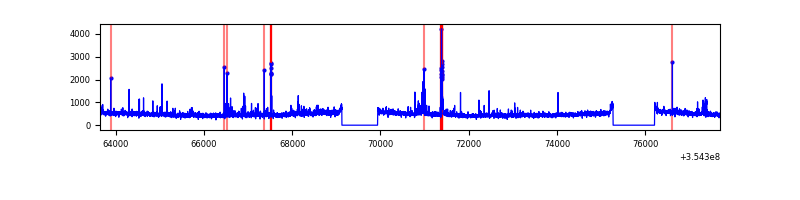 |
| C | 14048 | 12299 | 21 | 21 | 0.15% | 0.17% | 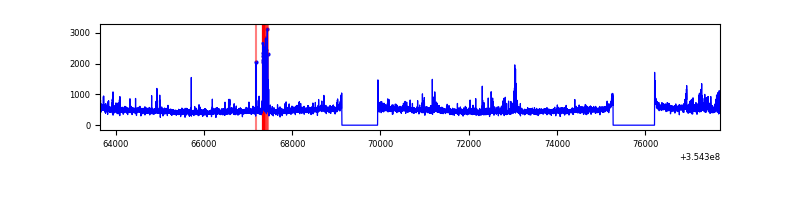 |
| D | 14048 | 12299 | 934 | 934 | 6.65% | 7.59% | 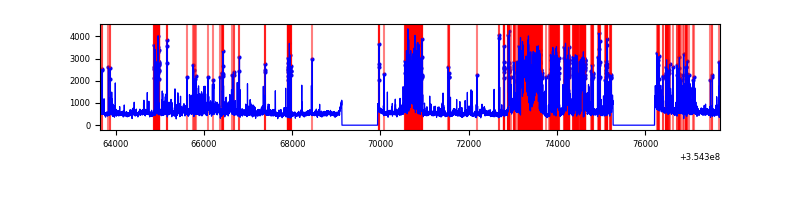 |
Top three noisy pixels from each quadrant. If the there are fewer than three noisy pixels in the level2.evt file, extra rows are filled as -1
| Pixel properties | Quadrant properties | ||||||
|---|---|---|---|---|---|---|---|
| Quadrant | DetID | PixID | Counts | Sigma | Mean | Median | Sigma |
| A | 0 | 13 | 106490 | 354.71 | 1472 | 1440 | 296.2 |
| A | 13 | 254 | 24660 | 78.4 | 1472 | 1440 | 296.2 |
| A | 12 | 16 | 18275 | 56.84 | 1472 | 1440 | 296.2 |
| B | 0 | 229 | 199603 | 716.67 | 1462 | 1424 | 276.5 |
| B | 10 | 245 | 90207 | 321.06 | 1462 | 1424 | 276.5 |
| B | 12 | 111 | 34095 | 118.15 | 1462 | 1424 | 276.5 |
| C | 14 | 238 | 278601 | 854.99 | 1399 | 1410 | 324.2 |
| C | 3 | 233 | 172081 | 526.43 | 1399 | 1410 | 324.2 |
| C | 10 | 22 | 143434 | 438.07 | 1399 | 1410 | 324.2 |
| D | 7 | 80 | 3428685 | 10562.11 | 1376 | 1339 | 324.5 |
| D | 8 | 195 | 820051 | 2523.04 | 1376 | 1339 | 324.5 |
| D | 2 | 250 | 168877 | 516.3 | 1376 | 1339 | 324.5 |
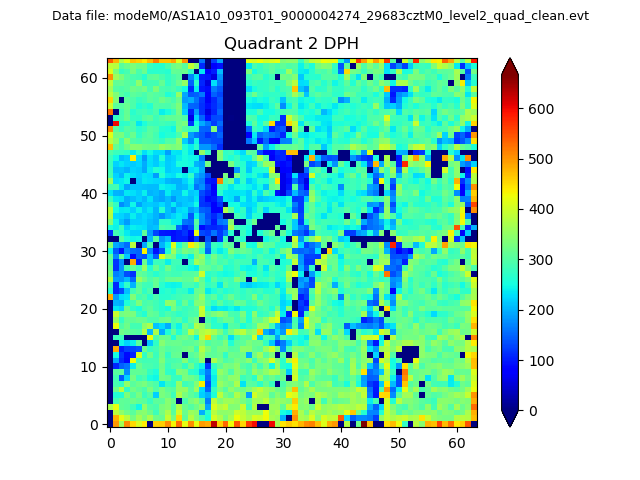
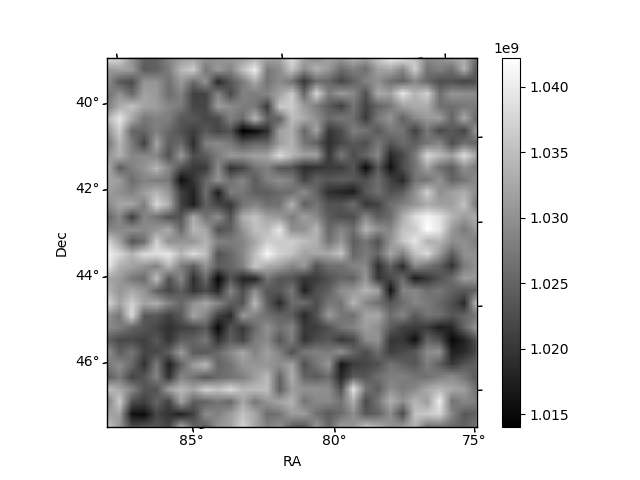
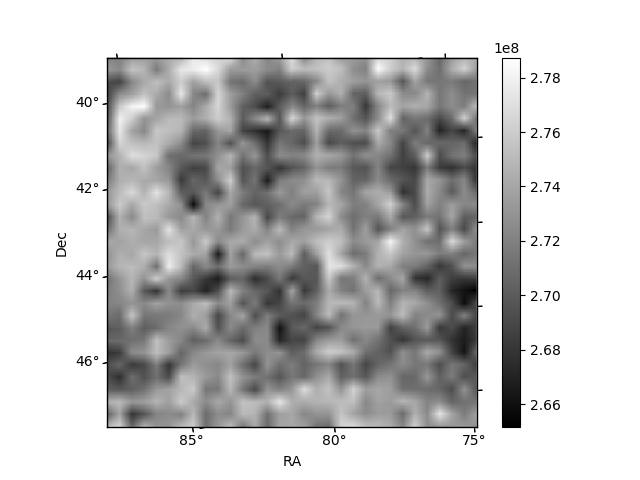
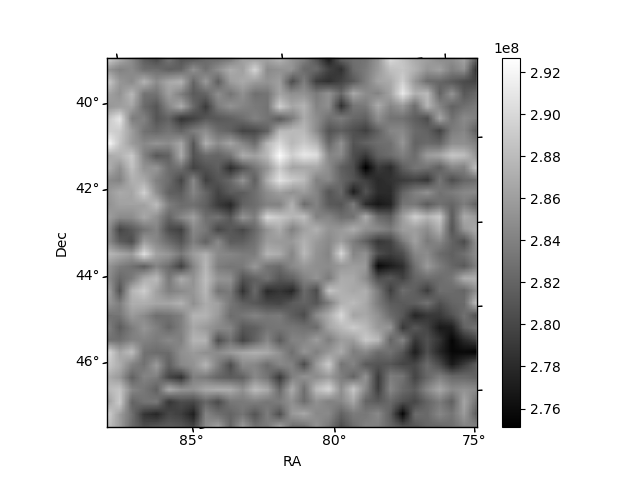
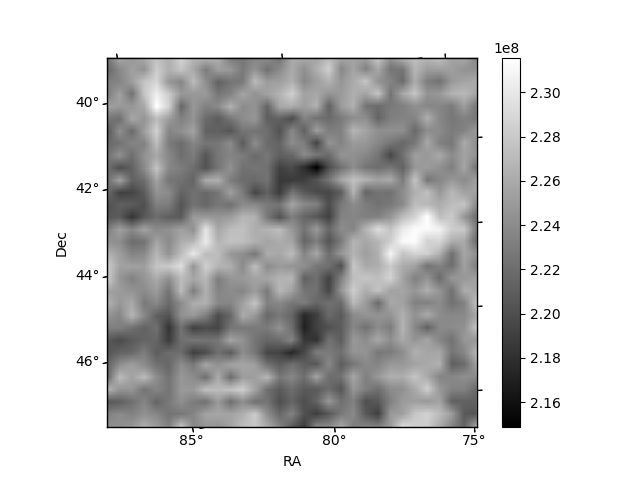
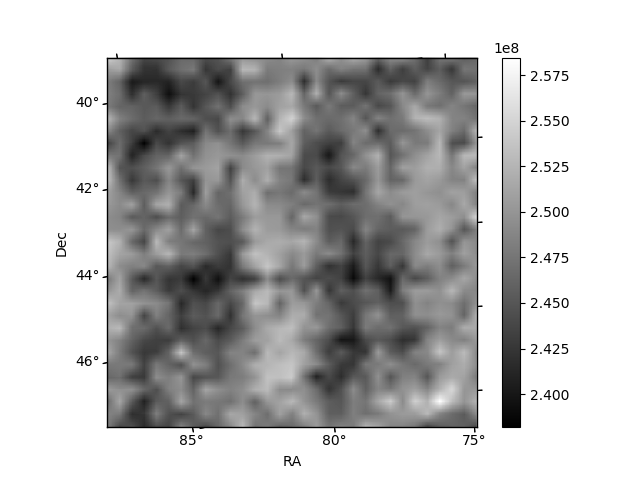
Histogram calculated using DETX and DETY for each event in the final _common_clean file
| Quadrant A | 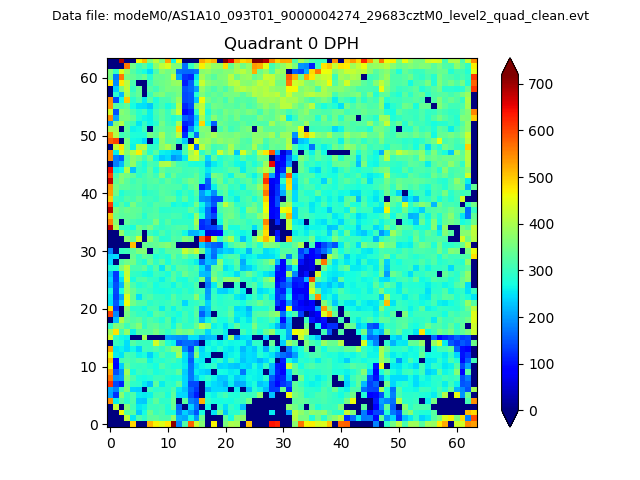 |
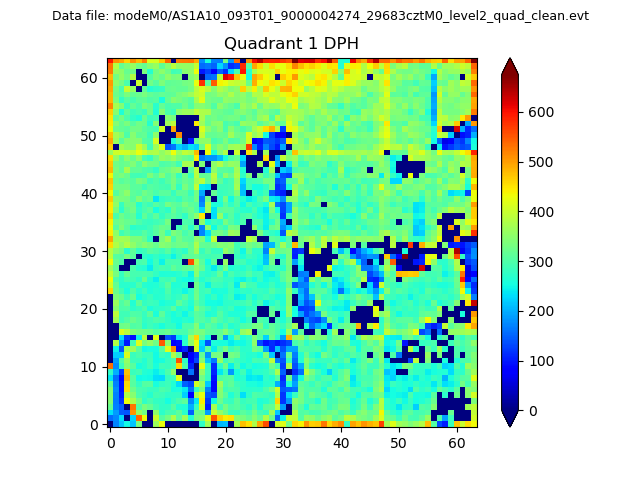 |
Quadrant B |
|---|---|---|---|
| Quadrant D | 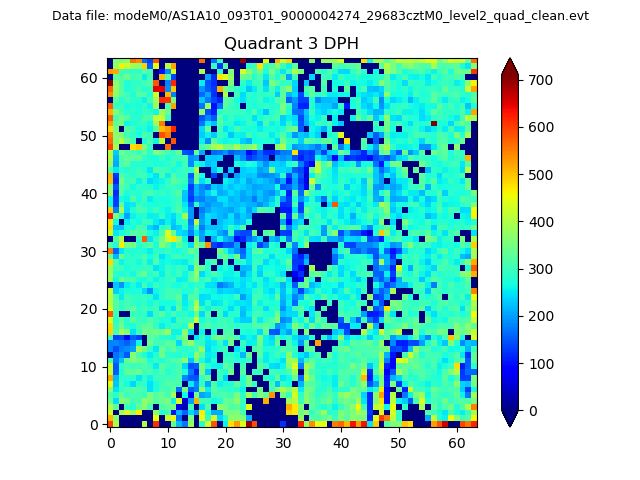 |
 |
Quadrant C |
| Plot type | Count rate plots | Images |
|---|---|---|
| Comparison with Poisson distribution Blue bars denote a histogram of data divided into 1 sec bins. Red curve is a Poisson curve with rate = median count rate of data. |
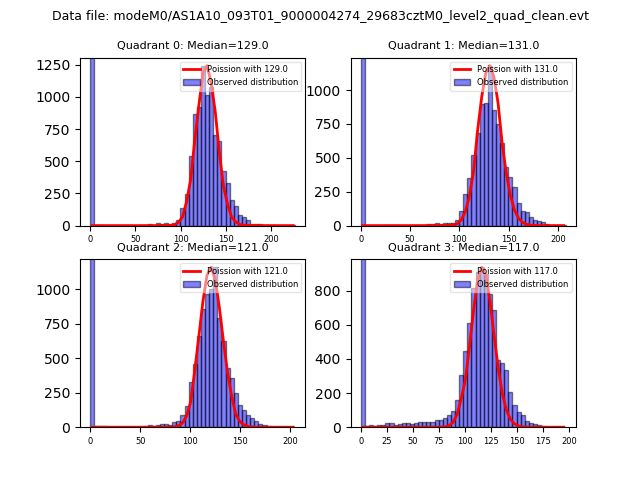 |
 |
| Quadrant-wise count rates Data is divided into 100 sec bins |
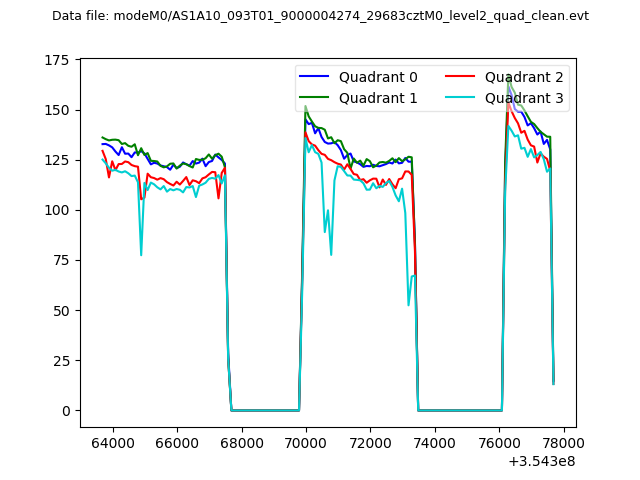 |
|
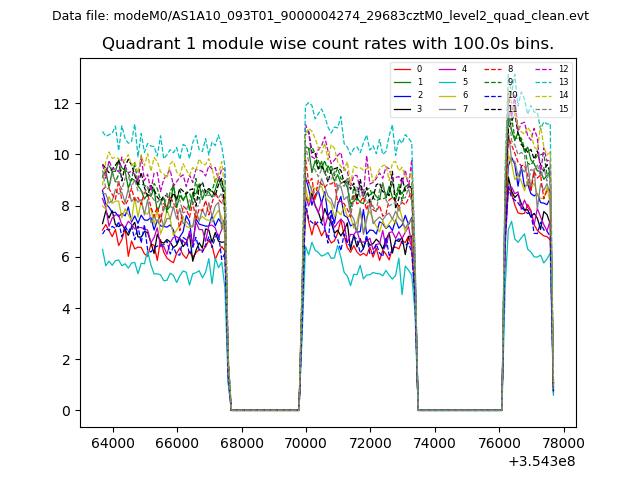
| Module-wise count rates for Quadrant A Data is divided into 100 sec bins |
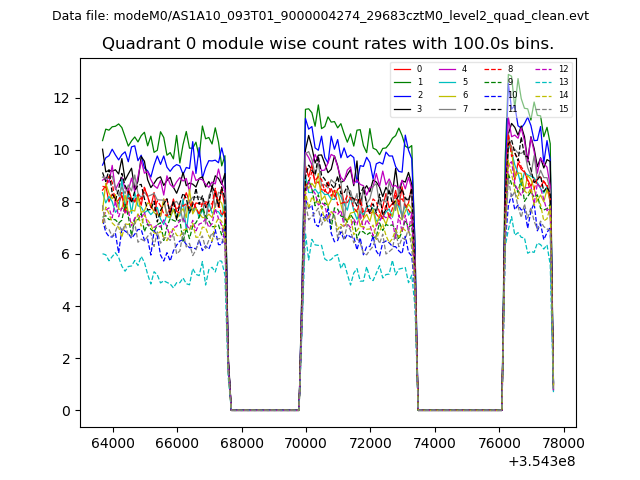 |
 |
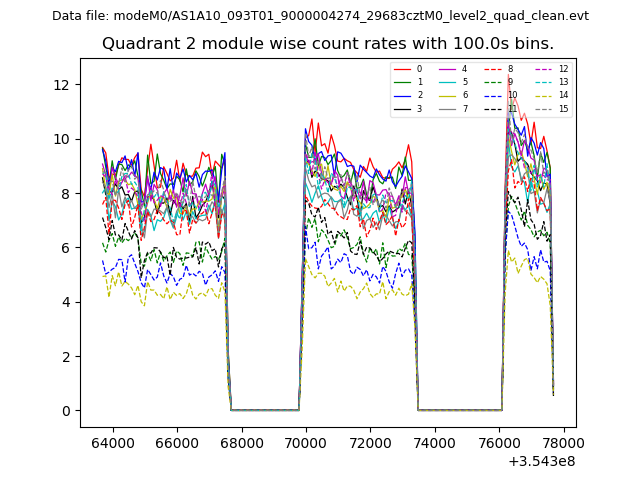
| Module-wise count rates for Quadrant B Data is divided into 100 sec bins |
 |
 |
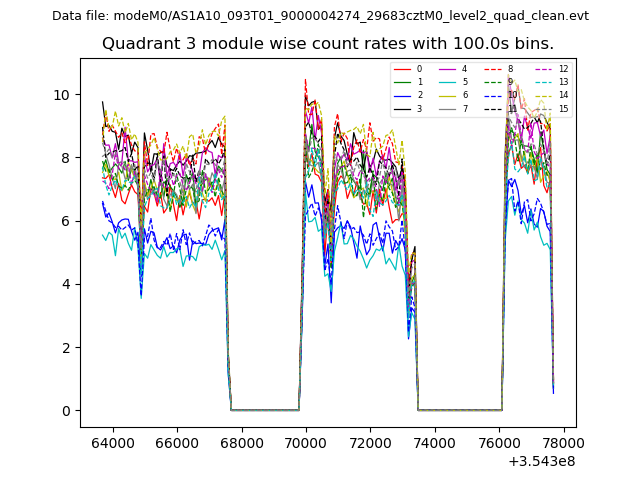
| Module-wise count rates for Quadrant C Data is divided into 100 sec bins |
 |
 |
| Module-wise count rates for Quadrant D Data is divided into 100 sec bins |
 |
 |
| Parameter | Plot |
|---|---|
| CZT HV Monitor | 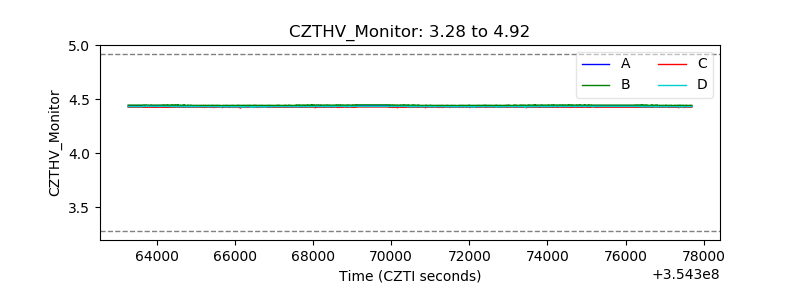 |
| D_VDD | 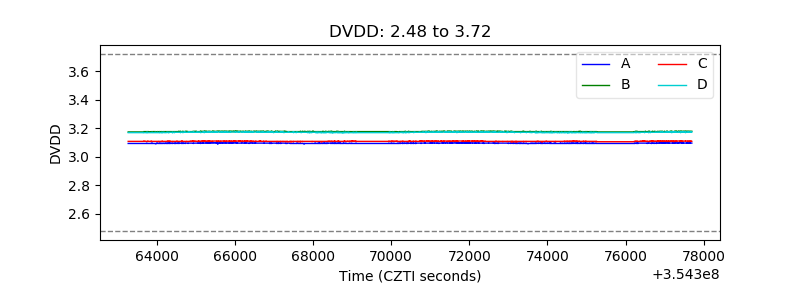 |
| Temperature 1 | 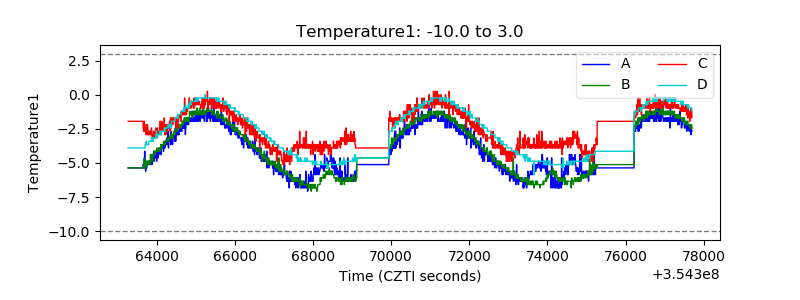 |
| Veto HV Monitor | 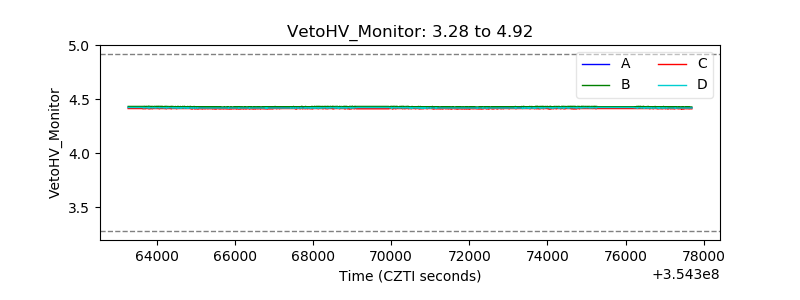 |
| Veto LLD | 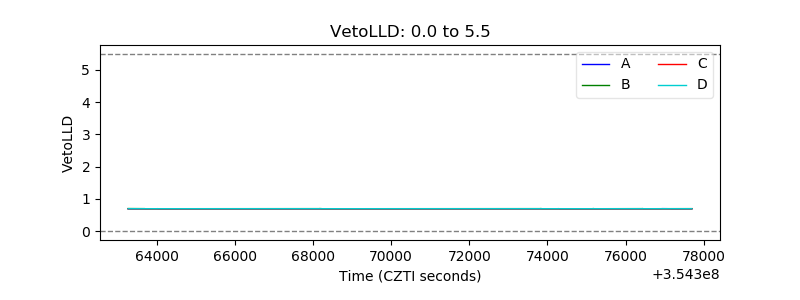 |
| Alpha Counter | 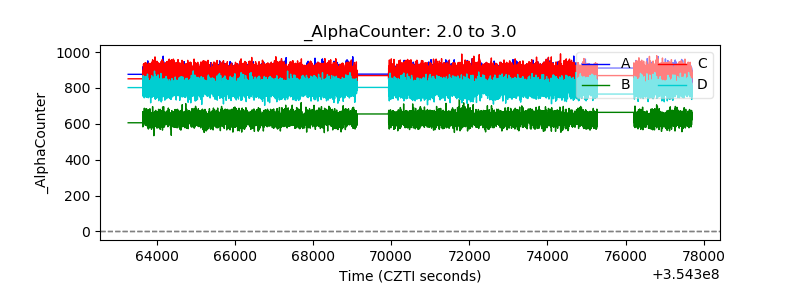 |
| _CPM_Rate | 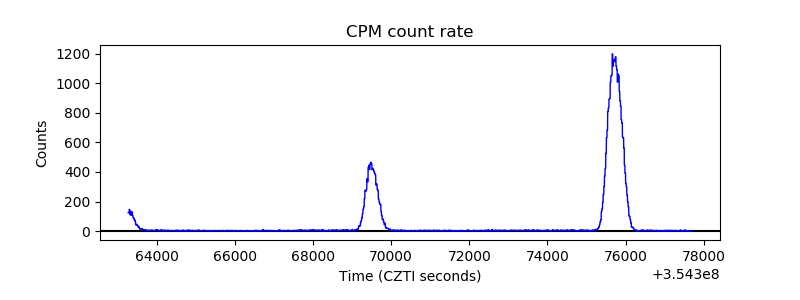 |
| CZT Counter | 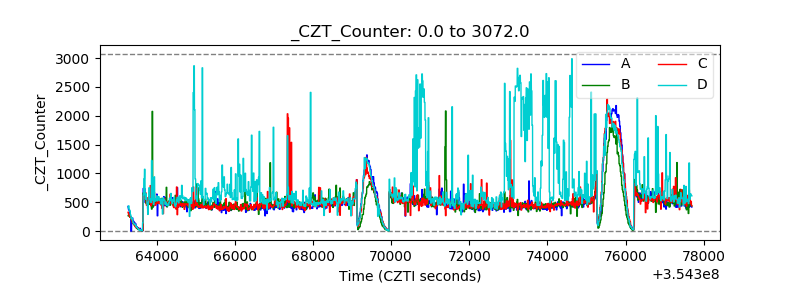 |
| +2.5 Volts monitor |  |
| +5 Volts monitor |  |
| _ROLL_ROT | 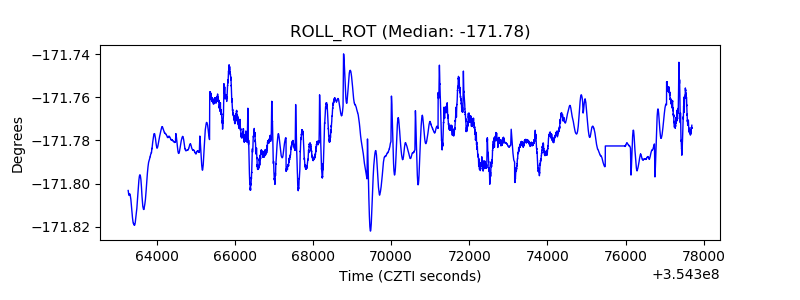 |
| _Roll_DEC | 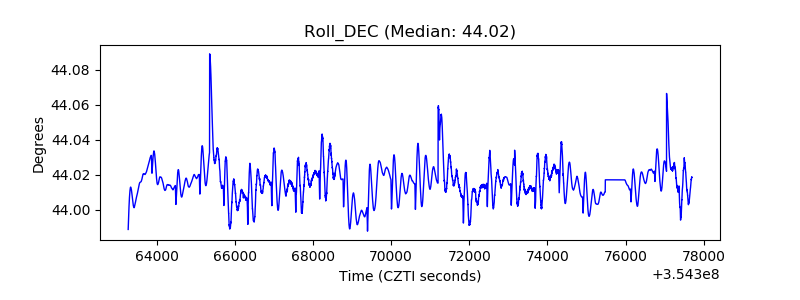 |
| _Roll_RA | 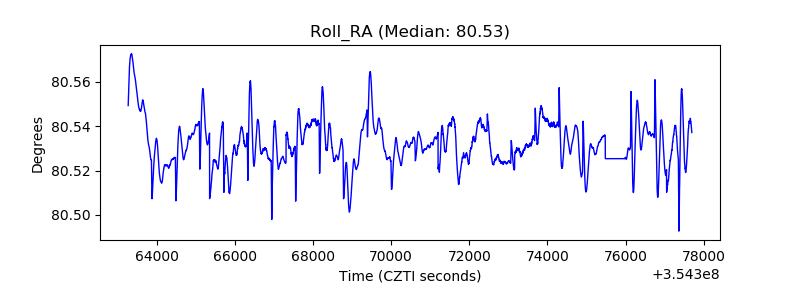 |
| Veto Counter | 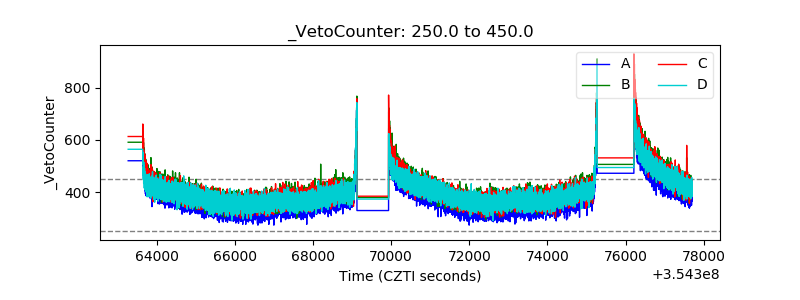 |