| Param | Original file | Final file |
|---|---|---|
| Filename | modeM0/AS1A10_093T01_9000004274_29687cztM0_level2.evt | modeM0/AS1A10_093T01_9000004274_29687cztM0_level2_quad_clean.evt |
| Size (bytes) | 558,417,600 | 93,657,600 |
| Size | 532.5 MB | 89.3 MB |
| Events in quadrant A | 3,226,960 | 627,319 |
| Events in quadrant B | 3,188,181 | 653,089 |
| Events in quadrant C | 3,775,956 | 602,452 |
| Events in quadrant D | 6,315,605 | 535,175 |
| Mode SS | |||
|---|---|---|---|
| Quadrant | BADHDUFLAG | Total packets | Discarded packets |
| A | 0 | 120 | 0 |
| B | 0 | 120 | 0 |
| C | 0 | 120 | 0 |
| D | 0 | 120 | 0 |
| Mode M9 | |||
|---|---|---|---|
| Quadrant | BADHDUFLAG | Total packets | Discarded packets |
| A | 0 | 13 | 0 |
| B | 0 | 13 | 0 |
| C | 0 | 13 | 0 |
| D | 0 | 13 | 0 |
| Mode M0 | |||
|---|---|---|---|
| Quadrant | BADHDUFLAG | Total packets | Discarded packets |
| A | 0 | 13334 | 1 |
| B | 0 | 13218 | 1 |
| C | 0 | 15206 | 1 |
| D | 0 | 23023 | 1 |
| Quadrant | Total seconds | Saturated seconds | Saturation percentage |
|---|---|---|---|
| A | 5990 | 56 | 0.934891% |
| B | 5990 | 47 | 0.784641% |
| C | 5990 | 127 | 2.120200% |
| D | 5990 | 646 | 10.784641% |
Noise dominated data is calculated using 1-second bins in cleaned event files. If a bin has >2000 counts, and if more than 50% of those come from <1% of pixels, then it is considered to be noise-dominated and hence unusable.
| Quadrant | # 1 sec bins | Bins with >0 counts | Bins with >2000 counts | High rate bins dominated by noise | Noise dominated (total time) | Noise dominated (detector-on time) | Marked lightcurve |
|---|---|---|---|---|---|---|---|
| A | 7270 | 5991 | 19 | 19 | 0.26% | 0.32% | 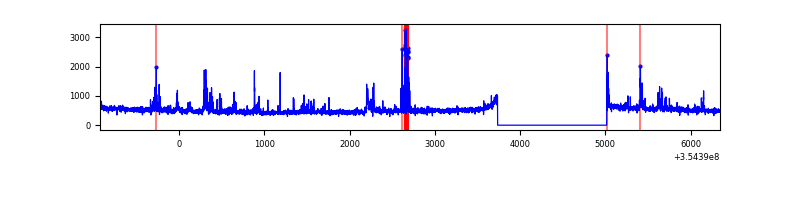 |
| B | 7270 | 5991 | 5 | 5 | 0.07% | 0.08% | 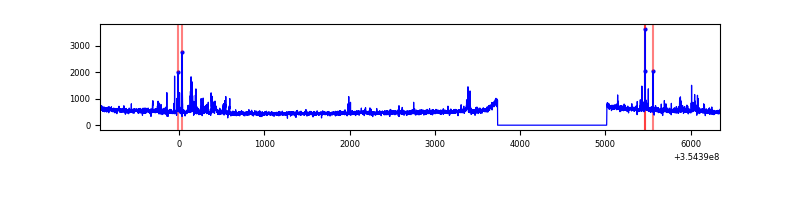 |
| C | 7270 | 5991 | 2 | 2 | 0.03% | 0.03% | 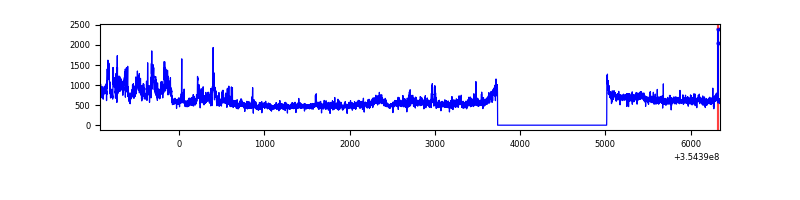 |
| D | 7270 | 5990 | 539 | 539 | 7.41% | 9.00% | 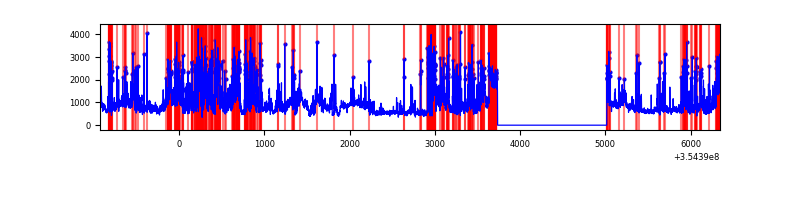 |
Top three noisy pixels from each quadrant. If the there are fewer than three noisy pixels in the level2.evt file, extra rows are filled as -1
| Pixel properties | Quadrant properties | ||||||
|---|---|---|---|---|---|---|---|
| Quadrant | DetID | PixID | Counts | Sigma | Mean | Median | Sigma |
| A | 0 | 13 | 143370 | 940.92 | 760 | 748 | 151.6 |
| A | 12 | 16 | 128662 | 843.89 | 760 | 748 | 151.6 |
| A | 12 | 194 | 25647 | 164.27 | 760 | 748 | 151.6 |
| B | 0 | 229 | 113363 | 788.56 | 770 | 751 | 142.8 |
| B | 0 | 189 | 22010 | 148.86 | 770 | 751 | 142.8 |
| B | 0 | 190 | 18219 | 122.32 | 770 | 751 | 142.8 |
| C | 3 | 233 | 690009 | 3971.18 | 745 | 752 | 173.6 |
| C | 14 | 238 | 122729 | 702.78 | 745 | 752 | 173.6 |
| C | 15 | 208 | 21968 | 122.24 | 745 | 752 | 173.6 |
| D | 7 | 80 | 1188206 | 7133.91 | 707 | 689 | 166.5 |
| D | 13 | 189 | 614122 | 3685.15 | 707 | 689 | 166.5 |
| D | 13 | 104 | 559489 | 3356.95 | 707 | 689 | 166.5 |
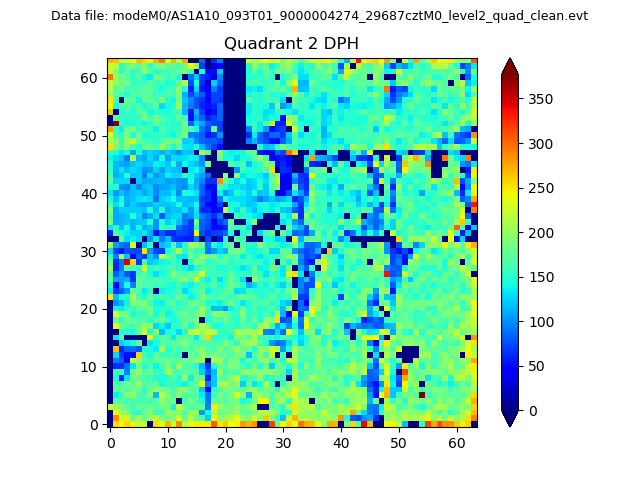
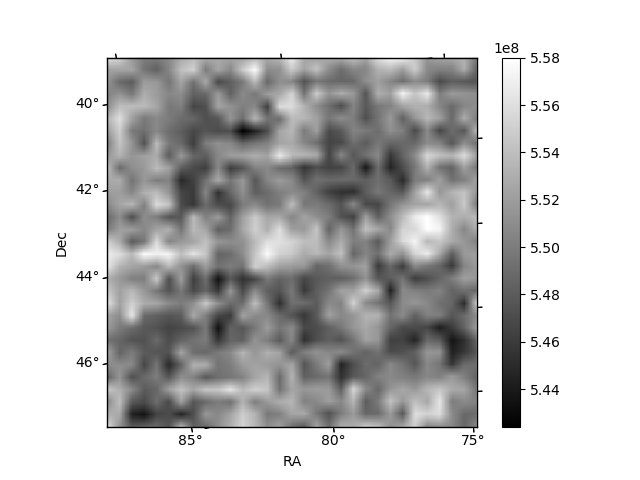
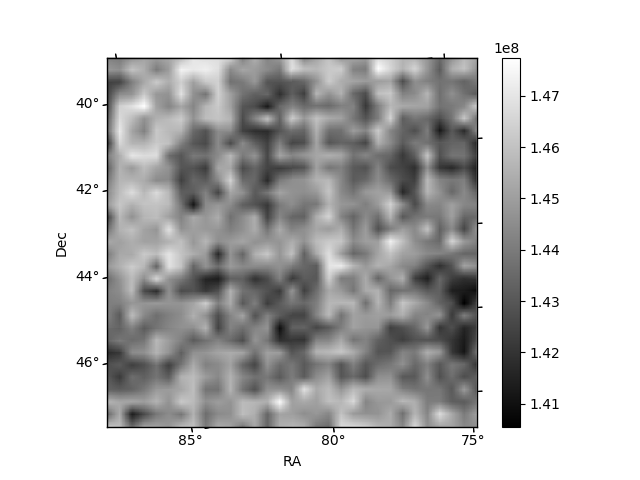
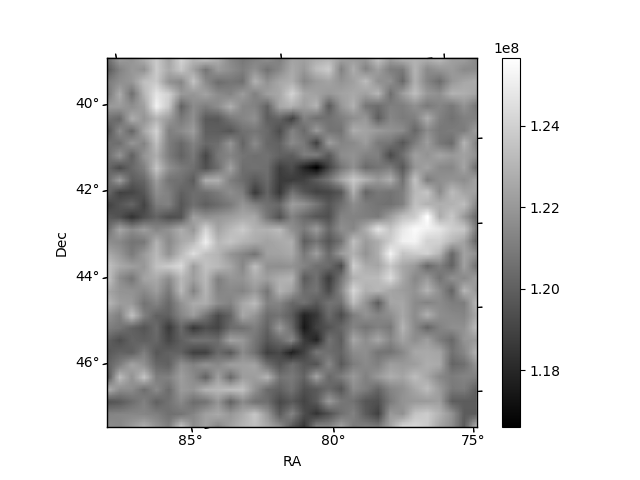
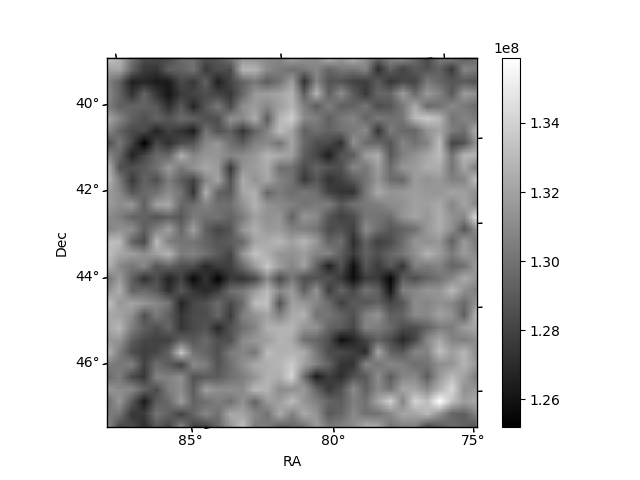
Histogram calculated using DETX and DETY for each event in the final _common_clean file
| Quadrant A | 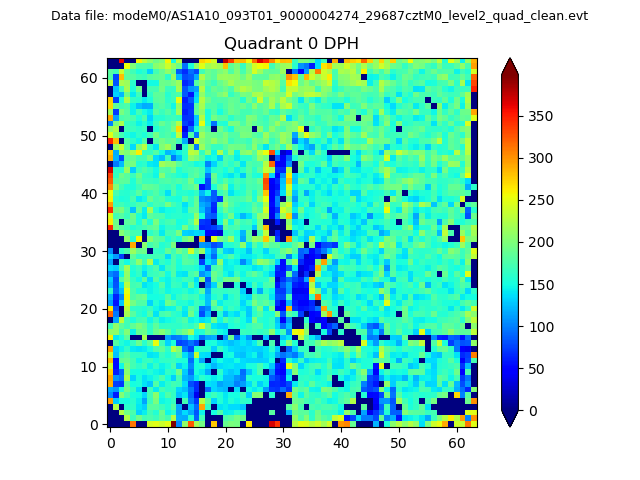 |
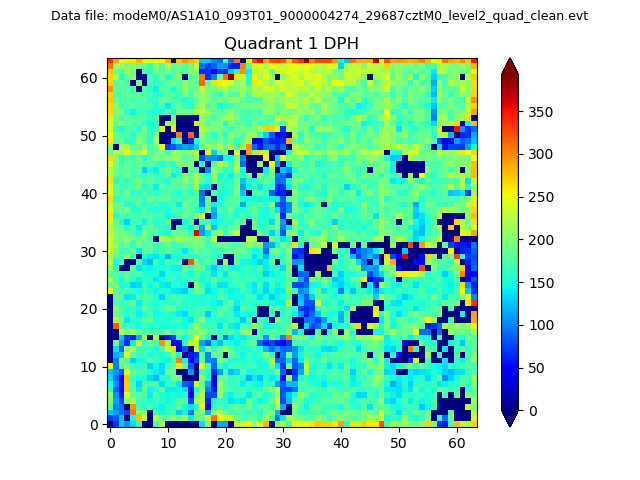 |
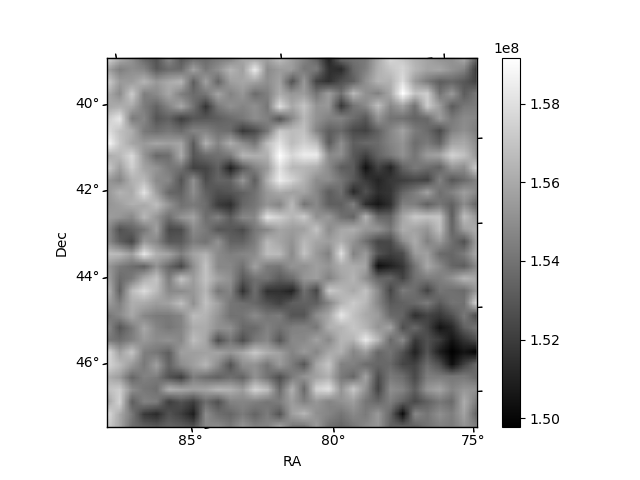
Quadrant B |
|---|---|---|---|
| Quadrant D | 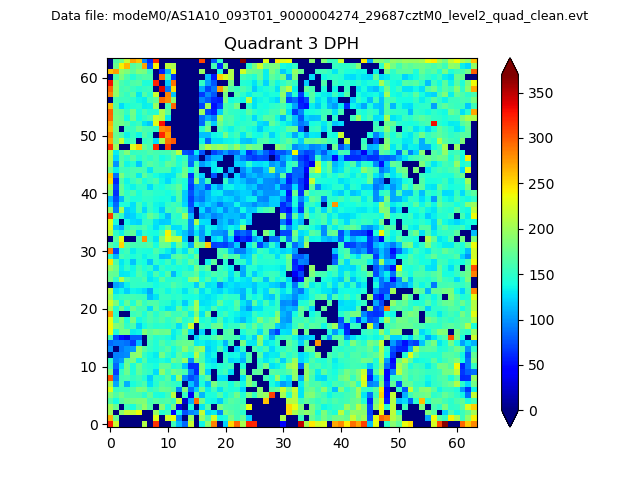 |
 |
Quadrant C |
| Plot type | Count rate plots | Images |
|---|---|---|
| Comparison with Poisson distribution Blue bars denote a histogram of data divided into 1 sec bins. Red curve is a Poisson curve with rate = median count rate of data. |
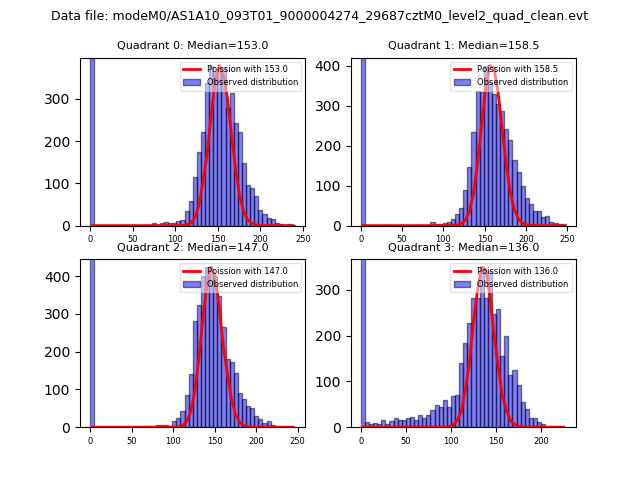 |
 |
| Quadrant-wise count rates Data is divided into 100 sec bins |
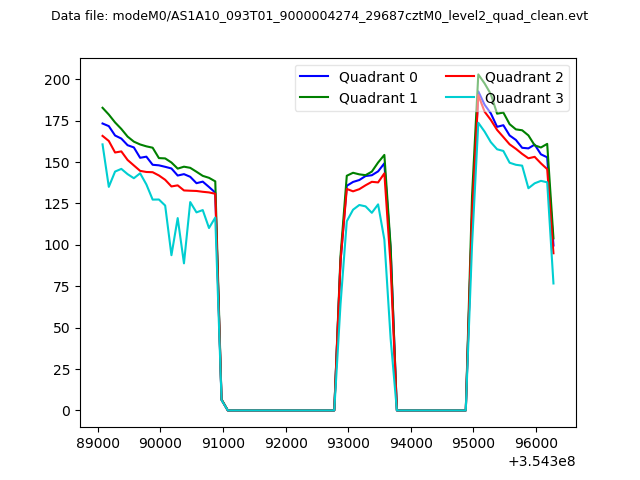 |
|
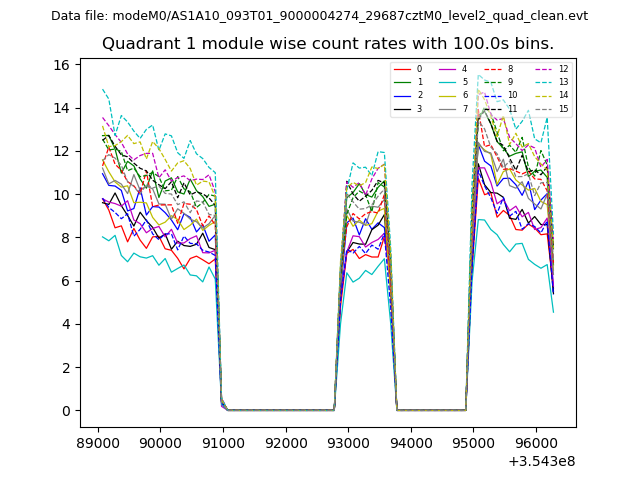
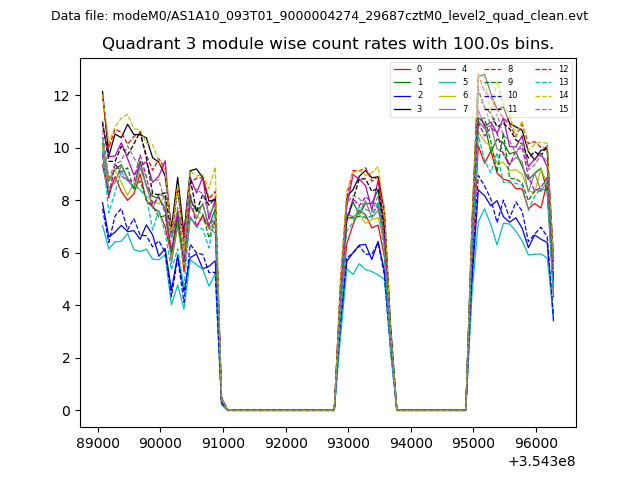
| Module-wise count rates for Quadrant A Data is divided into 100 sec bins |
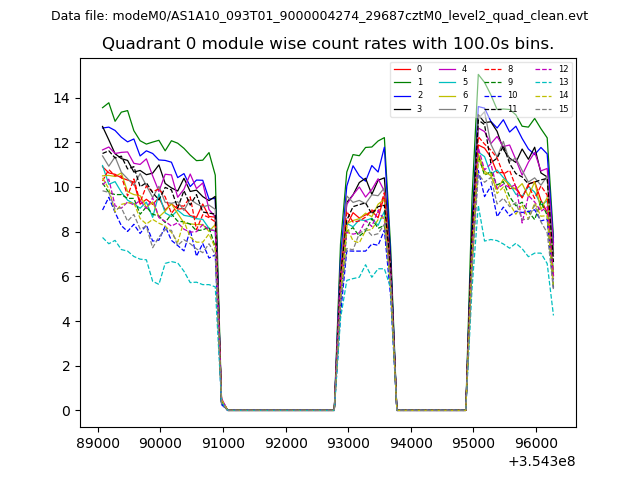 |
 |
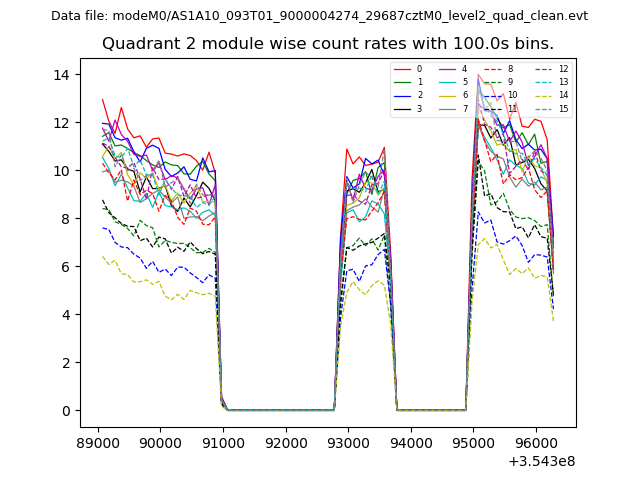
| Module-wise count rates for Quadrant B Data is divided into 100 sec bins |
 |
 |
| Module-wise count rates for Quadrant C Data is divided into 100 sec bins |
 |
 |
| Module-wise count rates for Quadrant D Data is divided into 100 sec bins |
 |
 |
| Parameter | Plot |
|---|---|
| CZT HV Monitor | 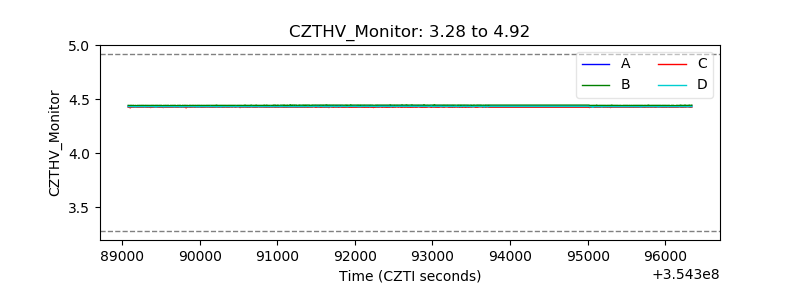 |
| D_VDD | 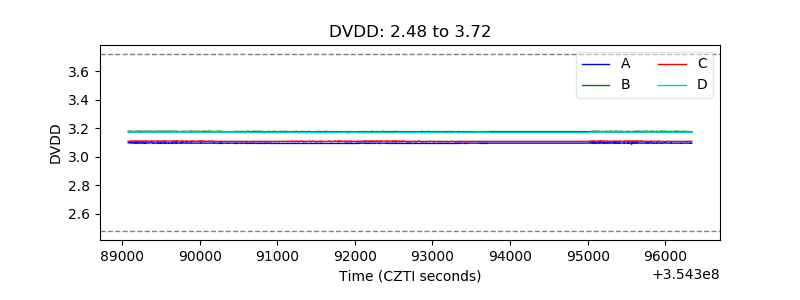 |
| Temperature 1 | 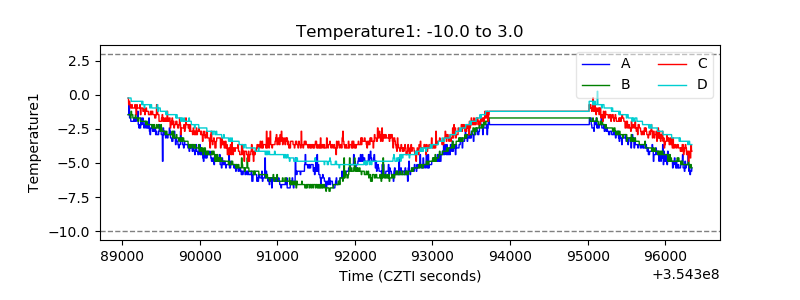 |
| Veto HV Monitor | 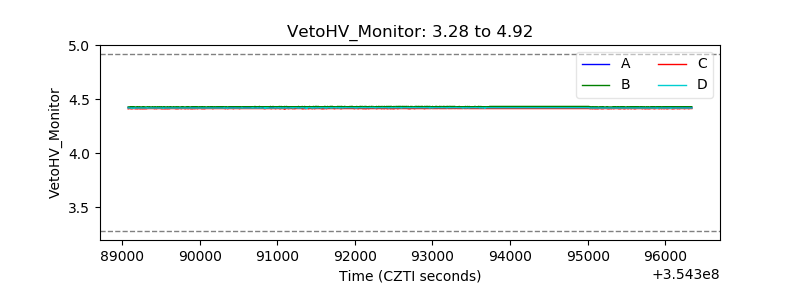 |
| Veto LLD | 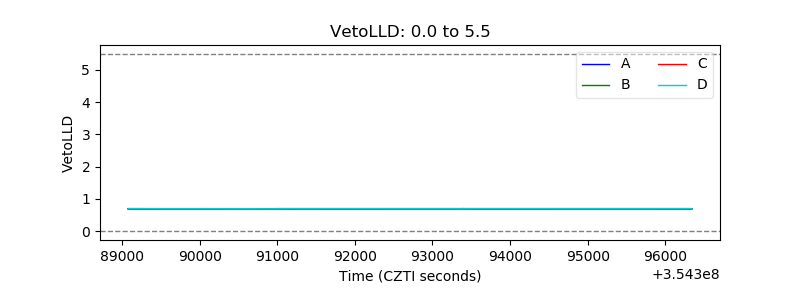 |
| Alpha Counter | 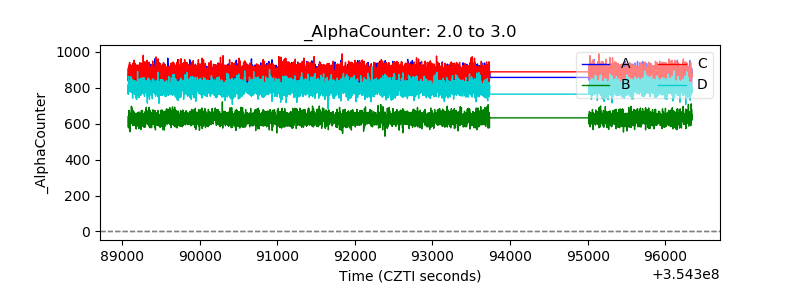 |
| _CPM_Rate | 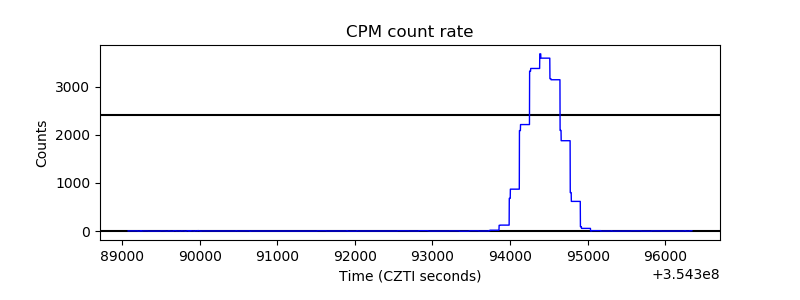 |
| CZT Counter | 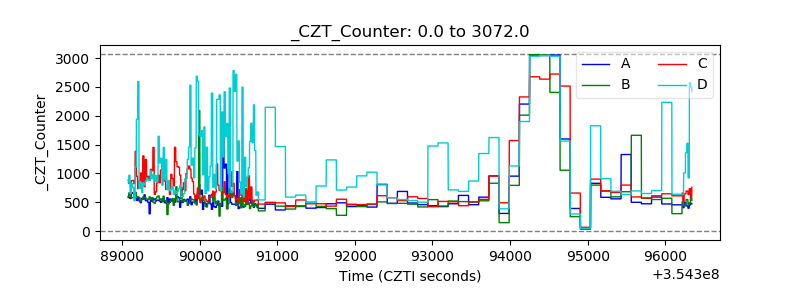 |
| +2.5 Volts monitor | 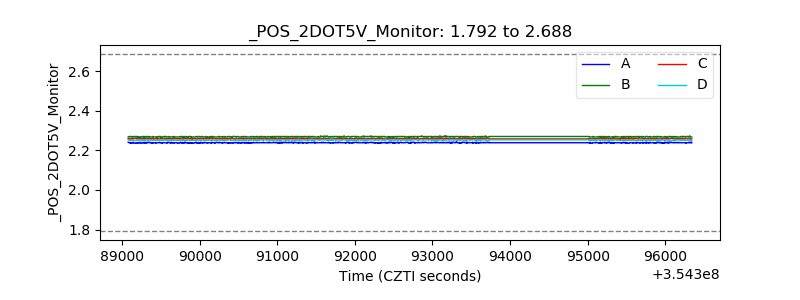 |
| +5 Volts monitor | 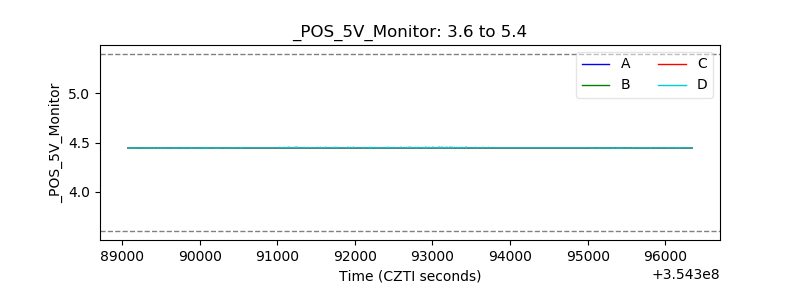 |
| _ROLL_ROT | 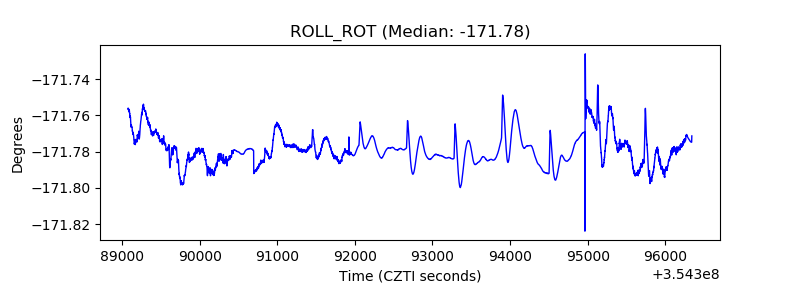 |
| _Roll_DEC | 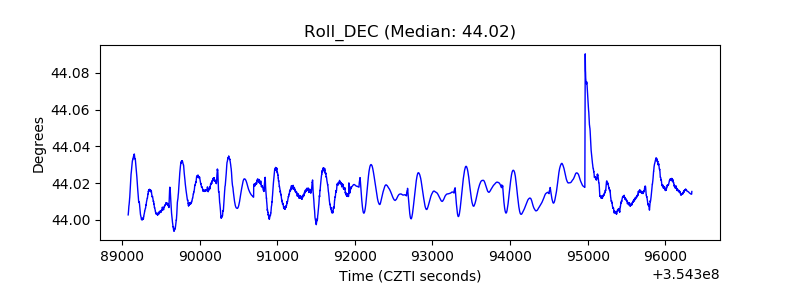 |
| _Roll_RA | 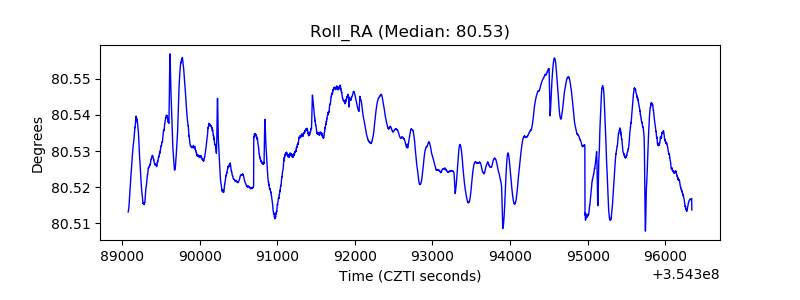 |
| Veto Counter | 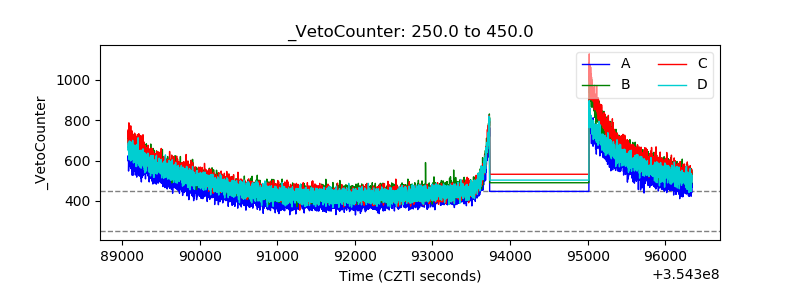 |