| Param | Original file | Final file |
|---|---|---|
| Filename | modeM0/AS1A10_093T01_9000004274_29688cztM0_level2.evt | modeM0/AS1A10_093T01_9000004274_29688cztM0_level2_quad_clean.evt |
| Size (bytes) | 516,931,200 | 97,364,160 |
| Size | 493.0 MB | 92.9 MB |
| Events in quadrant A | 3,117,397 | 646,463 |
| Events in quadrant B | 3,723,152 | 669,162 |
| Events in quadrant C | 3,825,225 | 623,562 |
| Events in quadrant D | 4,576,987 | 584,207 |
| Mode SS | |||
|---|---|---|---|
| Quadrant | BADHDUFLAG | Total packets | Discarded packets |
| A | 0 | 124 | 0 |
| B | 0 | 124 | 0 |
| C | 0 | 124 | 0 |
| D | 0 | 124 | 0 |
| Mode M9 | |||
|---|---|---|---|
| Quadrant | BADHDUFLAG | Total packets | Discarded packets |
| A | 0 | 13 | 0 |
| B | 0 | 13 | 0 |
| C | 0 | 13 | 0 |
| D | 0 | 13 | 0 |
| Mode M0 | |||
|---|---|---|---|
| Quadrant | BADHDUFLAG | Total packets | Discarded packets |
| A | 0 | 13017 | 1 |
| B | 0 | 14874 | 2 |
| C | 0 | 15387 | 1 |
| D | 0 | 17708 | 1 |
| Quadrant | Total seconds | Saturated seconds | Saturation percentage |
|---|---|---|---|
| A | 6089 | 23 | 0.377730% |
| B | 6089 | 78 | 1.280999% |
| C | 6089 | 91 | 1.494498% |
| D | 6089 | 262 | 4.302841% |
Noise dominated data is calculated using 1-second bins in cleaned event files. If a bin has >2000 counts, and if more than 50% of those come from <1% of pixels, then it is considered to be noise-dominated and hence unusable.
| Quadrant | # 1 sec bins | Bins with >0 counts | Bins with >2000 counts | High rate bins dominated by noise | Noise dominated (total time) | Noise dominated (detector-on time) | Marked lightcurve |
|---|---|---|---|---|---|---|---|
| A | 7399 | 6090 | 3 | 3 | 0.04% | 0.05% | 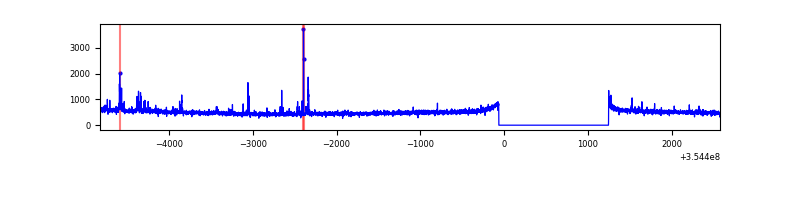 |
| B | 7399 | 6090 | 13 | 13 | 0.18% | 0.21% | 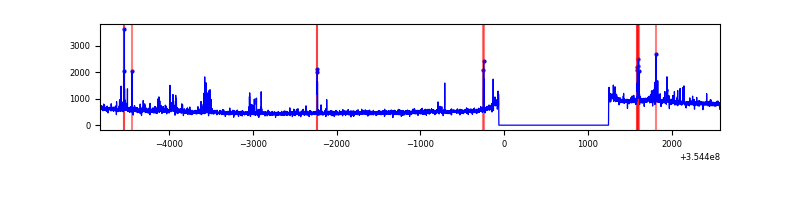 |
| C | 7399 | 6090 | 3 | 3 | 0.04% | 0.05% | 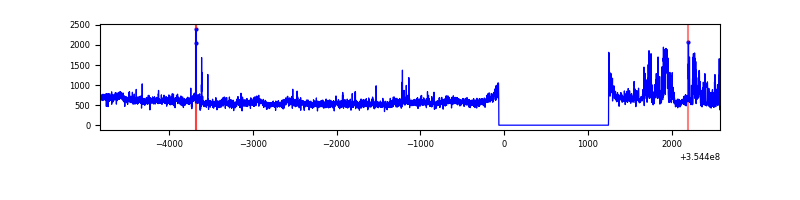 |
| D | 7399 | 6090 | 176 | 176 | 2.38% | 2.89% | 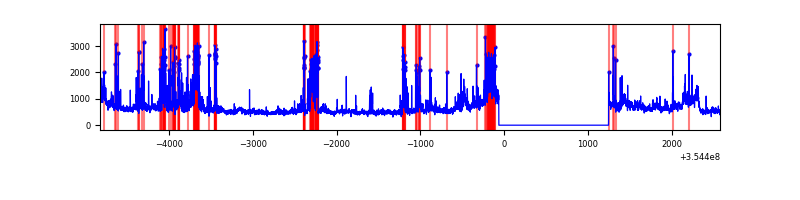 |
Top three noisy pixels from each quadrant. If the there are fewer than three noisy pixels in the level2.evt file, extra rows are filled as -1
| Pixel properties | Quadrant properties | ||||||
|---|---|---|---|---|---|---|---|
| Quadrant | DetID | PixID | Counts | Sigma | Mean | Median | Sigma |
| A | 12 | 16 | 61456 | 391.24 | 778 | 763 | 155.1 |
| A | 0 | 13 | 38951 | 246.17 | 778 | 763 | 155.1 |
| A | 12 | 194 | 15734 | 96.51 | 778 | 763 | 155.1 |
| B | 6 | 159 | 444315 | 3039.47 | 788 | 769 | 145.9 |
| B | 0 | 229 | 142541 | 971.52 | 788 | 769 | 145.9 |
| B | 12 | 111 | 17043 | 111.52 | 788 | 769 | 145.9 |
| C | 3 | 233 | 654661 | 3706.49 | 762 | 769 | 176.4 |
| C | 14 | 238 | 126325 | 711.7 | 762 | 769 | 176.4 |
| C | 15 | 208 | 26601 | 146.42 | 762 | 769 | 176.4 |
| D | 7 | 80 | 543212 | 3091.98 | 745 | 727 | 175.4 |
| D | 8 | 195 | 480070 | 2732.09 | 745 | 727 | 175.4 |
| D | 13 | 104 | 327213 | 1860.86 | 745 | 727 | 175.4 |
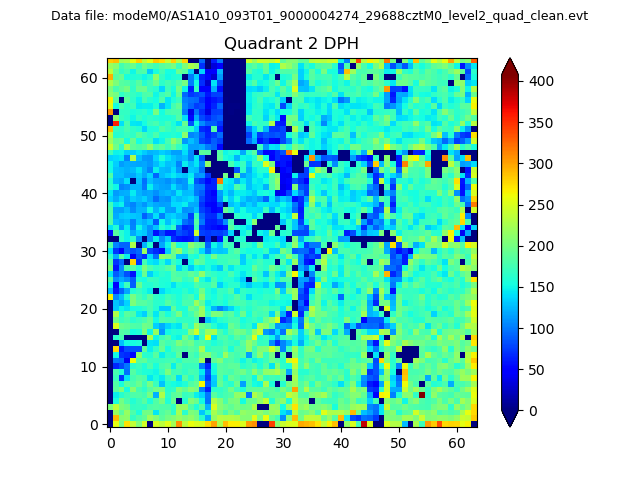
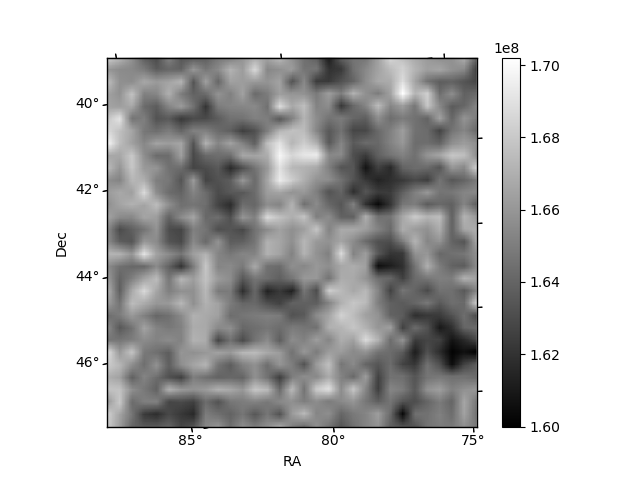
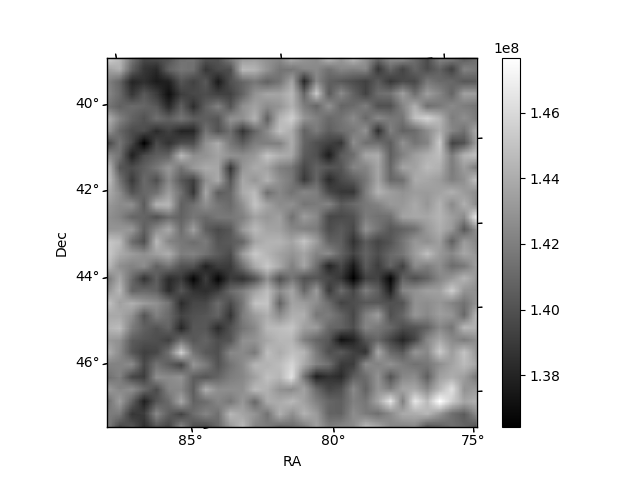
Histogram calculated using DETX and DETY for each event in the final _common_clean file
| Quadrant A | 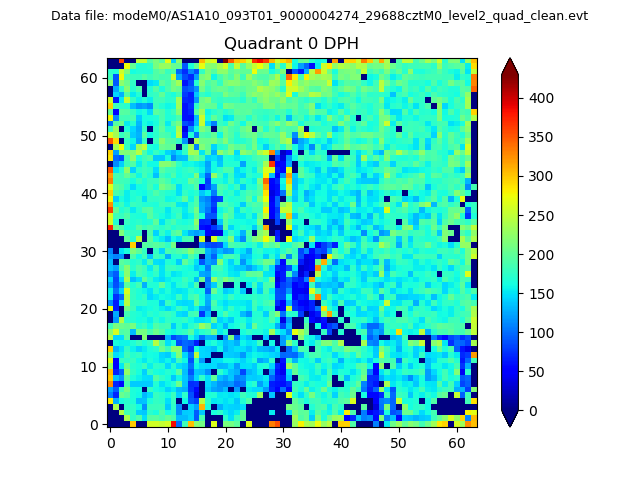 |
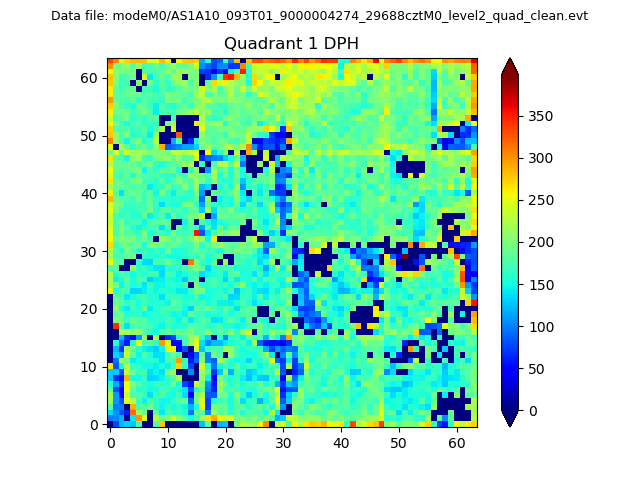 |
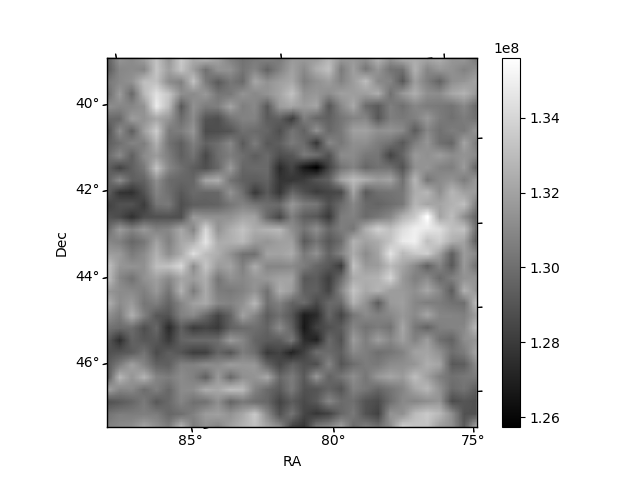
Quadrant B |
|---|---|---|---|
| Quadrant D | 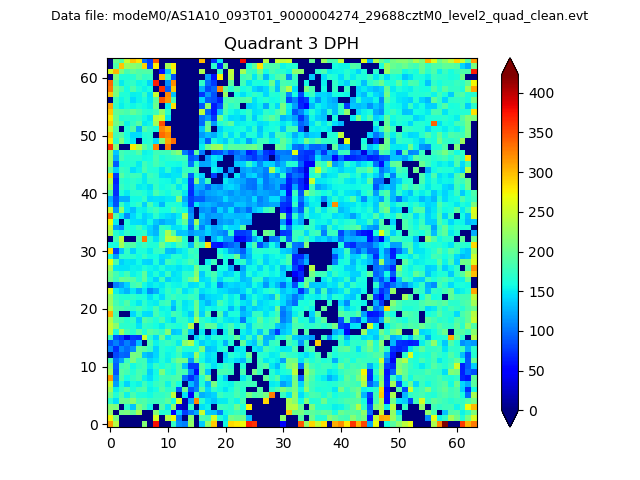 |
 |
Quadrant C |
| Plot type | Count rate plots | Images |
|---|---|---|
| Comparison with Poisson distribution Blue bars denote a histogram of data divided into 1 sec bins. Red curve is a Poisson curve with rate = median count rate of data. |
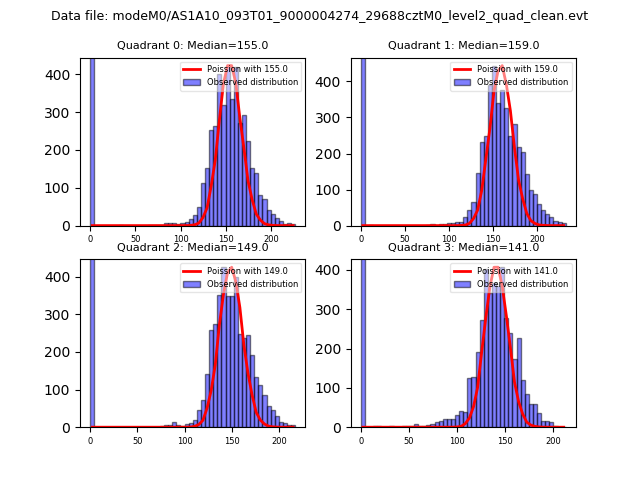 |
 |
| Quadrant-wise count rates Data is divided into 100 sec bins |
 |
|
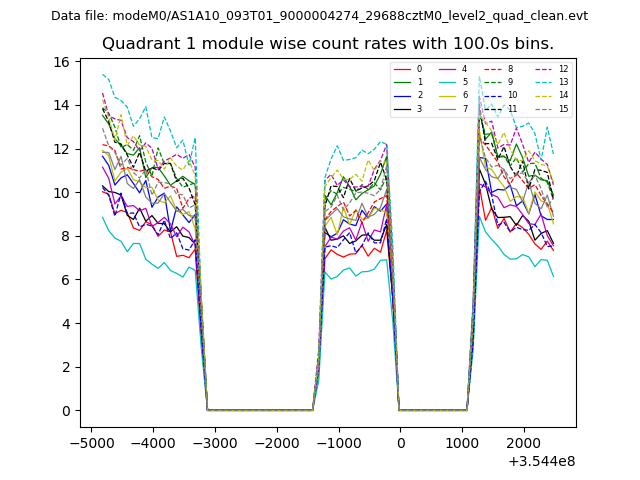
| Module-wise count rates for Quadrant A Data is divided into 100 sec bins |
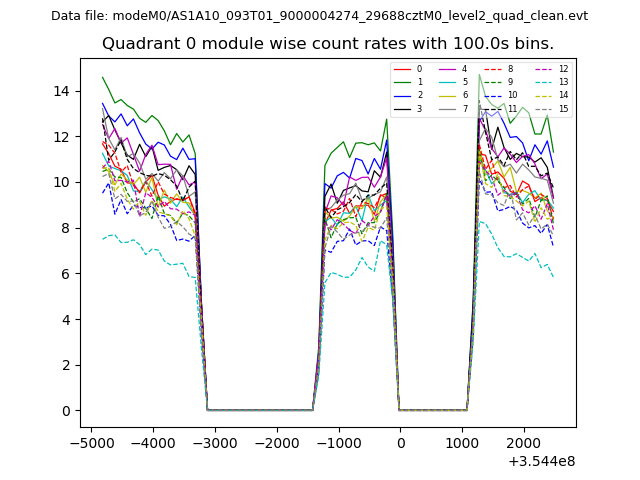 |
 |
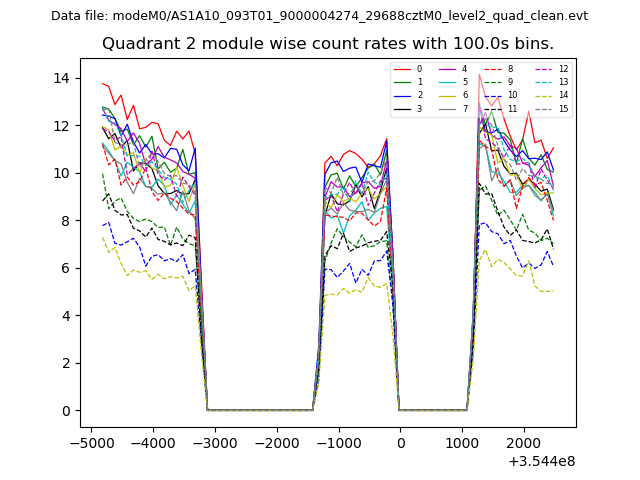
| Module-wise count rates for Quadrant B Data is divided into 100 sec bins |
 |
 |
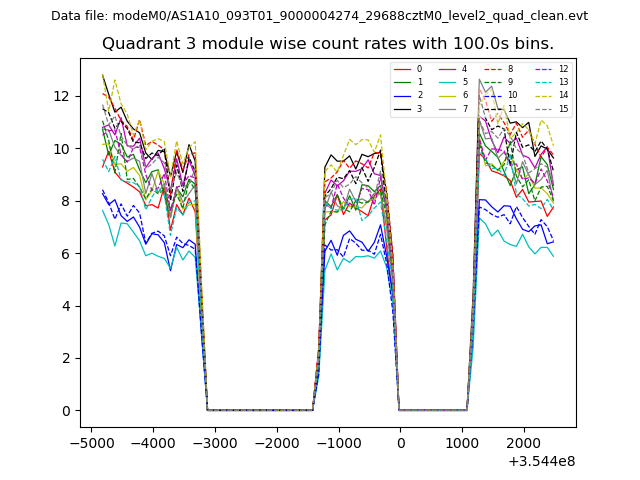
| Module-wise count rates for Quadrant C Data is divided into 100 sec bins |
 |
 |
| Module-wise count rates for Quadrant D Data is divided into 100 sec bins |
 |
 |
| Parameter | Plot |
|---|---|
| CZT HV Monitor |  |
| D_VDD | 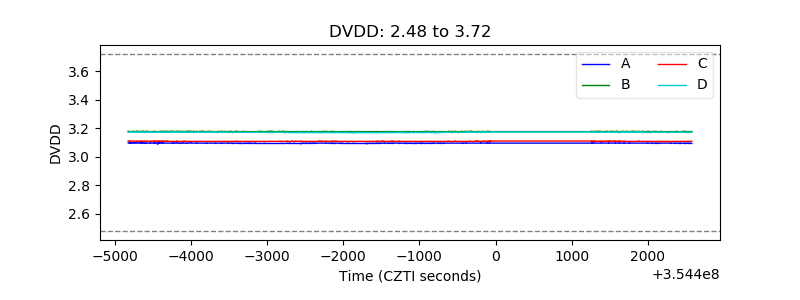 |
| Temperature 1 | 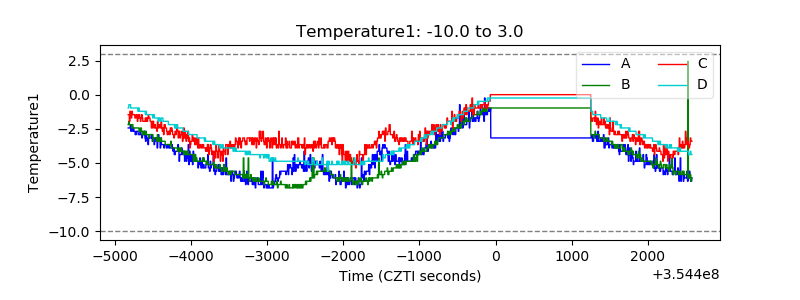 |
| Veto HV Monitor | 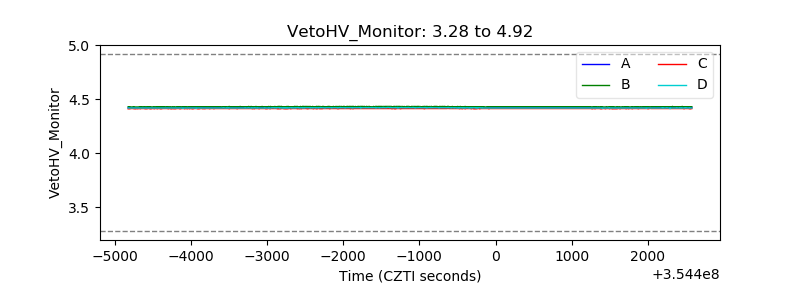 |
| Veto LLD | 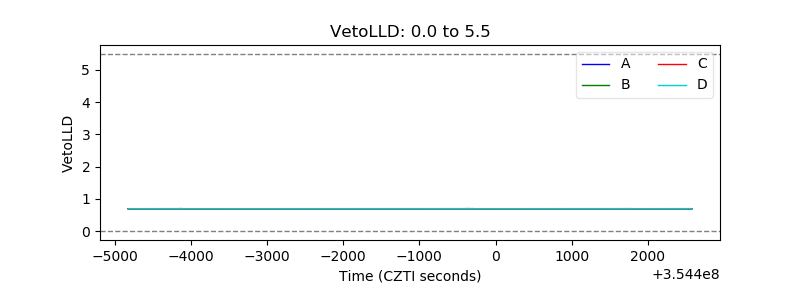 |
| Alpha Counter | 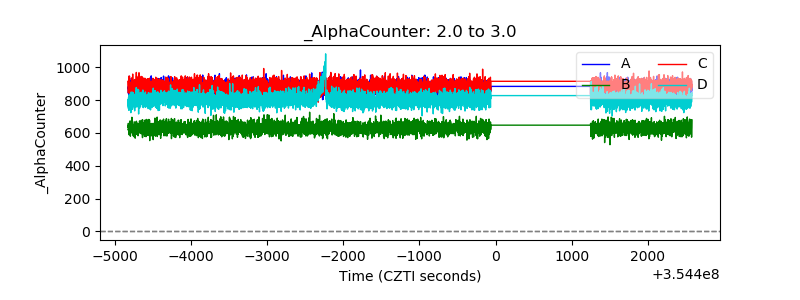 |
| _CPM_Rate | 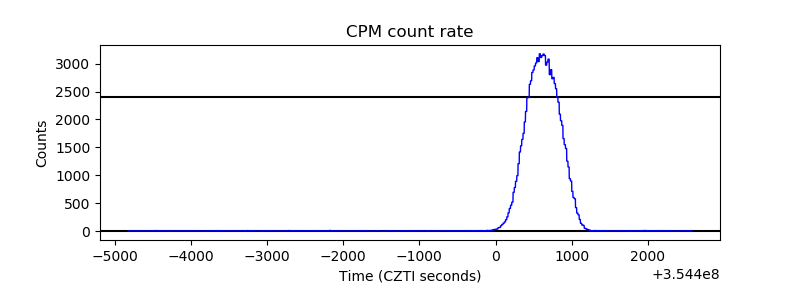 |
| CZT Counter | 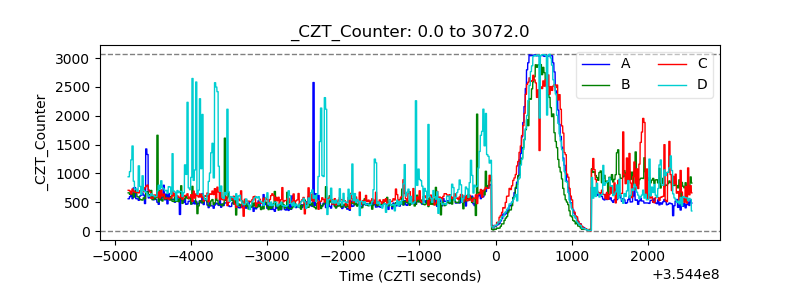 |
| +2.5 Volts monitor |  |
| +5 Volts monitor |  |
| _ROLL_ROT | 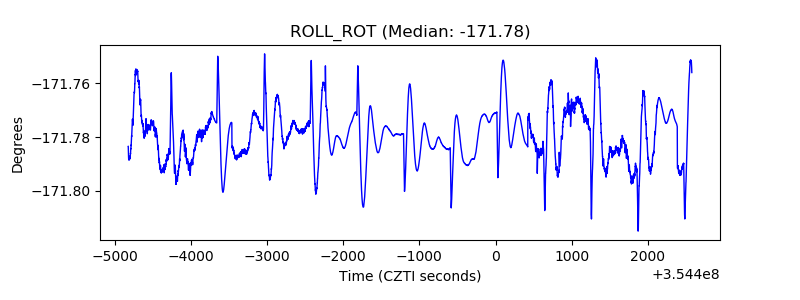 |
| _Roll_DEC | 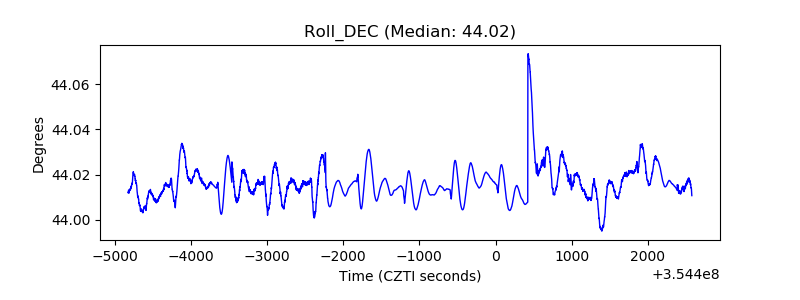 |
| _Roll_RA | 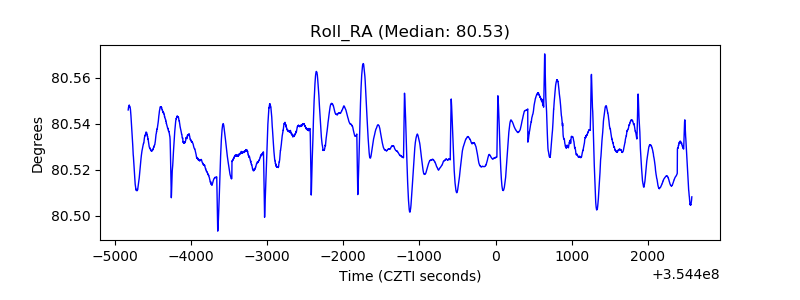 |
| Veto Counter | 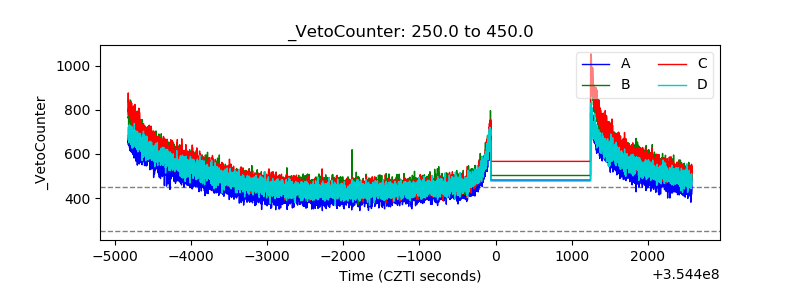 |