| Param | Original file | Final file |
|---|---|---|
| Filename | modeM0/AS1A10_093T01_9000004274_29690cztM0_level2.evt | modeM0/AS1A10_093T01_9000004274_29690cztM0_level2_quad_clean.evt |
| Size (bytes) | 666,478,080 | 84,991,680 |
| Size | 635.6 MB | 81.1 MB |
| Events in quadrant A | 3,208,841 | 546,899 |
| Events in quadrant B | 5,590,066 | 551,403 |
| Events in quadrant C | 4,106,504 | 514,658 |
| Events in quadrant D | 6,822,549 | 489,623 |
| Mode SS | |||
|---|---|---|---|
| Quadrant | BADHDUFLAG | Total packets | Discarded packets |
| A | 0 | 138 | 0 |
| B | 0 | 138 | 0 |
| C | 0 | 138 | 0 |
| D | 0 | 138 | 0 |
| Mode M9 | |||
|---|---|---|---|
| Quadrant | BADHDUFLAG | Total packets | Discarded packets |
| A | 0 | 12 | 0 |
| B | 0 | 13 | 0 |
| C | 0 | 13 | 0 |
| D | 0 | 13 | 0 |
| Mode M0 | |||
|---|---|---|---|
| Quadrant | BADHDUFLAG | Total packets | Discarded packets |
| A | 0 | 13876 | 2 |
| B | 0 | 21097 | 2 |
| C | 0 | 16486 | 2 |
| D | 0 | 24834 | 2 |
| Quadrant | Total seconds | Saturated seconds | Saturation percentage |
|---|---|---|---|
| A | 6753 | 50 | 0.740412% |
| B | 6753 | 146 | 2.162002% |
| C | 6753 | 247 | 3.657634% |
| D | 6753 | 901 | 13.342218% |
Noise dominated data is calculated using 1-second bins in cleaned event files. If a bin has >2000 counts, and if more than 50% of those come from <1% of pixels, then it is considered to be noise-dominated and hence unusable.
| Quadrant | # 1 sec bins | Bins with >0 counts | Bins with >2000 counts | High rate bins dominated by noise | Noise dominated (total time) | Noise dominated (detector-on time) | Marked lightcurve |
|---|---|---|---|---|---|---|---|
| A | 7878 | 6754 | 0 | 0 | 0.00% | 0.00% | 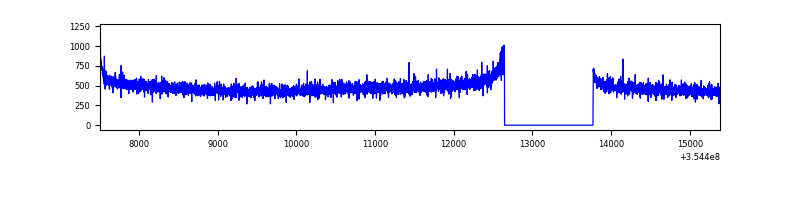 |
| B | 7878 | 6753 | 28 | 28 | 0.36% | 0.41% | 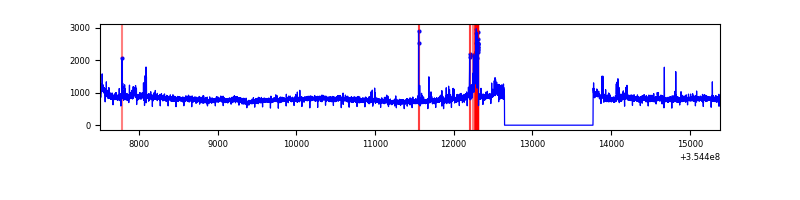 |
| C | 7878 | 6753 | 22 | 22 | 0.28% | 0.33% | 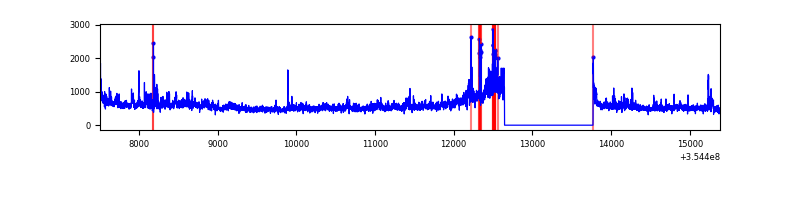 |
| D | 7878 | 6754 | 873 | 873 | 11.08% | 12.93% | 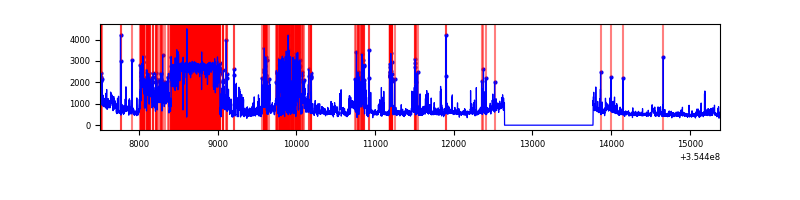 |
Top three noisy pixels from each quadrant. If the there are fewer than three noisy pixels in the level2.evt file, extra rows are filled as -1
| Pixel properties | Quadrant properties | ||||||
|---|---|---|---|---|---|---|---|
| Quadrant | DetID | PixID | Counts | Sigma | Mean | Median | Sigma |
| A | 13 | 254 | 13505 | 76.92 | 829 | 813 | 165.0 |
| A | 3 | 137 | 7876 | 42.8 | 829 | 813 | 165.0 |
| A | 0 | 226 | 6933 | 37.09 | 829 | 813 | 165.0 |
| B | 6 | 159 | 2140807 | 13794.35 | 828 | 806 | 155.1 |
| B | 0 | 229 | 155781 | 998.96 | 828 | 806 | 155.1 |
| B | 10 | 245 | 18954 | 116.98 | 828 | 806 | 155.1 |
| C | 3 | 233 | 778586 | 4199.56 | 796 | 800 | 185.2 |
| C | 14 | 238 | 143701 | 771.58 | 796 | 800 | 185.2 |
| C | 10 | 22 | 37308 | 197.12 | 796 | 800 | 185.2 |
| D | 7 | 80 | 3085429 | 17117.83 | 759 | 738 | 180.2 |
| D | 8 | 195 | 589360 | 3266.43 | 759 | 738 | 180.2 |
| D | 2 | 250 | 74087 | 407.03 | 759 | 738 | 180.2 |
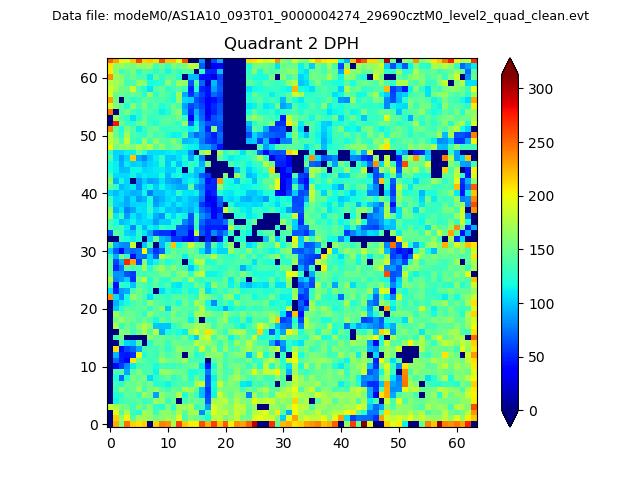
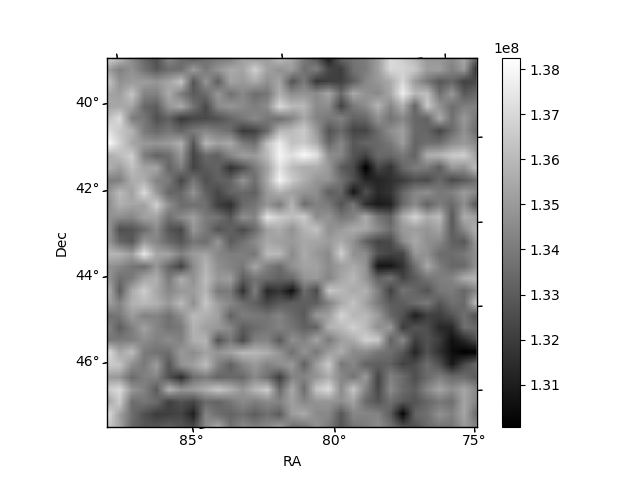
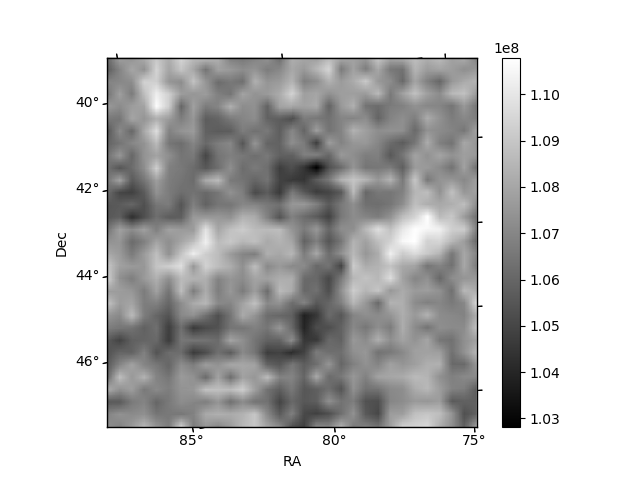
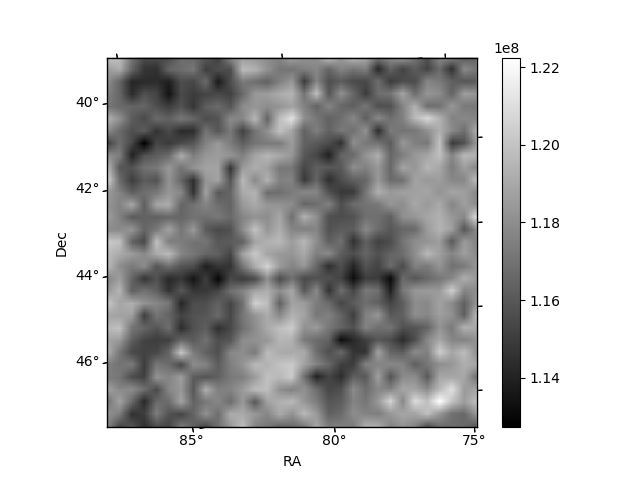
Histogram calculated using DETX and DETY for each event in the final _common_clean file
| Quadrant A | 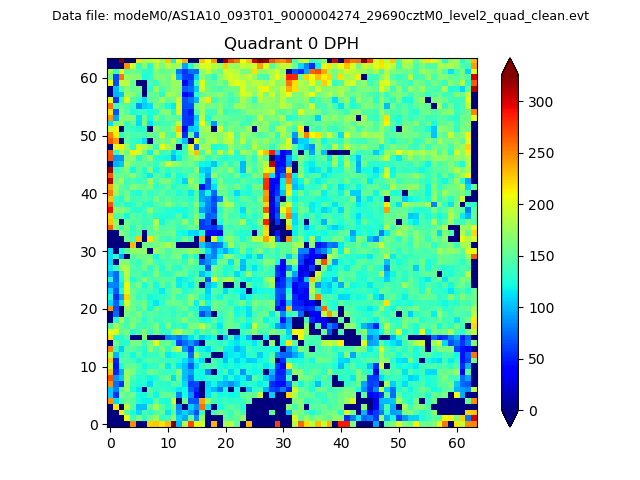 |
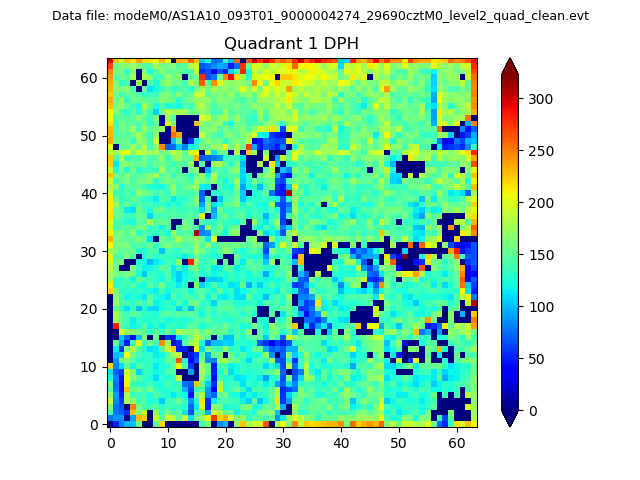 |
Quadrant B |
|---|---|---|---|
| Quadrant D | 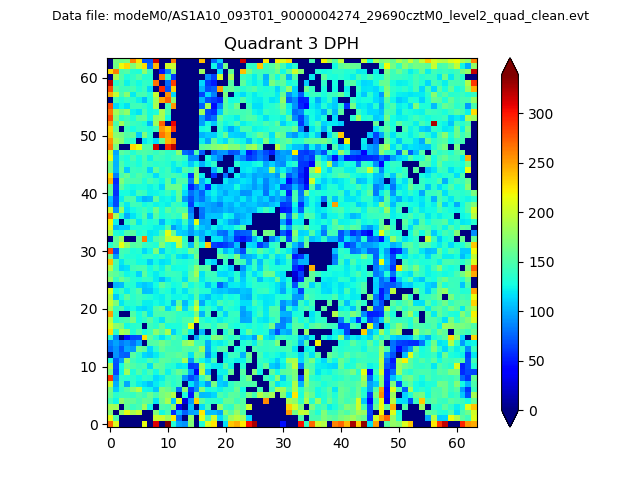 |
 |
Quadrant C |
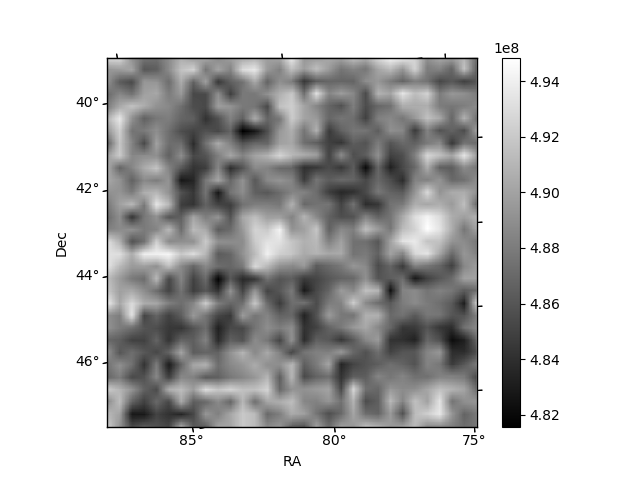
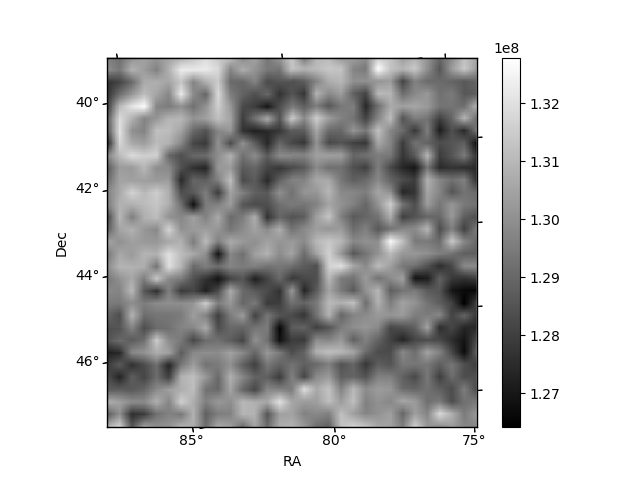
| Plot type | Count rate plots | Images |
|---|---|---|
| Comparison with Poisson distribution Blue bars denote a histogram of data divided into 1 sec bins. Red curve is a Poisson curve with rate = median count rate of data. |
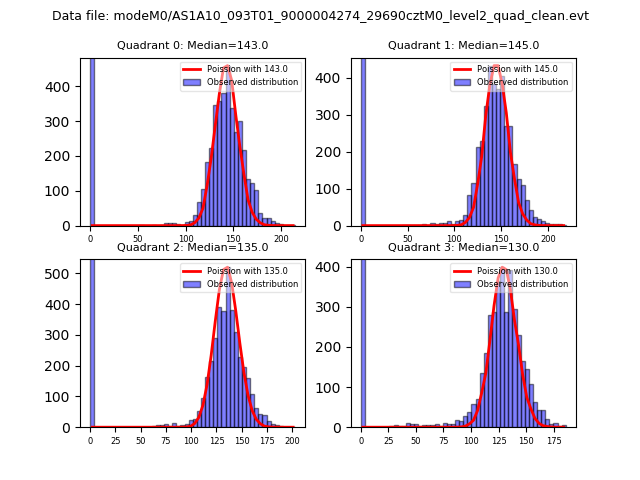 |
 |
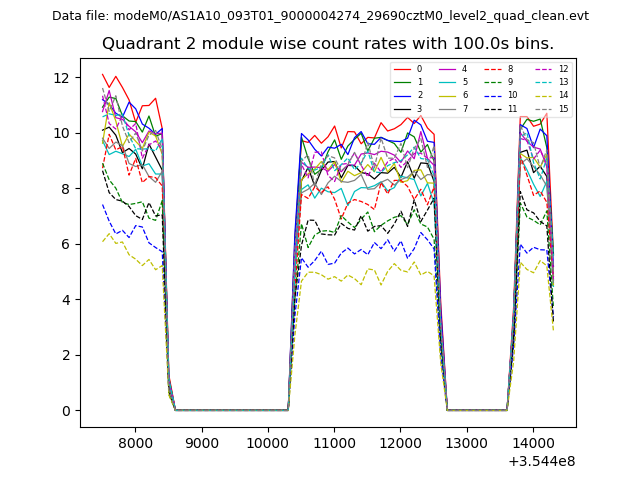
| Quadrant-wise count rates Data is divided into 100 sec bins |
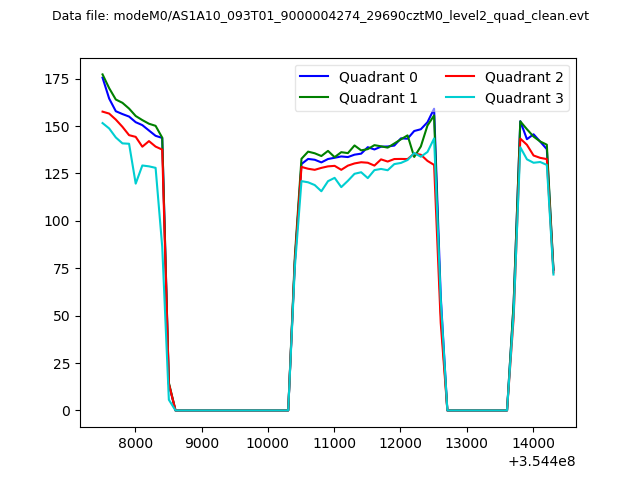 |
|
| Module-wise count rates for Quadrant A Data is divided into 100 sec bins |
 |
 |
| Module-wise count rates for Quadrant B Data is divided into 100 sec bins |
 |
 |
| Module-wise count rates for Quadrant C Data is divided into 100 sec bins |
 |
 |
| Module-wise count rates for Quadrant D Data is divided into 100 sec bins |
 |
 |
| Parameter | Plot |
|---|---|
| CZT HV Monitor | 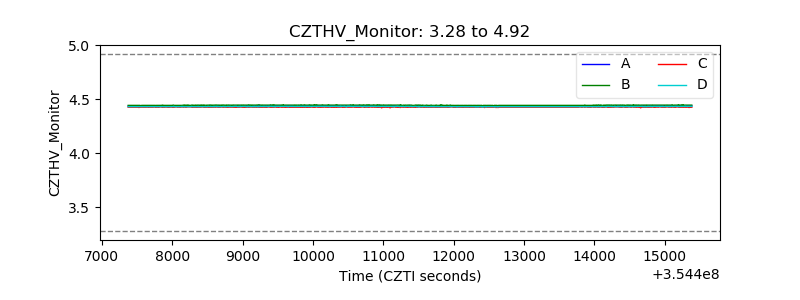 |
| D_VDD | 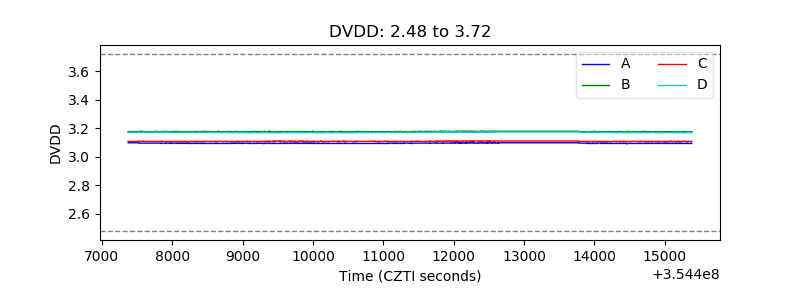 |
| Temperature 1 | 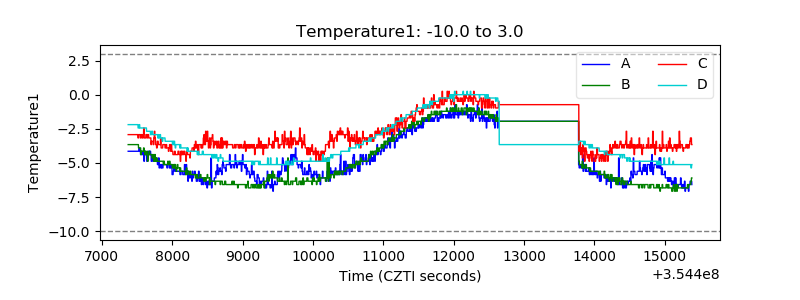 |
| Veto HV Monitor | 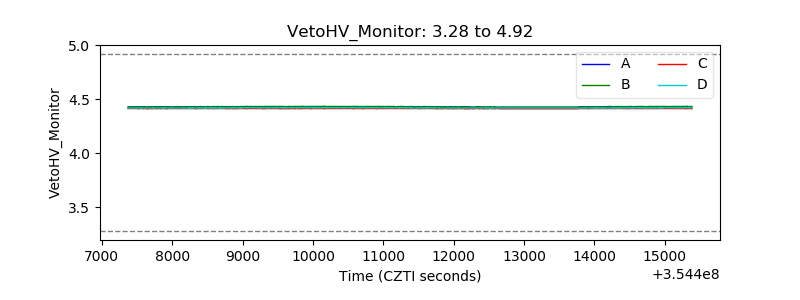 |
| Veto LLD | 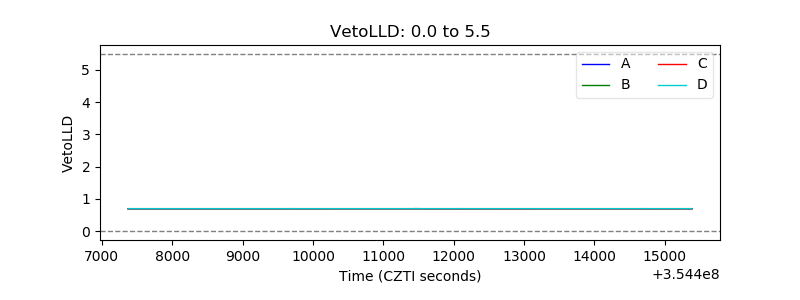 |
| Alpha Counter | 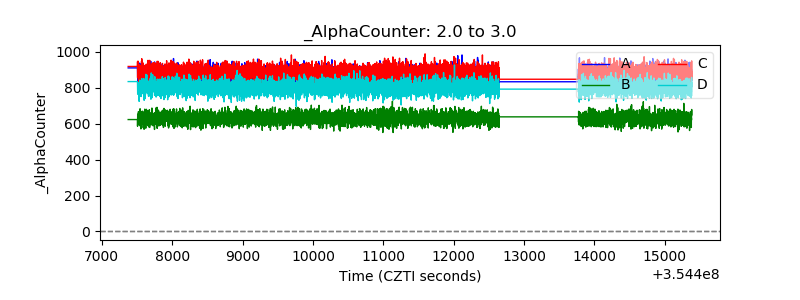 |
| _CPM_Rate | 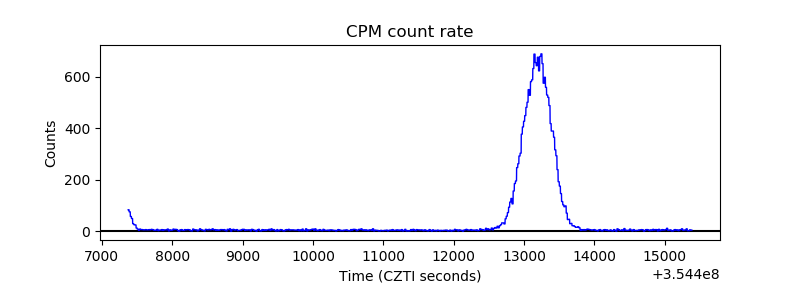 |
| CZT Counter | 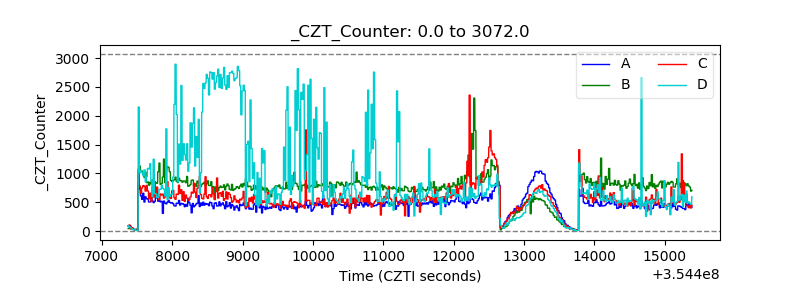 |
| +2.5 Volts monitor | 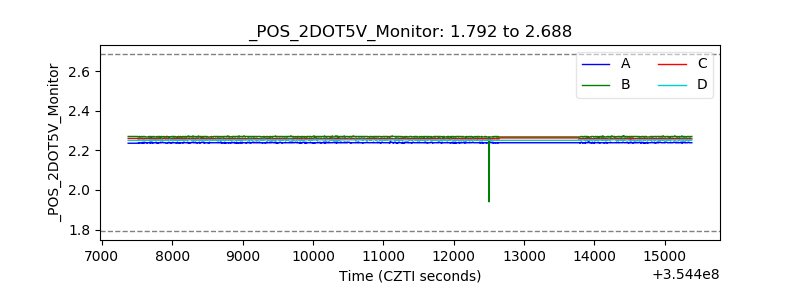 |
| +5 Volts monitor |  |
| _ROLL_ROT |  |
| _Roll_DEC |  |
| _Roll_RA | 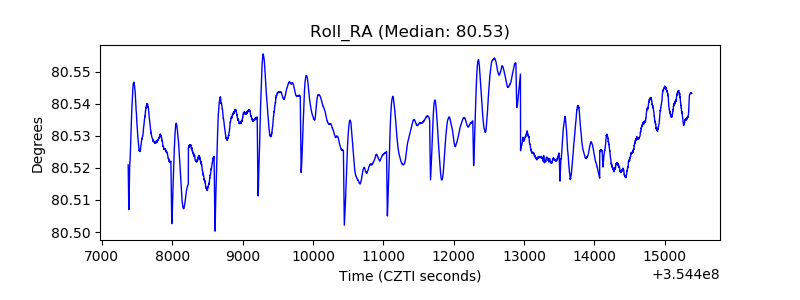 |
| Veto Counter | 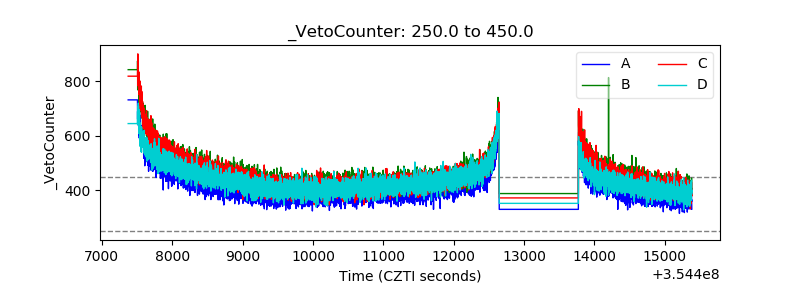 |