| Param | Original file | Final file |
|---|---|---|
| Filename | modeM0/AS1A10_093T01_9000004274_29691cztM0_level2.evt | modeM0/AS1A10_093T01_9000004274_29691cztM0_level2_quad_clean.evt |
| Size (bytes) | 566,328,960 | 70,655,040 |
| Size | 540.1 MB | 67.4 MB |
| Events in quadrant A | 2,977,060 | 442,041 |
| Events in quadrant B | 5,253,830 | 438,004 |
| Events in quadrant C | 3,757,328 | 414,284 |
| Events in quadrant D | 4,725,632 | 394,039 |
| Mode SS | |||
|---|---|---|---|
| Quadrant | BADHDUFLAG | Total packets | Discarded packets |
| A | 0 | 132 | 0 |
| B | 0 | 132 | 0 |
| C | 0 | 132 | 0 |
| D | 0 | 132 | 0 |
| Mode M9 | |||
|---|---|---|---|
| Quadrant | BADHDUFLAG | Total packets | Discarded packets |
| A | 0 | 7 | 0 |
| B | 0 | 7 | 0 |
| C | 0 | 7 | 0 |
| D | 0 | 7 | 0 |
| Mode M0 | |||
|---|---|---|---|
| Quadrant | BADHDUFLAG | Total packets | Discarded packets |
| A | 0 | 13169 | 1 |
| B | 0 | 20171 | 2 |
| C | 0 | 15140 | 1 |
| D | 0 | 18302 | 1 |
| Quadrant | Total seconds | Saturated seconds | Saturation percentage |
|---|---|---|---|
| A | 6456 | 43 | 0.666047% |
| B | 6456 | 191 | 2.958488% |
| C | 6456 | 261 | 4.042751% |
| D | 6456 | 352 | 5.452292% |
Noise dominated data is calculated using 1-second bins in cleaned event files. If a bin has >2000 counts, and if more than 50% of those come from <1% of pixels, then it is considered to be noise-dominated and hence unusable.
| Quadrant | # 1 sec bins | Bins with >0 counts | Bins with >2000 counts | High rate bins dominated by noise | Noise dominated (total time) | Noise dominated (detector-on time) | Marked lightcurve |
|---|---|---|---|---|---|---|---|
| A | 7231 | 6457 | 0 | 0 | 0.00% | 0.00% |  |
| B | 7231 | 6456 | 33 | 33 | 0.46% | 0.51% |  |
| C | 7231 | 6457 | 74 | 74 | 1.02% | 1.15% |  |
| D | 7231 | 6457 | 274 | 274 | 3.79% | 4.24% |  |
Top three noisy pixels from each quadrant. If the there are fewer than three noisy pixels in the level2.evt file, extra rows are filled as -1
| Pixel properties | Quadrant properties | ||||||
|---|---|---|---|---|---|---|---|
| Quadrant | DetID | PixID | Counts | Sigma | Mean | Median | Sigma |
| A | 13 | 254 | 12878 | 78.53 | 771 | 753 | 154.4 |
| A | 3 | 137 | 7543 | 43.98 | 771 | 753 | 154.4 |
| A | 0 | 226 | 6513 | 37.3 | 771 | 753 | 154.4 |
| B | 6 | 159 | 1985408 | 13625.81 | 763 | 743 | 145.7 |
| B | 0 | 229 | 236658 | 1619.68 | 763 | 743 | 145.7 |
| B | 12 | 111 | 17841 | 117.38 | 763 | 743 | 145.7 |
| C | 3 | 233 | 585201 | 3404.62 | 734 | 739 | 171.7 |
| C | 14 | 238 | 132182 | 765.68 | 734 | 739 | 171.7 |
| C | 15 | 208 | 88068 | 508.71 | 734 | 739 | 171.7 |
| D | 7 | 80 | 895829 | 5215.86 | 731 | 711 | 171.6 |
| D | 8 | 195 | 609734 | 3548.78 | 731 | 711 | 171.6 |
| D | 13 | 153 | 129917 | 752.88 | 731 | 711 | 171.6 |
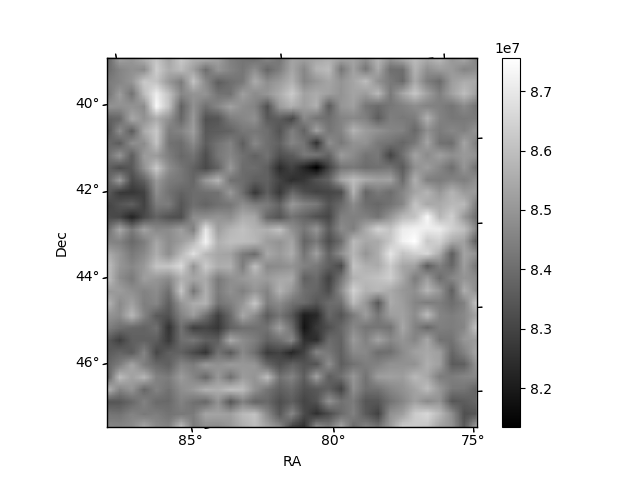
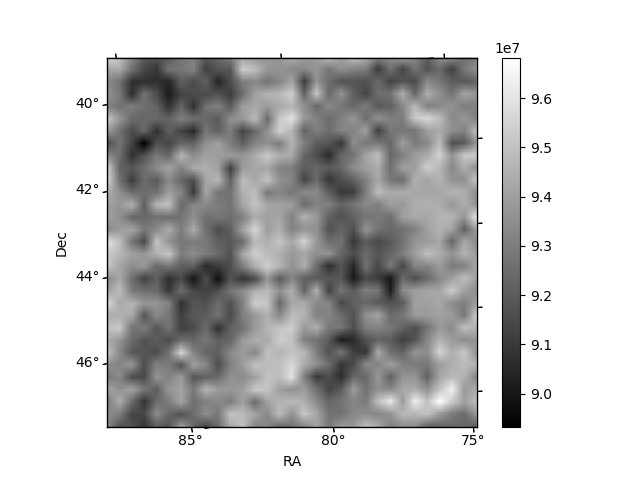
Histogram calculated using DETX and DETY for each event in the final _common_clean file
| Quadrant A | 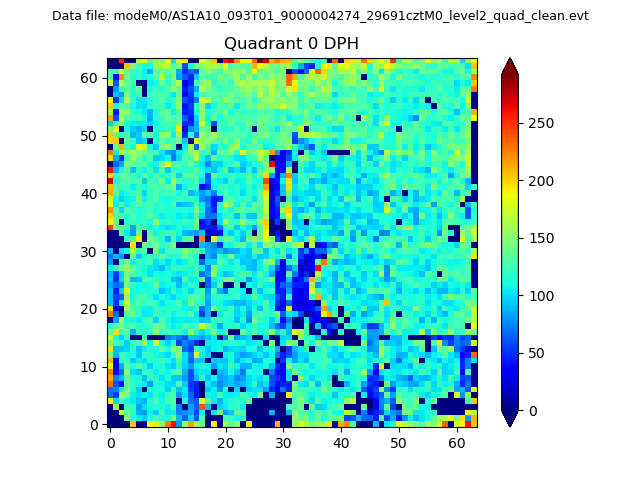 |
 |
Quadrant B |
|---|---|---|---|
| Quadrant D |  |
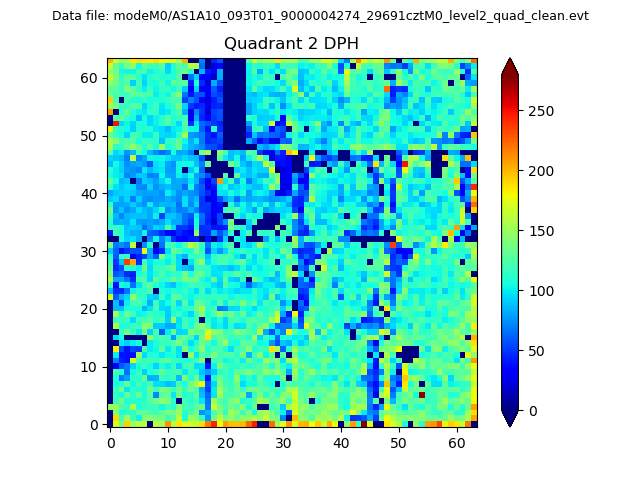 |
Quadrant C |
| Plot type | Count rate plots | Images |
|---|---|---|
| Comparison with Poisson distribution Blue bars denote a histogram of data divided into 1 sec bins. Red curve is a Poisson curve with rate = median count rate of data. |
 |
 |
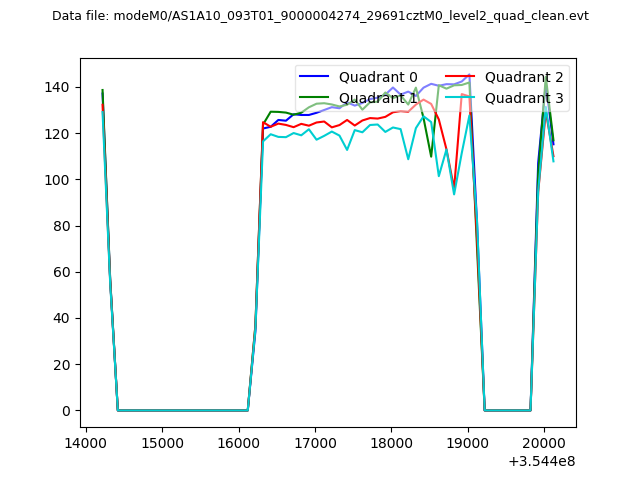
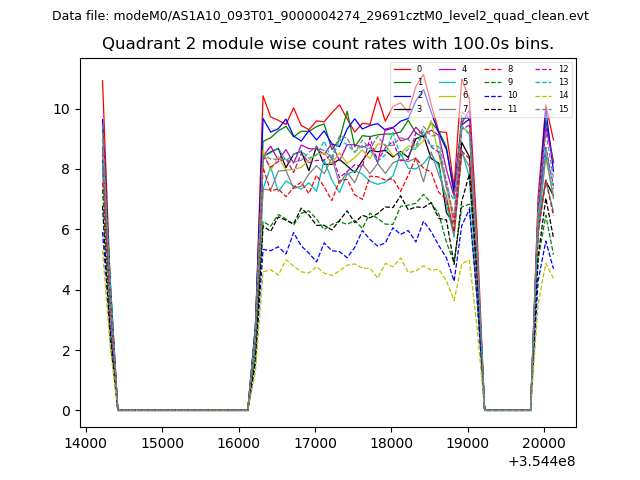
| Quadrant-wise count rates Data is divided into 100 sec bins |
 |
|
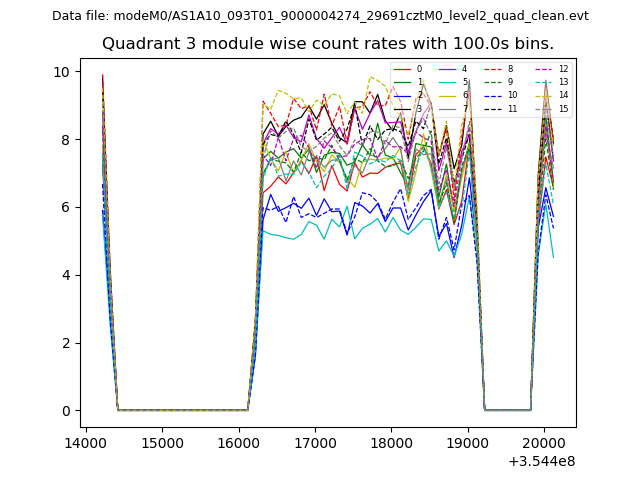
| Module-wise count rates for Quadrant A Data is divided into 100 sec bins |
 |
 |
| Module-wise count rates for Quadrant B Data is divided into 100 sec bins |
 |
 |
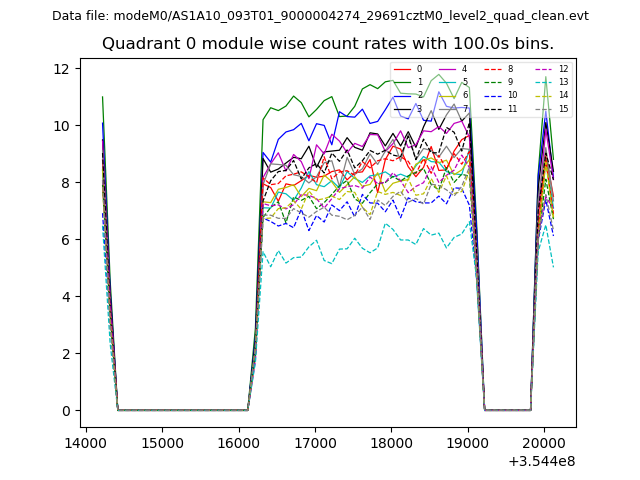
| Module-wise count rates for Quadrant C Data is divided into 100 sec bins |
 |
 |
| Module-wise count rates for Quadrant D Data is divided into 100 sec bins |
 |
 |
| Parameter | Plot |
|---|---|
| CZT HV Monitor | 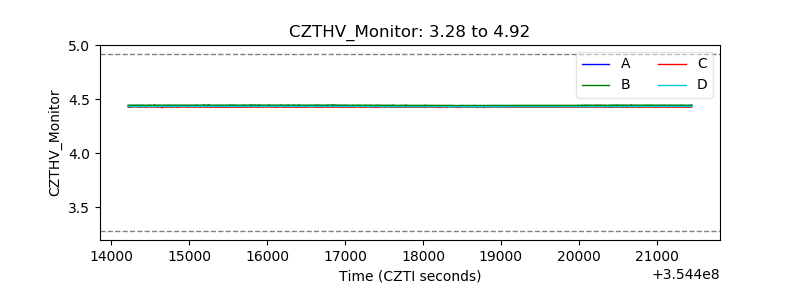 |
| D_VDD | 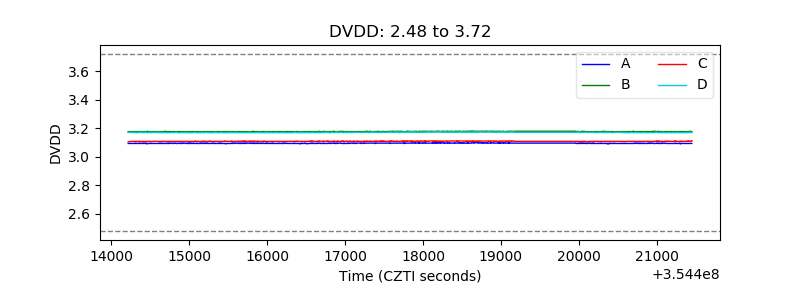 |
| Temperature 1 | 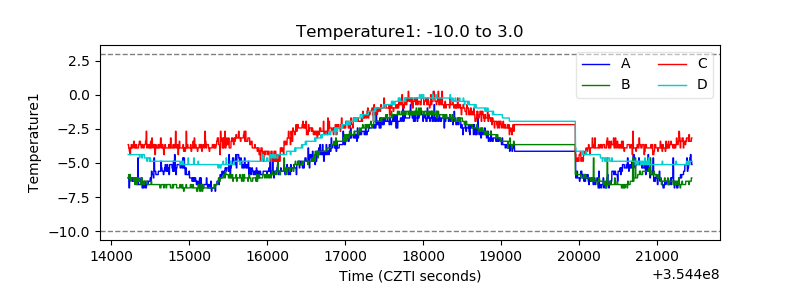 |
| Veto HV Monitor | 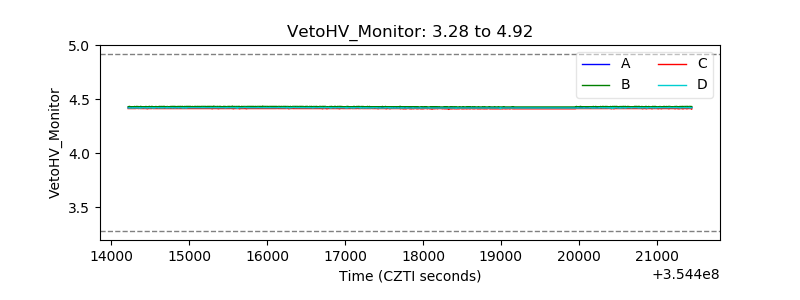 |
| Veto LLD | 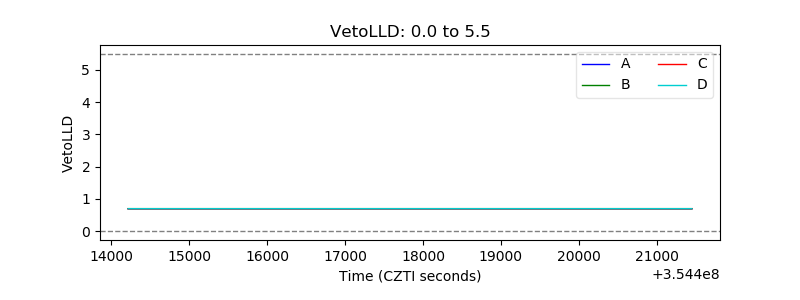 |
| Alpha Counter | 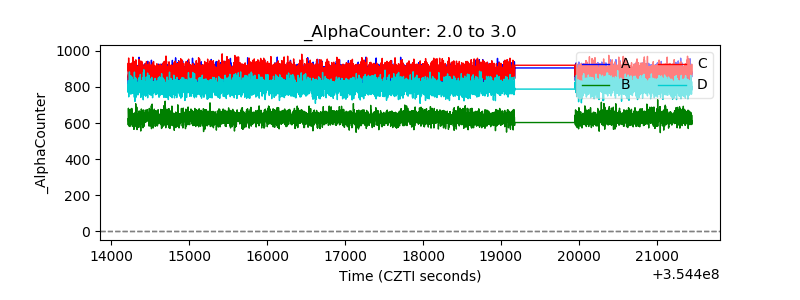 |
| _CPM_Rate | 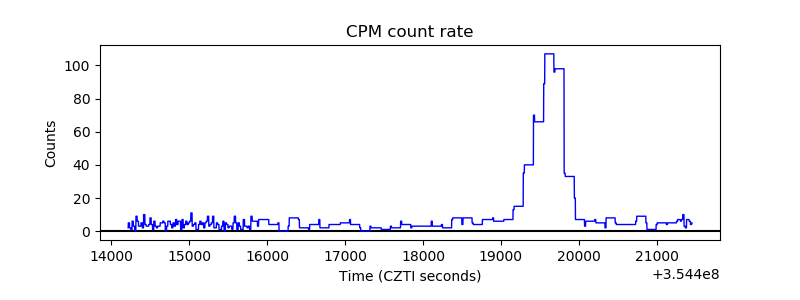 |
| CZT Counter | 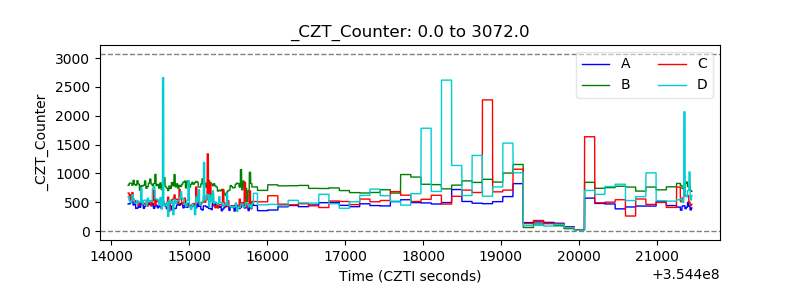 |
| +2.5 Volts monitor | 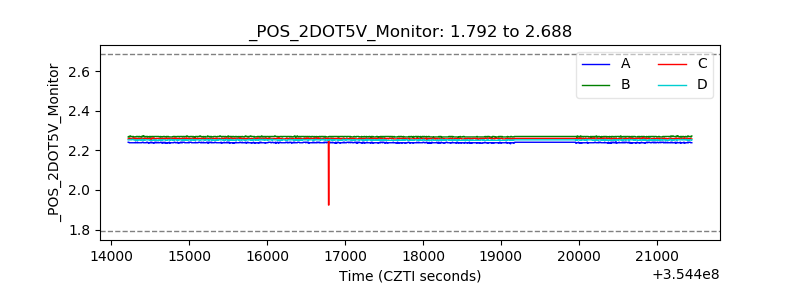 |
| +5 Volts monitor |  |
| _ROLL_ROT |  |
| _Roll_DEC |  |
| _Roll_RA | 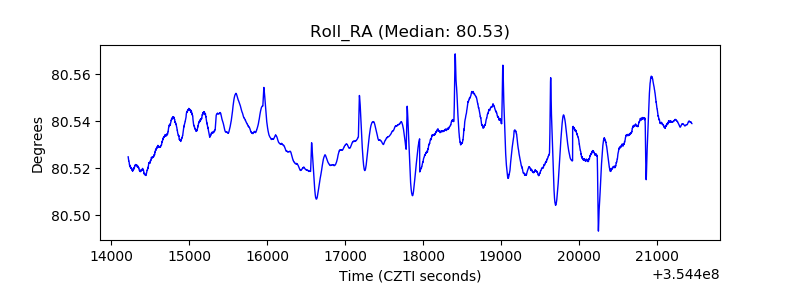 |
| Veto Counter | 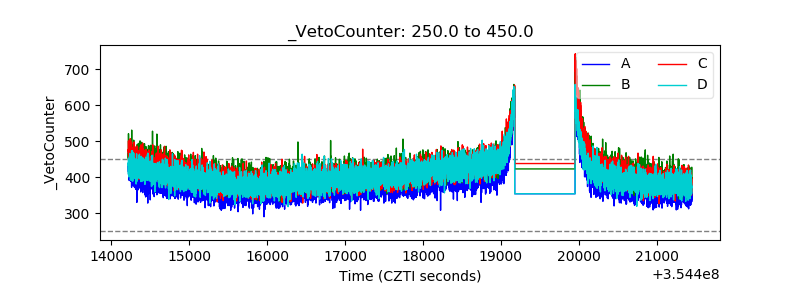 |