| Param | Original file | Final file |
|---|---|---|
| Filename | modeM0/AS1A10_093T01_9000004274_29692cztM0_level2.evt | modeM0/AS1A10_093T01_9000004274_29692cztM0_level2_quad_clean.evt |
| Size (bytes) | 672,759,360 | 83,050,560 |
| Size | 641.6 MB | 79.2 MB |
| Events in quadrant A | 3,526,165 | 515,003 |
| Events in quadrant B | 6,071,045 | 514,740 |
| Events in quadrant C | 4,838,962 | 483,405 |
| Events in quadrant D | 5,426,541 | 474,686 |
| Mode SS | |||
|---|---|---|---|
| Quadrant | BADHDUFLAG | Total packets | Discarded packets |
| A | 0 | 154 | 0 |
| B | 0 | 154 | 0 |
| C | 0 | 154 | 0 |
| D | 0 | 154 | 0 |
| Mode M9 | |||
|---|---|---|---|
| Quadrant | BADHDUFLAG | Total packets | Discarded packets |
| A | 0 | 4 | 0 |
| B | 0 | 5 | 0 |
| C | 0 | 5 | 0 |
| D | 0 | 5 | 0 |
| Mode M0 | |||
|---|---|---|---|
| Quadrant | BADHDUFLAG | Total packets | Discarded packets |
| A | 0 | 15583 | 2 |
| B | 0 | 23361 | 2 |
| C | 0 | 19222 | 2 |
| D | 0 | 21247 | 2 |
| Quadrant | Total seconds | Saturated seconds | Saturation percentage |
|---|---|---|---|
| A | 7568 | 137 | 1.810254% |
| B | 7568 | 298 | 3.937632% |
| C | 7568 | 336 | 4.439746% |
| D | 7568 | 261 | 3.448732% |
Noise dominated data is calculated using 1-second bins in cleaned event files. If a bin has >2000 counts, and if more than 50% of those come from <1% of pixels, then it is considered to be noise-dominated and hence unusable.
| Quadrant | # 1 sec bins | Bins with >0 counts | Bins with >2000 counts | High rate bins dominated by noise | Noise dominated (total time) | Noise dominated (detector-on time) | Marked lightcurve |
|---|---|---|---|---|---|---|---|
| A | 7858 | 7569 | 0 | 0 | 0.00% | 0.00% | 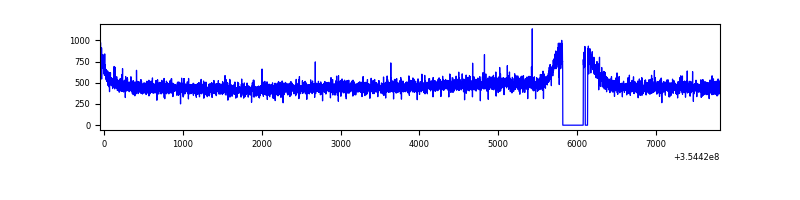 |
| B | 7858 | 7569 | 17 | 17 | 0.22% | 0.22% | 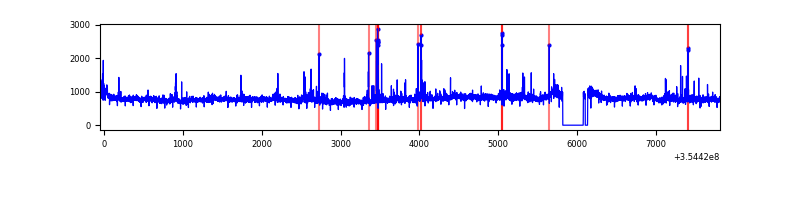 |
| C | 7858 | 7570 | 18 | 18 | 0.23% | 0.24% | 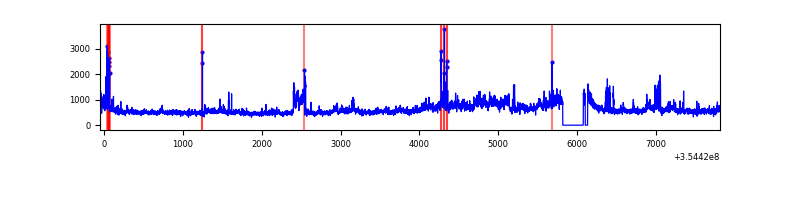 |
| D | 7858 | 7568 | 133 | 133 | 1.69% | 1.76% | 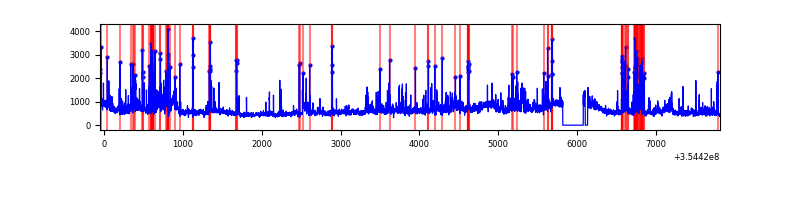 |
Top three noisy pixels from each quadrant. If the there are fewer than three noisy pixels in the level2.evt file, extra rows are filled as -1
| Pixel properties | Quadrant properties | ||||||
|---|---|---|---|---|---|---|---|
| Quadrant | DetID | PixID | Counts | Sigma | Mean | Median | Sigma |
| A | 13 | 254 | 15347 | 78.73 | 912 | 891 | 183.6 |
| A | 3 | 137 | 9169 | 45.08 | 912 | 891 | 183.6 |
| A | 0 | 226 | 7738 | 37.29 | 912 | 891 | 183.6 |
| B | 6 | 159 | 2265092 | 13108.35 | 905 | 881 | 172.7 |
| B | 0 | 229 | 146846 | 845.04 | 905 | 881 | 172.7 |
| B | 5 | 255 | 22610 | 125.79 | 905 | 881 | 172.7 |
| C | 3 | 233 | 1119085 | 5443.3 | 876 | 878 | 205.4 |
| C | 14 | 238 | 150421 | 727.96 | 876 | 878 | 205.4 |
| C | 10 | 22 | 64653 | 310.45 | 876 | 878 | 205.4 |
| D | 8 | 195 | 981525 | 4676.95 | 880 | 855 | 209.7 |
| D | 13 | 189 | 500435 | 2382.57 | 880 | 855 | 209.7 |
| D | 7 | 80 | 350437 | 1667.21 | 880 | 855 | 209.7 |
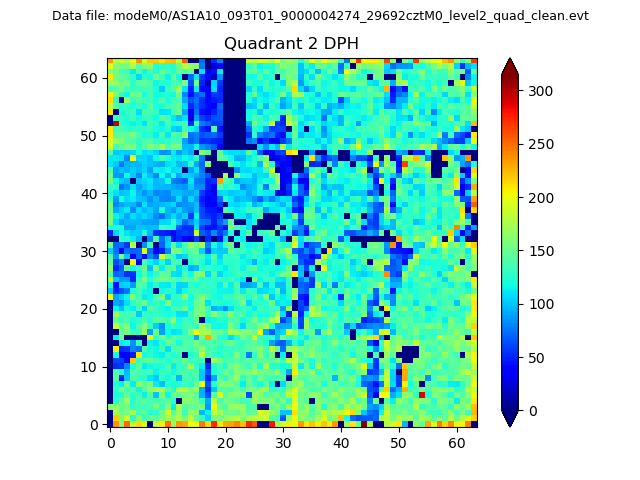
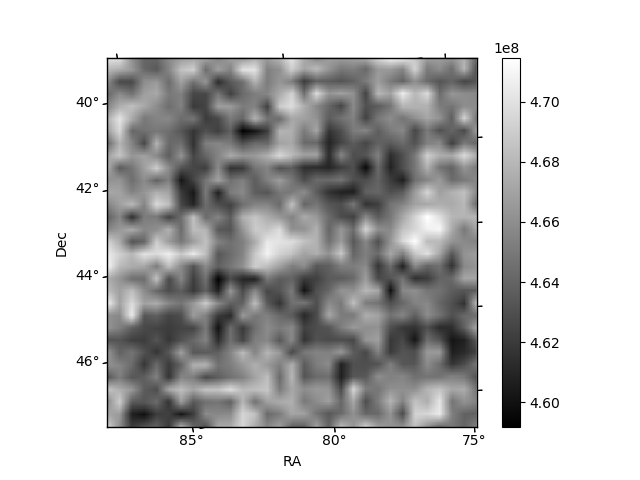
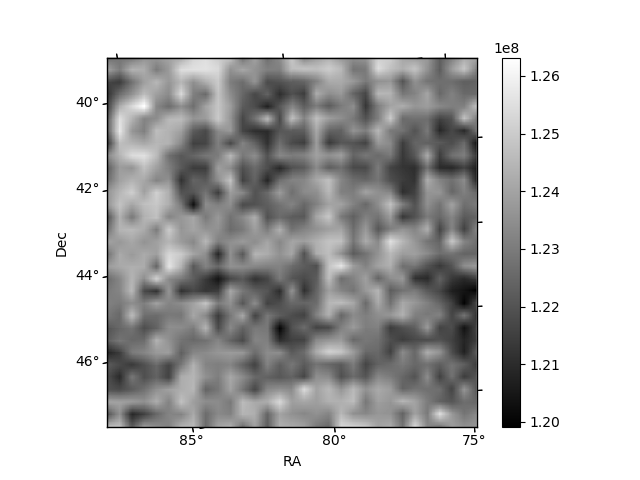
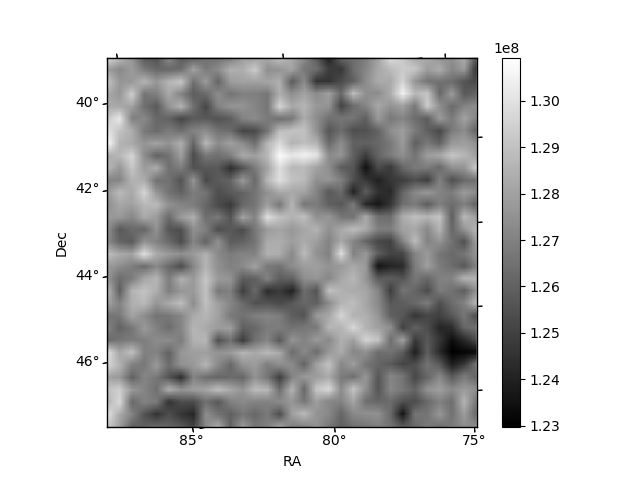
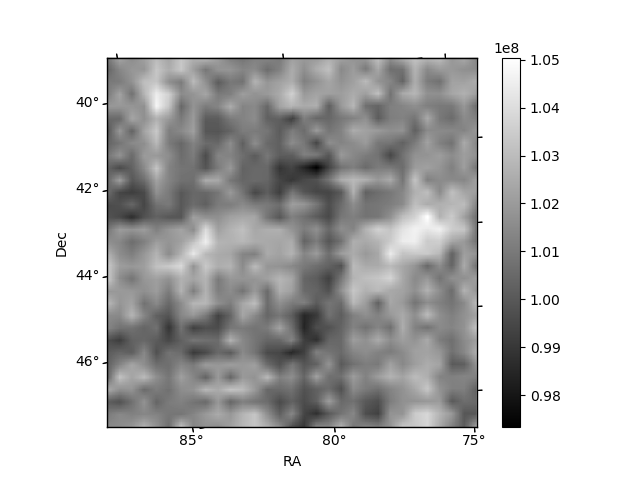
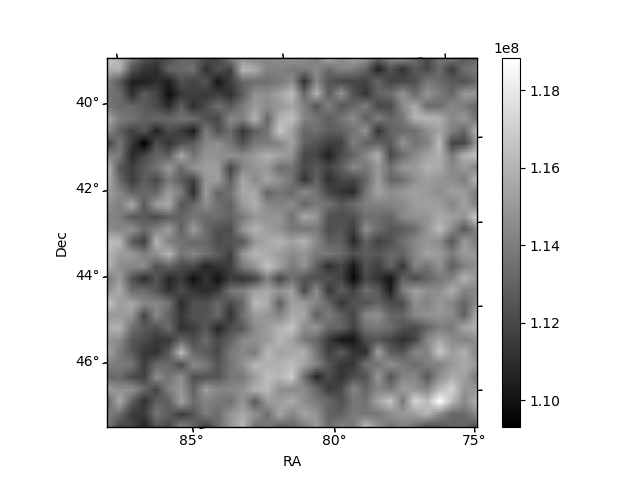
Histogram calculated using DETX and DETY for each event in the final _common_clean file
| Quadrant A | 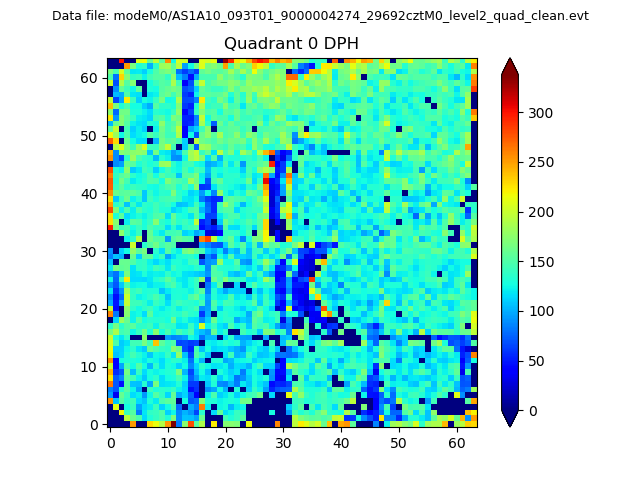 |
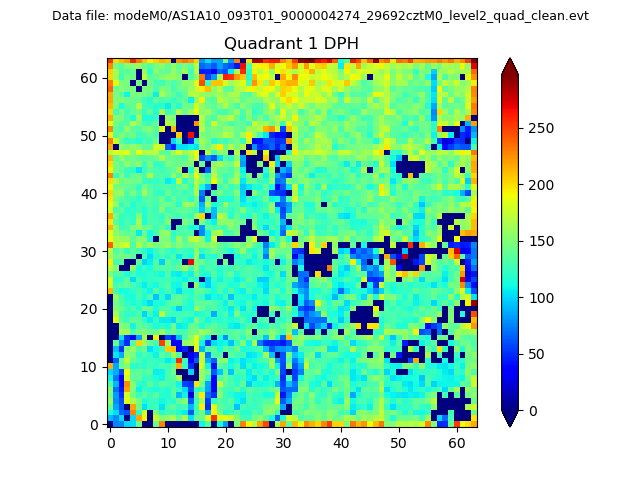 |
Quadrant B |
|---|---|---|---|
| Quadrant D | 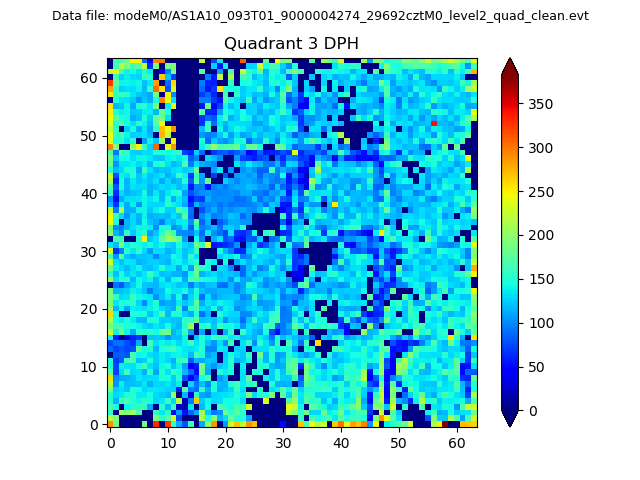 |
 |
Quadrant C |
| Plot type | Count rate plots | Images |
|---|---|---|
| Comparison with Poisson distribution Blue bars denote a histogram of data divided into 1 sec bins. Red curve is a Poisson curve with rate = median count rate of data. |
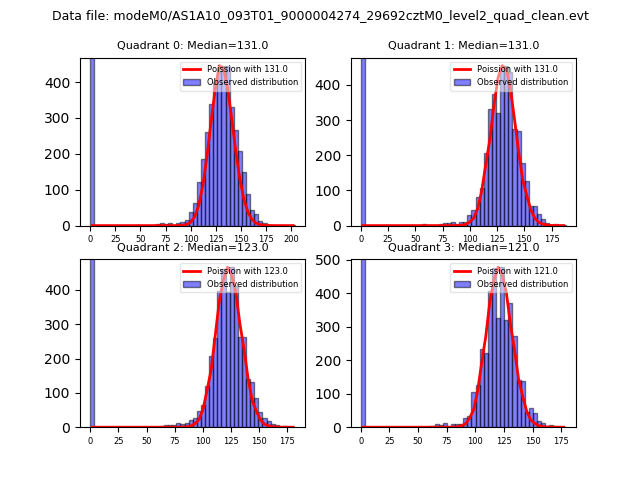 |
 |
| Quadrant-wise count rates Data is divided into 100 sec bins |
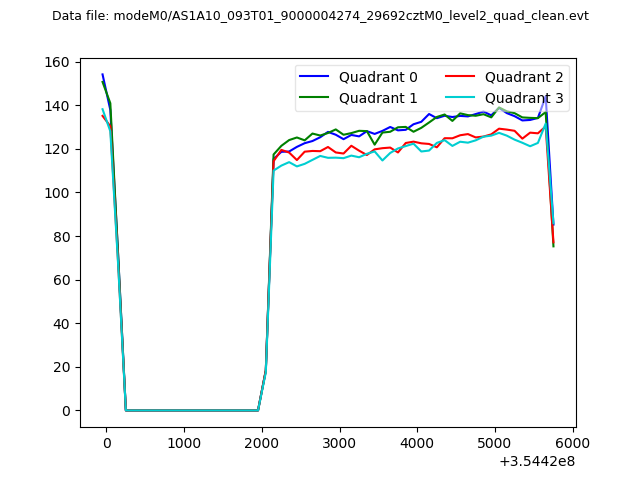 |
|
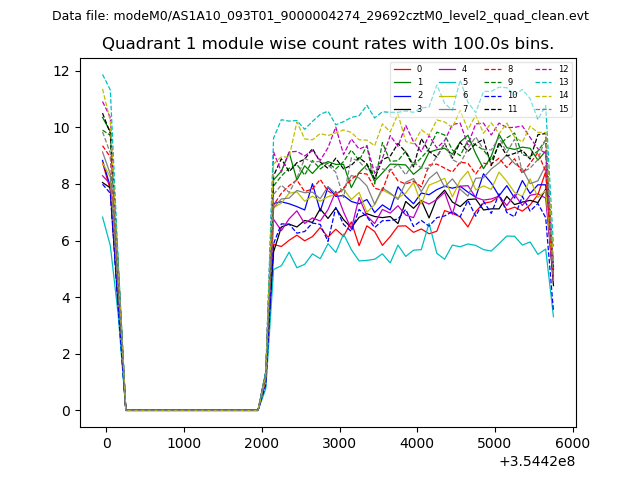
| Module-wise count rates for Quadrant A Data is divided into 100 sec bins |
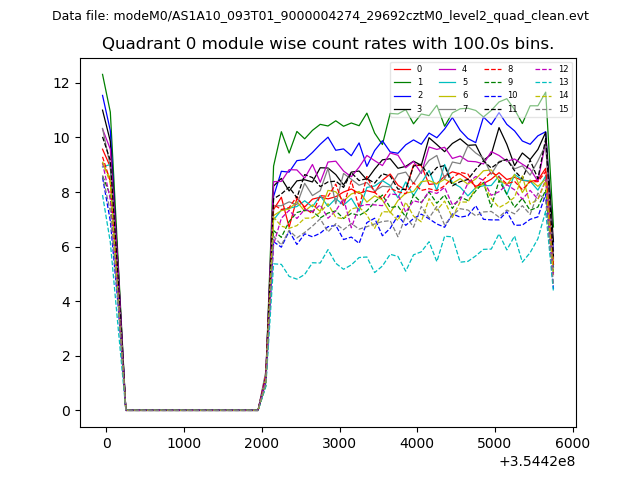 |
 |
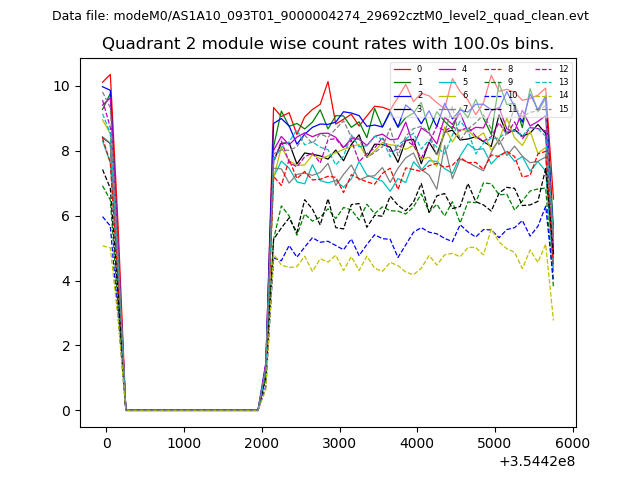
| Module-wise count rates for Quadrant B Data is divided into 100 sec bins |
 |
 |
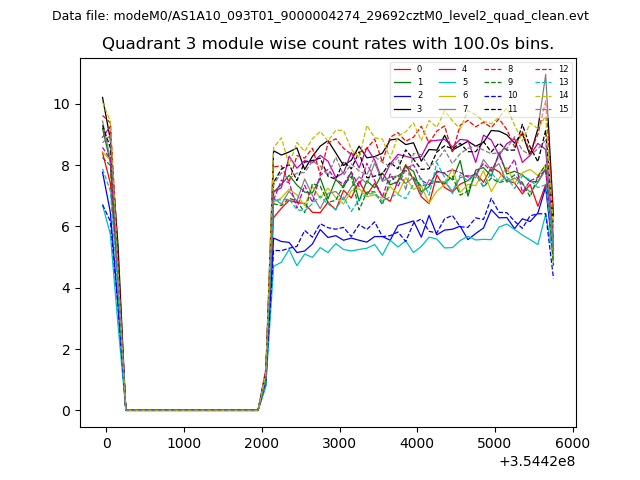
| Module-wise count rates for Quadrant C Data is divided into 100 sec bins |
 |
 |
| Module-wise count rates for Quadrant D Data is divided into 100 sec bins |
 |
 |
| Parameter | Plot |
|---|---|
| CZT HV Monitor | 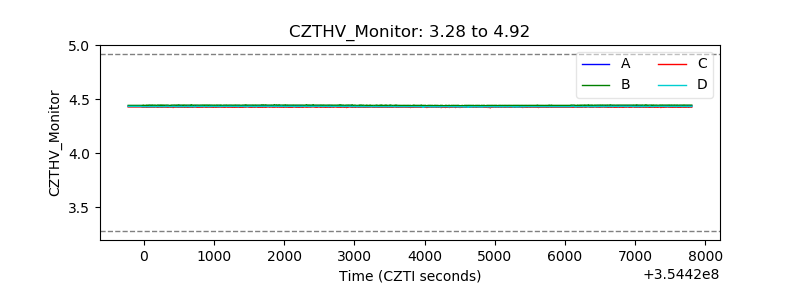 |
| D_VDD | 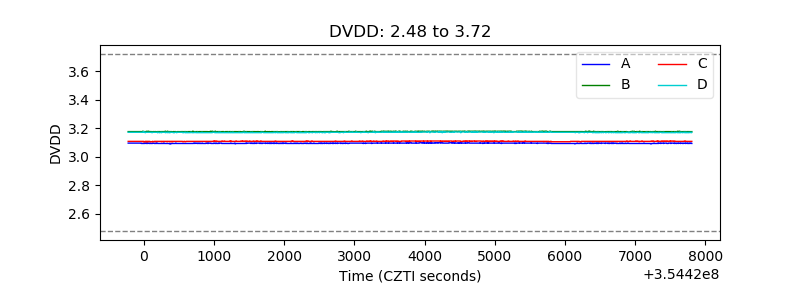 |
| Temperature 1 | 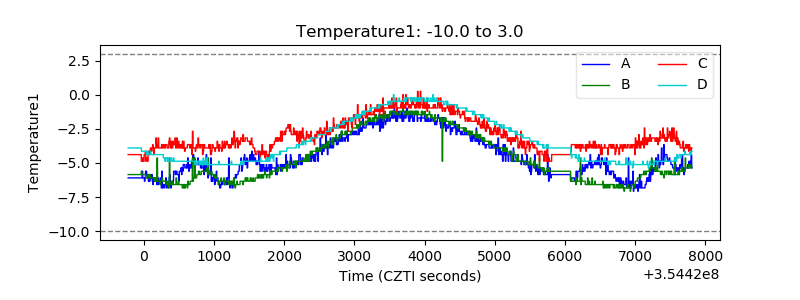 |
| Veto HV Monitor | 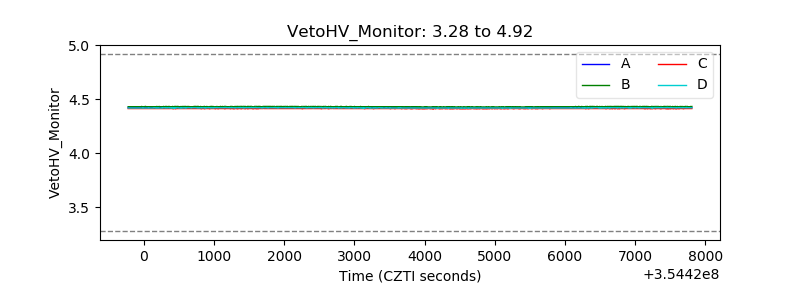 |
| Veto LLD | 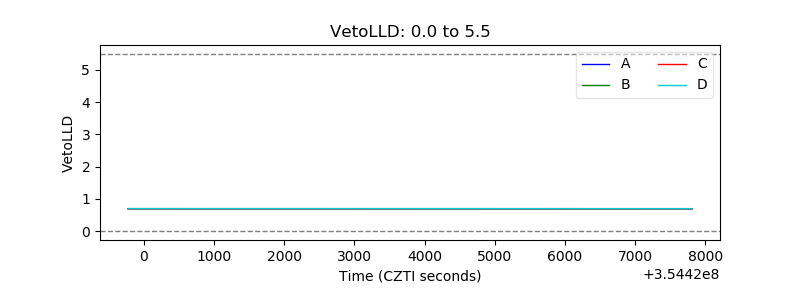 |
| Alpha Counter | 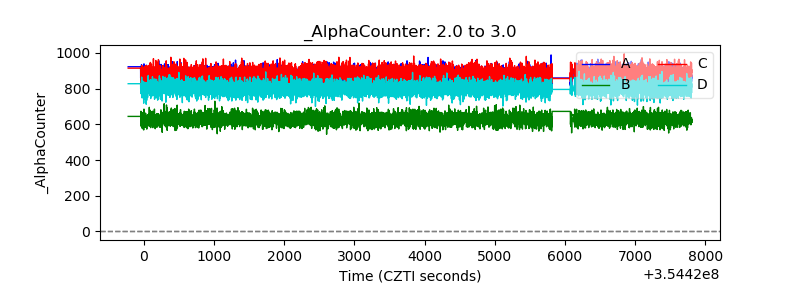 |
| _CPM_Rate | 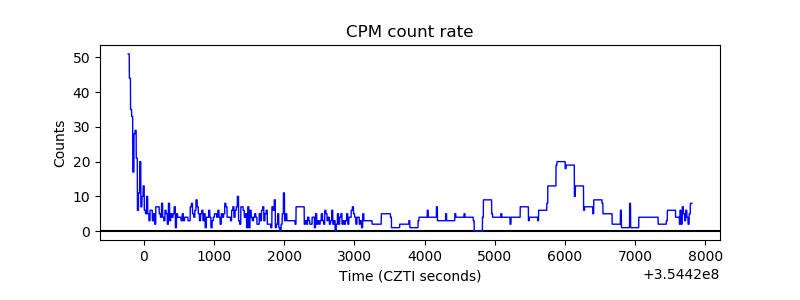 |
| CZT Counter | 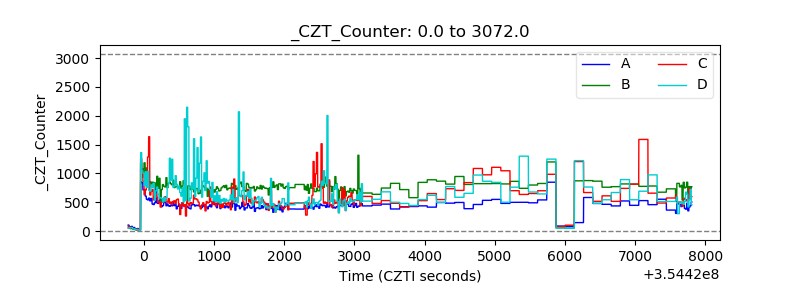 |
| +2.5 Volts monitor | 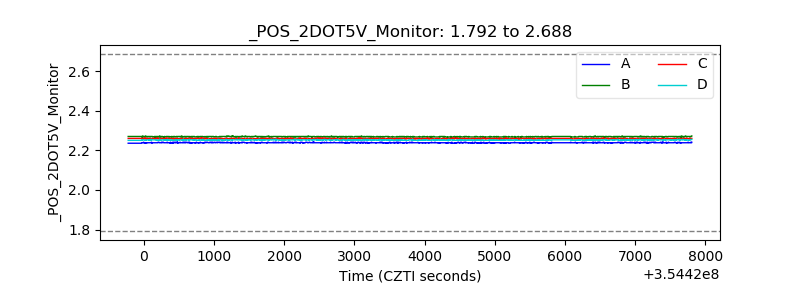 |
| +5 Volts monitor | 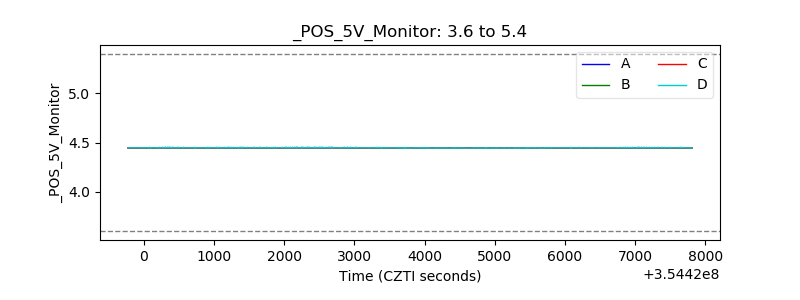 |
| _ROLL_ROT | 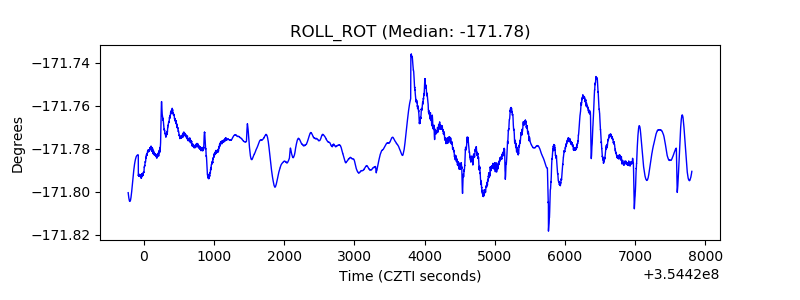 |
| _Roll_DEC | 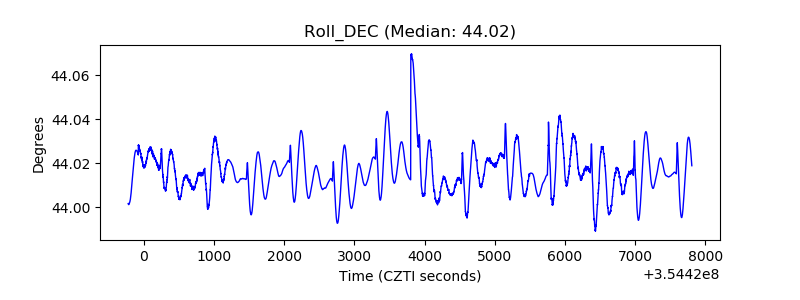 |
| _Roll_RA | 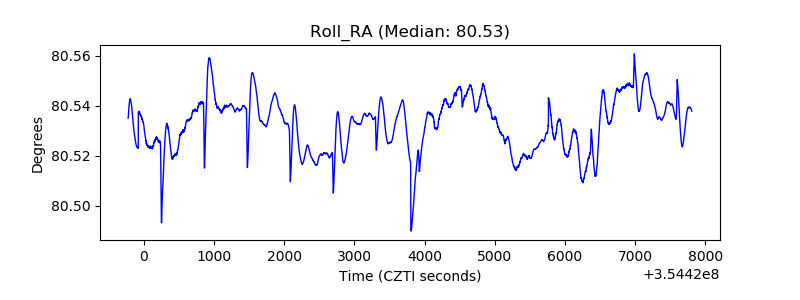 |
| Veto Counter | 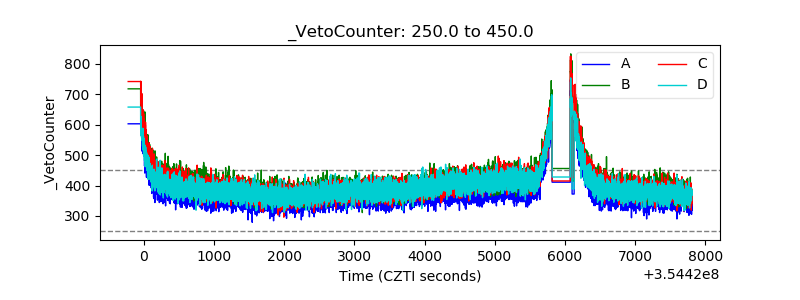 |