| Param | Original file | Final file |
|---|---|---|
| Filename | modeM0/AS1A10_093T01_9000004274_29693cztM0_level2.evt | modeM0/AS1A10_093T01_9000004274_29693cztM0_level2_quad_clean.evt |
| Size (bytes) | 373,046,400 | 51,007,680 |
| Size | 355.8 MB | 48.6 MB |
| Events in quadrant A | 1,849,724 | 335,737 |
| Events in quadrant B | 3,159,629 | 326,861 |
| Events in quadrant C | 2,848,950 | 301,055 |
| Events in quadrant D | 3,162,026 | 292,739 |
| Mode SS | |||
|---|---|---|---|
| Quadrant | BADHDUFLAG | Total packets | Discarded packets |
| A | 0 | 88 | 4 |
| B | 0 | 88 | 2 |
| C | 0 | 88 | 4 |
| D | 0 | 88 | 6 |
| Mode M0 | |||
|---|---|---|---|
| Quadrant | BADHDUFLAG | Total packets | Discarded packets |
| A | 0 | 8792 | 458 |
| B | 0 | 13374 | 977 |
| C | 0 | 12273 | 1061 |
| D | 0 | 13200 | 1066 |
| Quadrant | Total seconds | Saturated seconds | Saturation percentage |
|---|---|---|---|
| A | 4120 | 1 | 0.024272% |
| B | 4055 | 33 | 0.813810% |
| C | 4054 | 183 | 4.514060% |
| D | 4055 | 166 | 4.093711% |
Noise dominated data is calculated using 1-second bins in cleaned event files. If a bin has >2000 counts, and if more than 50% of those come from <1% of pixels, then it is considered to be noise-dominated and hence unusable.
| Quadrant | # 1 sec bins | Bins with >0 counts | Bins with >2000 counts | High rate bins dominated by noise | Noise dominated (total time) | Noise dominated (detector-on time) | Marked lightcurve |
|---|---|---|---|---|---|---|---|
| A | 4352 | 4236 | 1 | 1 | 0.02% | 0.02% | 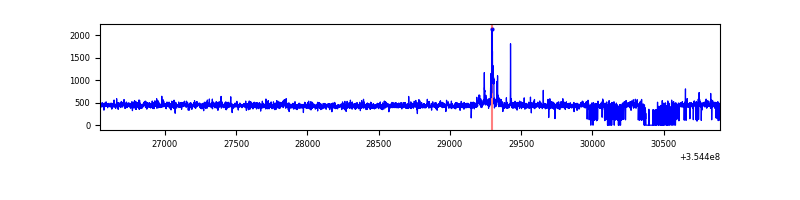 |
| B | 4351 | 4156 | 17 | 17 | 0.39% | 0.41% | 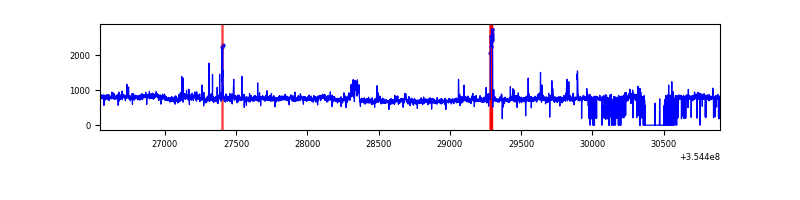 |
| C | 4352 | 4152 | 51 | 51 | 1.17% | 1.23% | 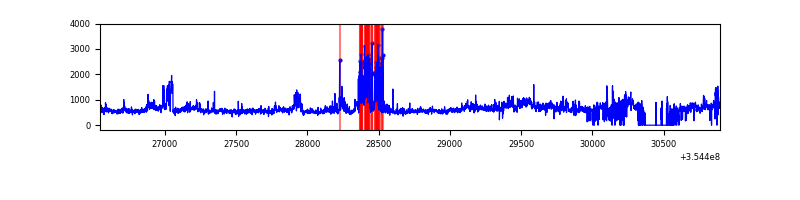 |
| D | 4352 | 4157 | 173 | 173 | 3.98% | 4.16% | 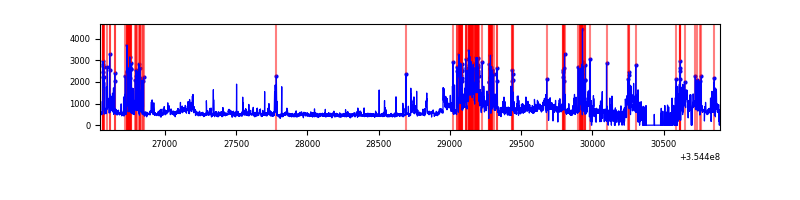 |
Top three noisy pixels from each quadrant. If the there are fewer than three noisy pixels in the level2.evt file, extra rows are filled as -1
| Pixel properties | Quadrant properties | ||||||
|---|---|---|---|---|---|---|---|
| Quadrant | DetID | PixID | Counts | Sigma | Mean | Median | Sigma |
| A | 12 | 16 | 35641 | 367.59 | 468 | 457 | 95.7 |
| A | 12 | 194 | 8703 | 86.15 | 468 | 457 | 95.7 |
| A | 13 | 254 | 8485 | 83.87 | 468 | 457 | 95.7 |
| B | 6 | 159 | 1197818 | 13524.42 | 455 | 444 | 88.5 |
| B | 0 | 229 | 98001 | 1101.91 | 455 | 444 | 88.5 |
| B | 0 | 190 | 31159 | 346.93 | 455 | 444 | 88.5 |
| C | 3 | 233 | 769574 | 7559.12 | 432 | 434 | 101.7 |
| C | 10 | 22 | 207663 | 2036.65 | 432 | 434 | 101.7 |
| C | 14 | 238 | 115820 | 1134.02 | 432 | 434 | 101.7 |
| D | 7 | 80 | 534375 | 5066.41 | 437 | 424 | 105.4 |
| D | 8 | 195 | 482893 | 4577.92 | 437 | 424 | 105.4 |
| D | 13 | 189 | 243119 | 2302.82 | 437 | 424 | 105.4 |
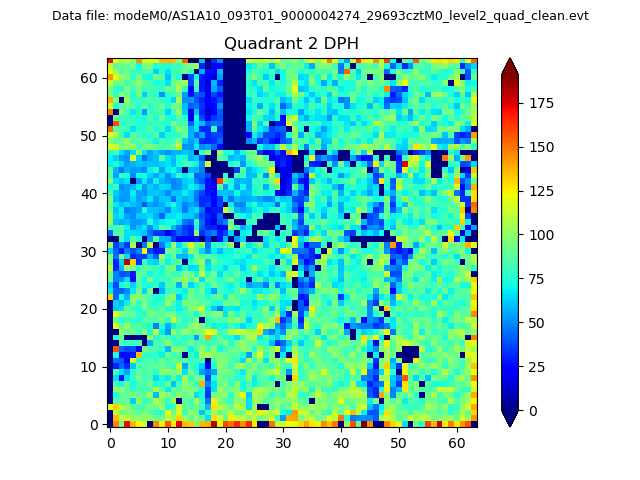
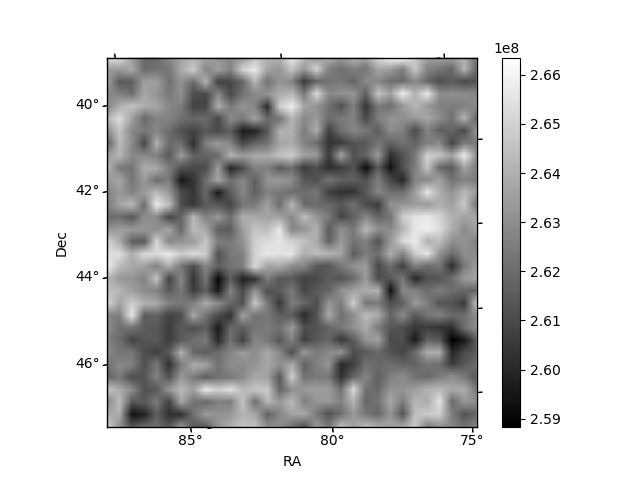
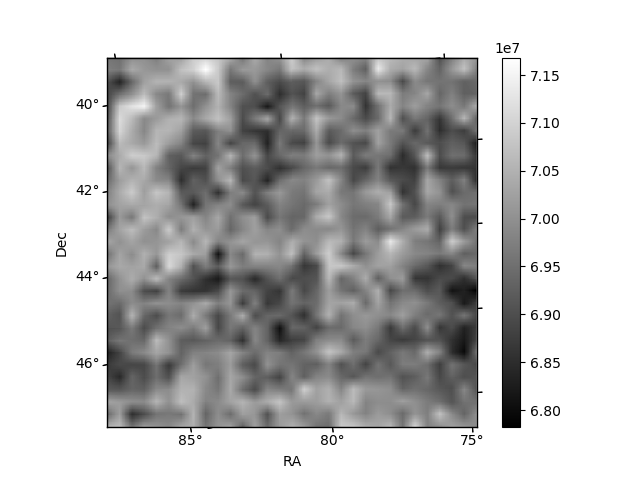
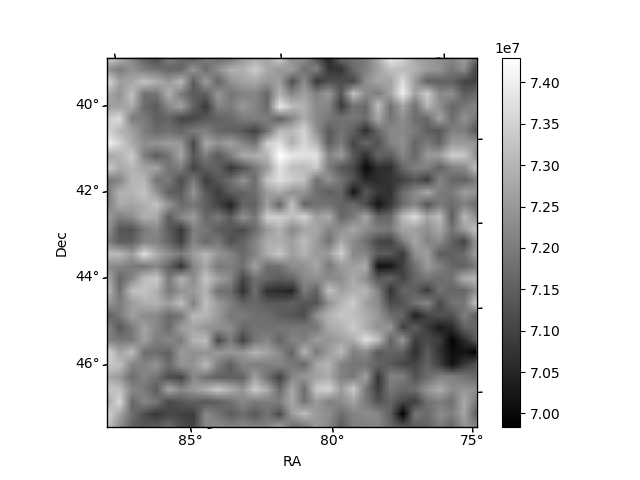
Histogram calculated using DETX and DETY for each event in the final _common_clean file
| Quadrant A | 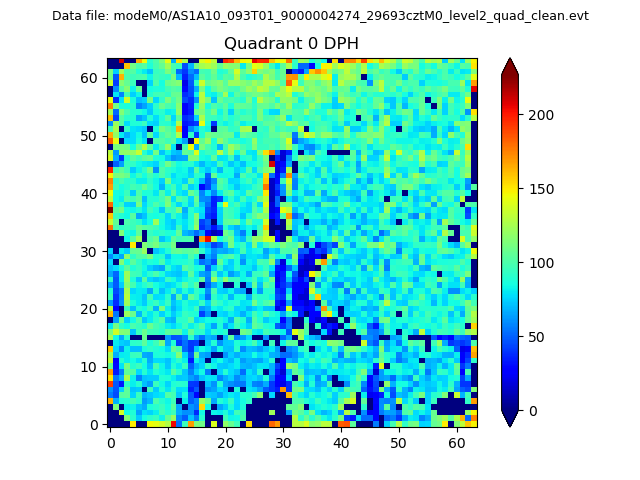 |
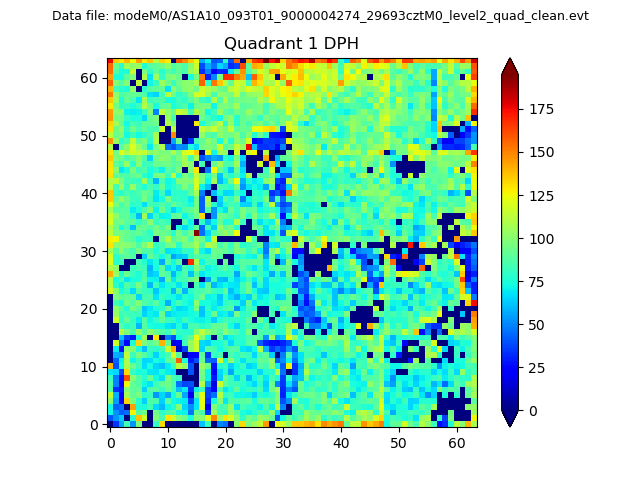 |
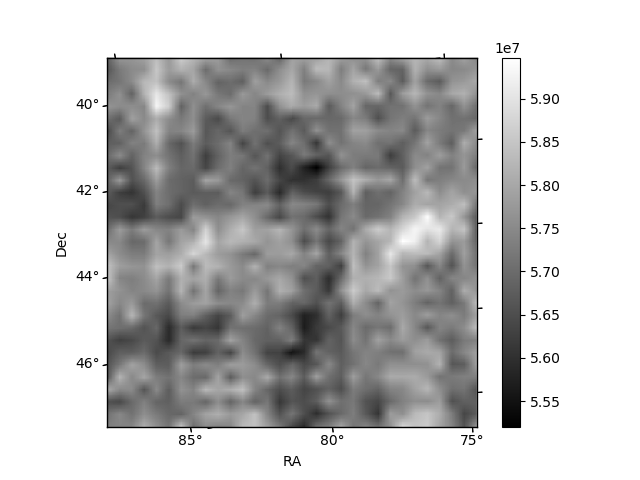
Quadrant B |
|---|---|---|---|
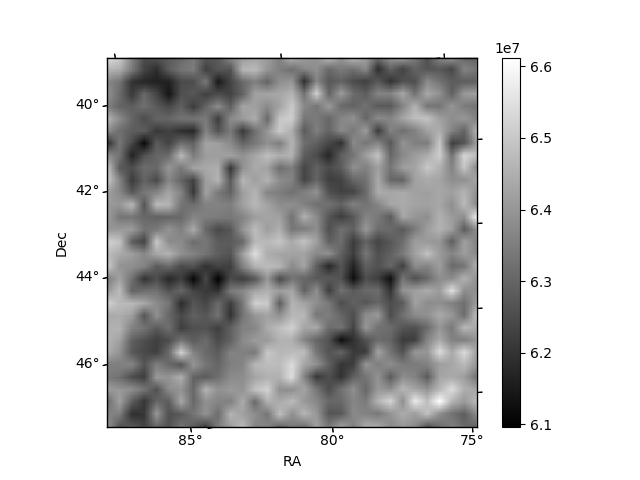
| Quadrant D | 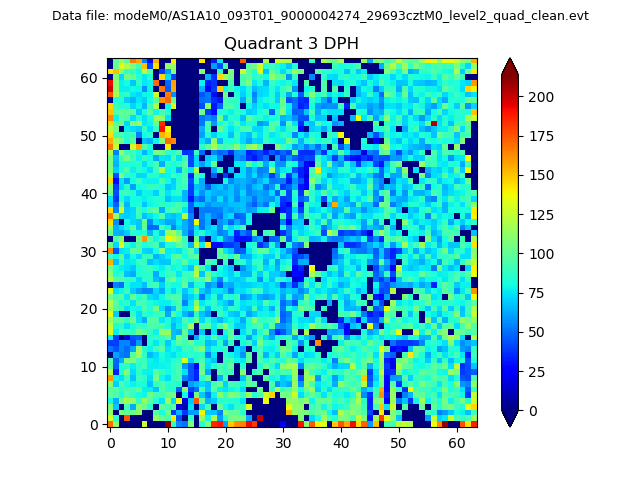 |
 |
Quadrant C |
| Plot type | Count rate plots | Images |
|---|---|---|
| Comparison with Poisson distribution Blue bars denote a histogram of data divided into 1 sec bins. Red curve is a Poisson curve with rate = median count rate of data. |
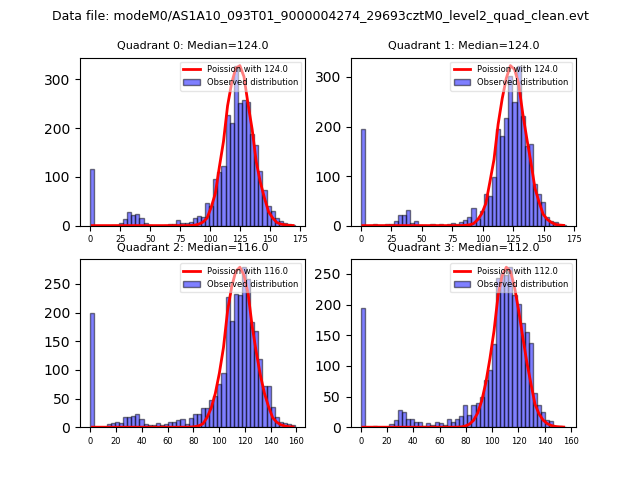 |
 |
| Quadrant-wise count rates Data is divided into 100 sec bins |
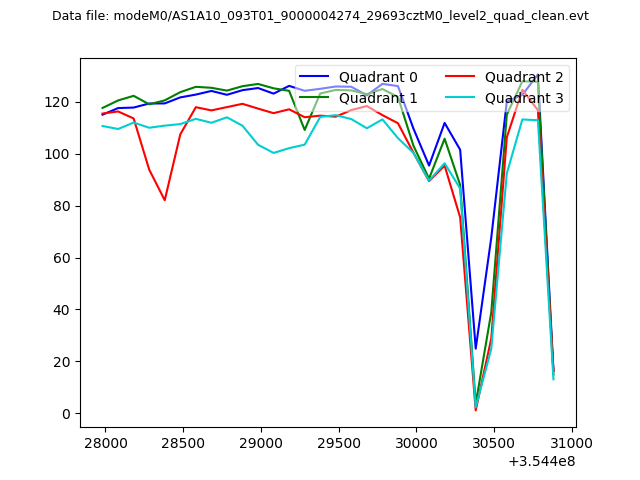 |
|
| Module-wise count rates for Quadrant A Data is divided into 100 sec bins |
 |
 |
| Module-wise count rates for Quadrant B Data is divided into 100 sec bins |
 |
 |
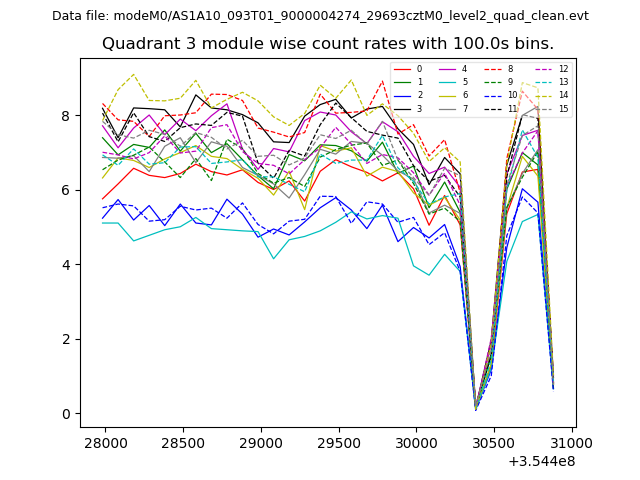
| Module-wise count rates for Quadrant C Data is divided into 100 sec bins |
 |
 |
| Module-wise count rates for Quadrant D Data is divided into 100 sec bins |
 |
 |
| Parameter | Plot |
|---|---|
| CZT HV Monitor |  |
| D_VDD | 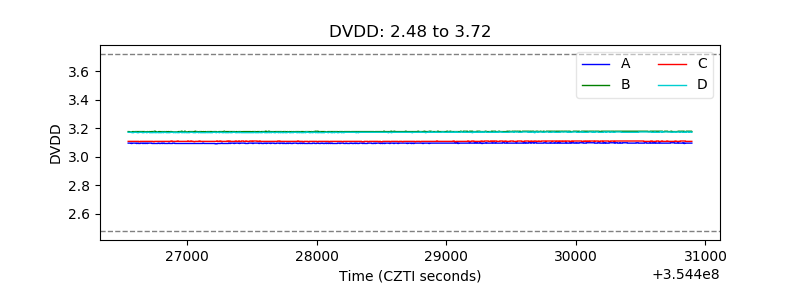 |
| Temperature 1 | 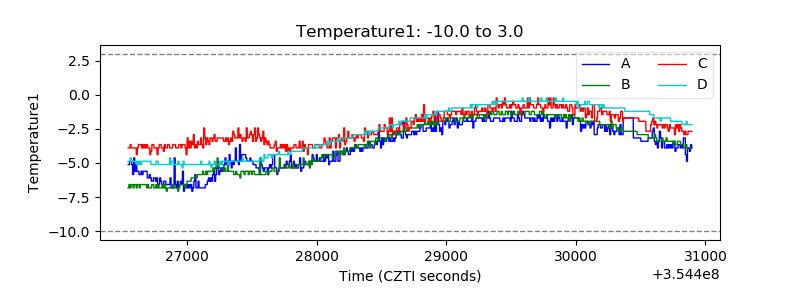 |
| Veto HV Monitor | 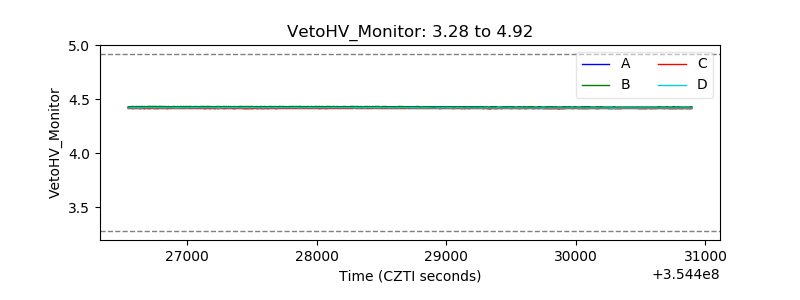 |
| Veto LLD | 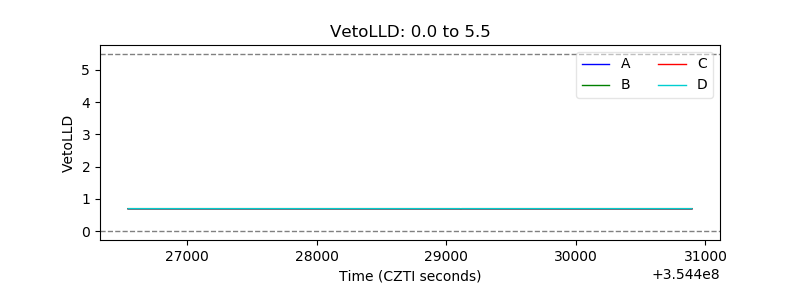 |
| Alpha Counter | 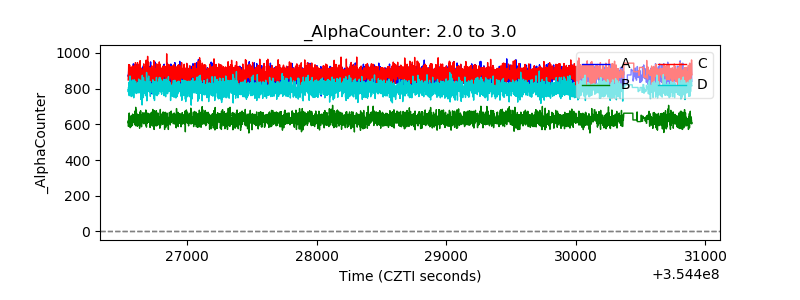 |
| _CPM_Rate | 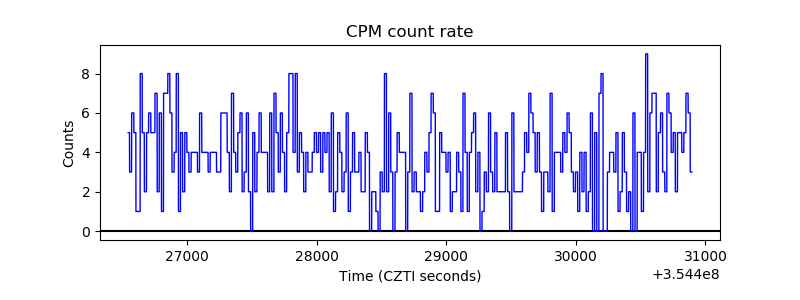 |
| CZT Counter | 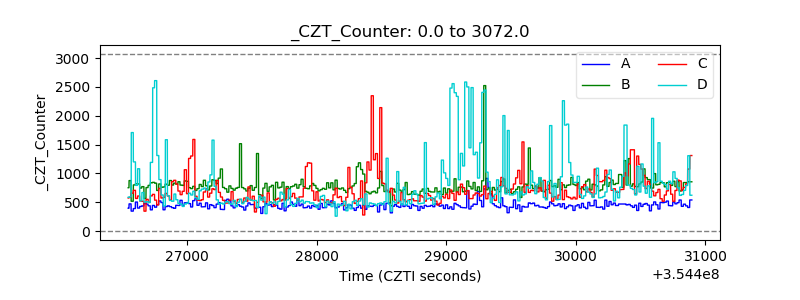 |
| +2.5 Volts monitor |  |
| +5 Volts monitor |  |
| _ROLL_ROT | 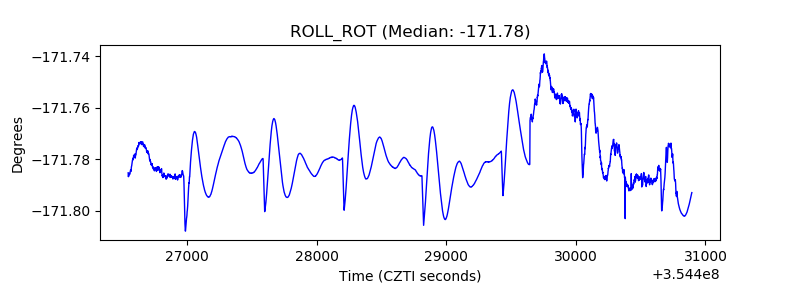 |
| _Roll_DEC | 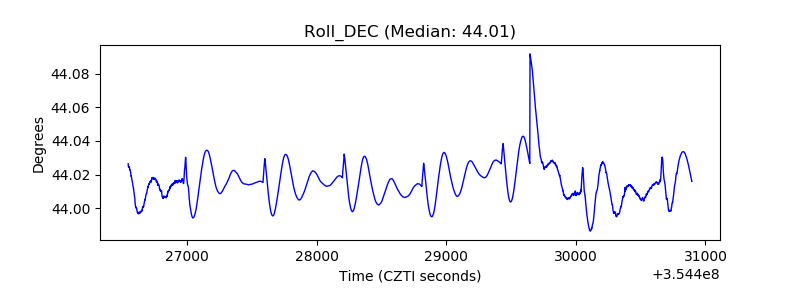 |
| _Roll_RA | 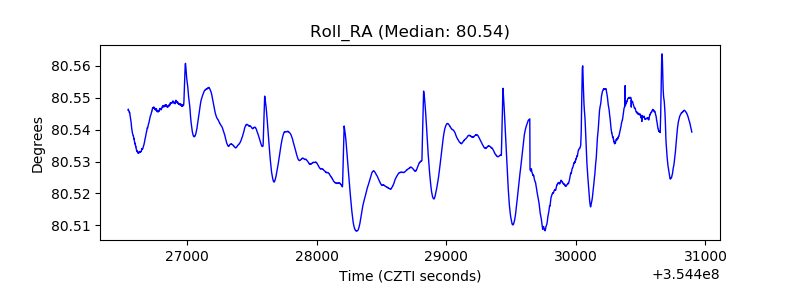 |
| Veto Counter |  |