| Param | Original file | Final file |
|---|---|---|
| Filename | modeM0/AS1A10_007T01_9000004276_29693cztM0_level2.evt | modeM0/AS1A10_007T01_9000004276_29693cztM0_level2_quad_clean.evt |
| Size (bytes) | 12,528,000 | 3,326,400 |
| Size | 11.9 MB | 3.2 MB |
| Events in quadrant A | 84,511 | 18,969 |
| Events in quadrant B | 100,152 | 16,314 |
| Events in quadrant C | 89,661 | 22,632 |
| Events in quadrant D | 90,042 | 22,168 |
| Mode SS | |||
|---|---|---|---|
| Quadrant | BADHDUFLAG | Total packets | Discarded packets |
| A | 0 | 22 | 16 |
| B | 0 | 22 | 18 |
| C | 0 | 22 | 18 |
| D | 0 | 22 | 18 |
| Mode M0 | |||
|---|---|---|---|
| Quadrant | BADHDUFLAG | Total packets | Discarded packets |
| A | 0 | 2433 | 2082 |
| B | 0 | 3252 | 2861 |
| C | 0 | 2387 | 2021 |
| D | 0 | 2661 | 2287 |
| Quadrant | Total seconds | Saturated seconds | Saturation percentage |
|---|---|---|---|
| A | 153 | 5 | 3.267974% |
| B | 130 | 2 | 1.538462% |
| C | 180 | 5 | 2.777778% |
| D | 180 | 1 | 0.555556% |
Noise dominated data is calculated using 1-second bins in cleaned event files. If a bin has >2000 counts, and if more than 50% of those come from <1% of pixels, then it is considered to be noise-dominated and hence unusable.
| Quadrant | # 1 sec bins | Bins with >0 counts | Bins with >2000 counts | High rate bins dominated by noise | Noise dominated (total time) | Noise dominated (detector-on time) | Marked lightcurve |
|---|---|---|---|---|---|---|---|
| A | 847 | 241 | 1 | 1 | 0.12% | 0.41% | 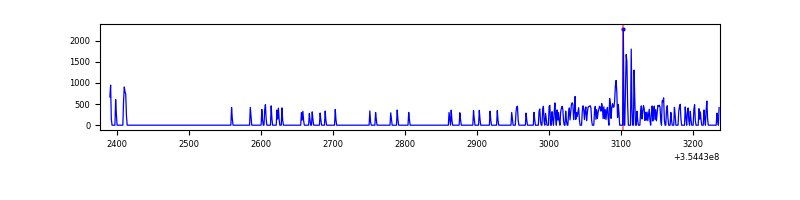 |
| B | 840 | 203 | 0 | 0 | 0.00% | 0.00% | 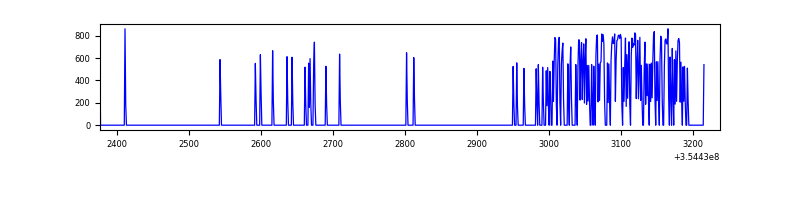 |
| C | 835 | 274 | 0 | 0 | 0.00% | 0.00% | 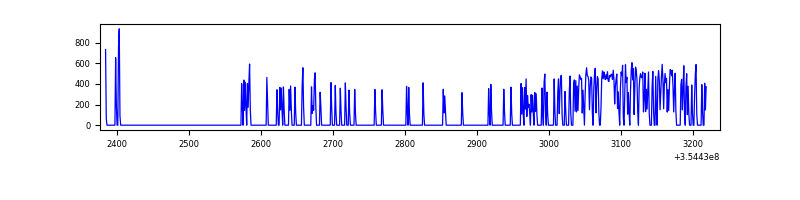 |
| D | 806 | 271 | 0 | 0 | 0.00% | 0.00% | 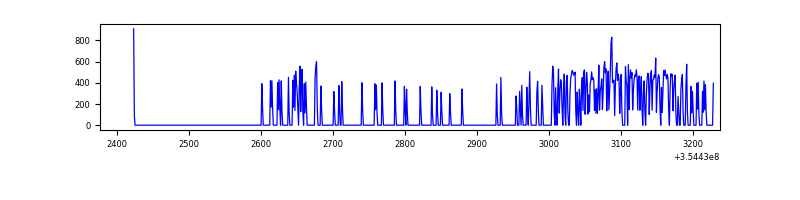 |
Top three noisy pixels from each quadrant. If the there are fewer than three noisy pixels in the level2.evt file, extra rows are filled as -1
| Pixel properties | Quadrant properties | ||||||
|---|---|---|---|---|---|---|---|
| Quadrant | DetID | PixID | Counts | Sigma | Mean | Median | Sigma |
| A | 0 | 13 | 15140 | 2653.23 | 17 | 17 | 5.7 |
| A | 13 | 254 | 317 | 52.63 | 17 | 17 | 5.7 |
| A | 3 | 137 | 172 | 27.19 | 17 | 17 | 5.7 |
| B | 6 | 159 | 41001 | 8483.01 | 14 | 14 | 4.8 |
| B | 12 | 111 | 380 | 75.75 | 14 | 14 | 4.8 |
| B | 0 | 229 | 371 | 73.89 | 14 | 14 | 4.8 |
| C | 14 | 238 | 3651 | 539.23 | 20 | 20 | 6.7 |
| C | 3 | 233 | 3132 | 462.16 | 20 | 20 | 6.7 |
| C | 14 | 254 | 624 | 89.7 | 20 | 20 | 6.7 |
| D | 8 | 195 | 7782 | 1160.05 | 20 | 19 | 6.7 |
| D | 13 | 104 | 1891 | 279.74 | 20 | 19 | 6.7 |
| D | 2 | 250 | 1635 | 241.48 | 20 | 19 | 6.7 |
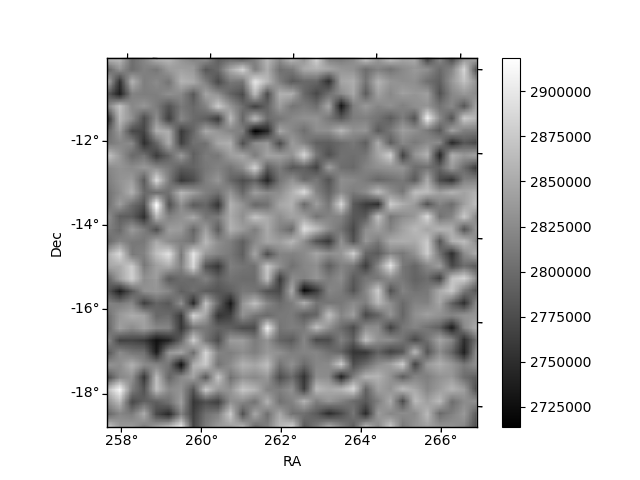
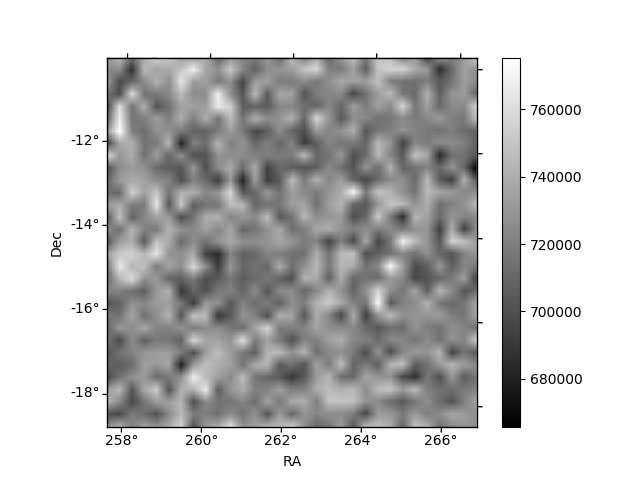
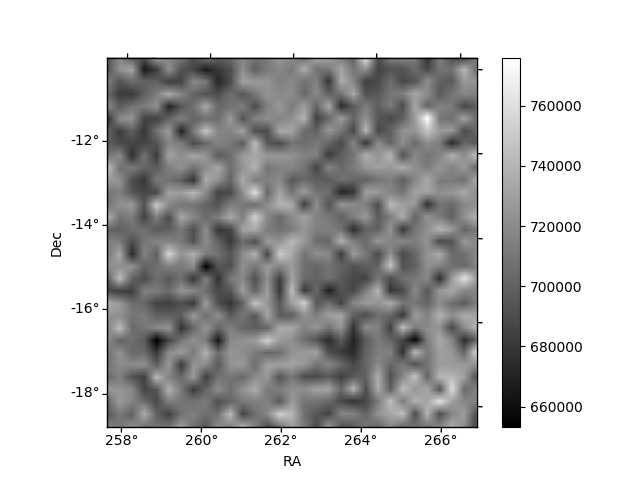
Histogram calculated using DETX and DETY for each event in the final _common_clean file
| Quadrant A | 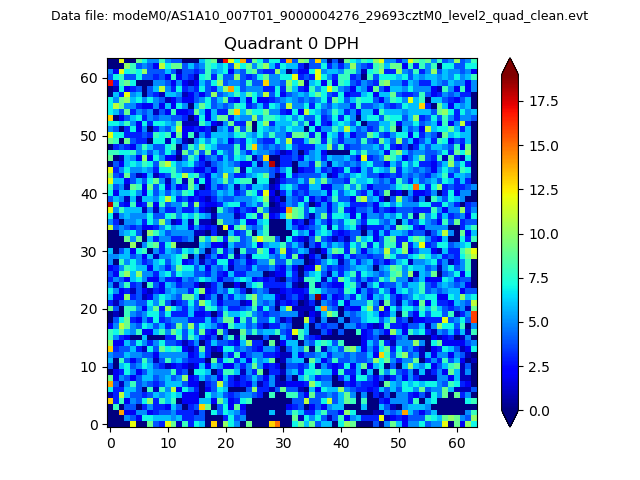 |
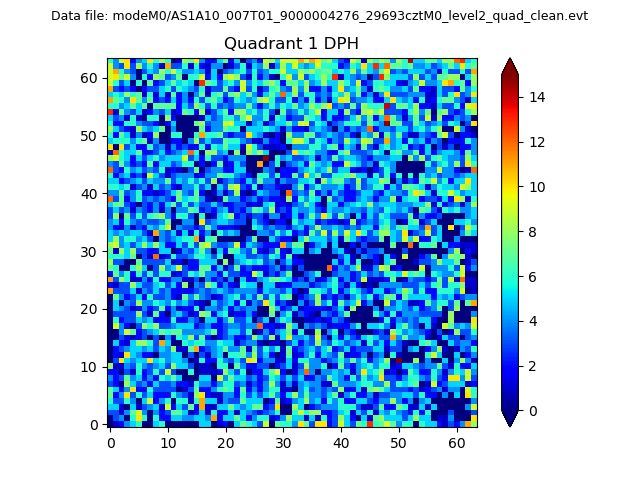 |
Quadrant B |
|---|---|---|---|
| Quadrant D | 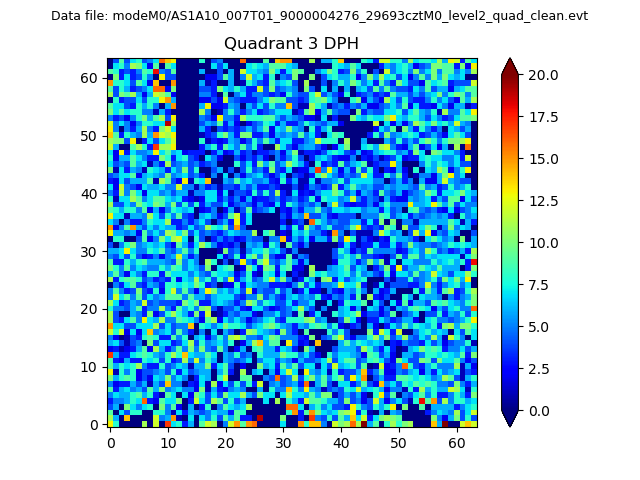 |
 |
Quadrant C |
| Plot type | Count rate plots | Images |
|---|---|---|
| Comparison with Poisson distribution Blue bars denote a histogram of data divided into 1 sec bins. Red curve is a Poisson curve with rate = median count rate of data. |
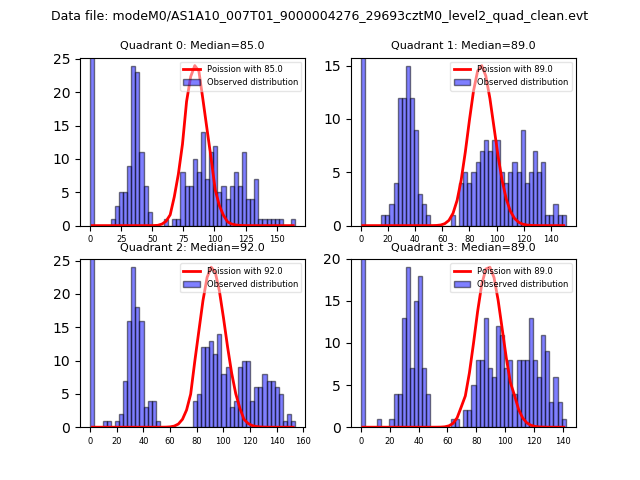 |
 |
| Quadrant-wise count rates Data is divided into 100 sec bins |
 |
|
| Module-wise count rates for Quadrant A Data is divided into 100 sec bins |
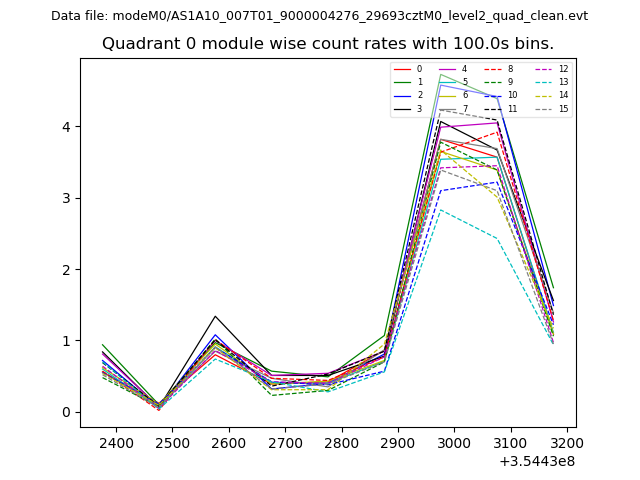 |
 |
| Module-wise count rates for Quadrant B Data is divided into 100 sec bins |
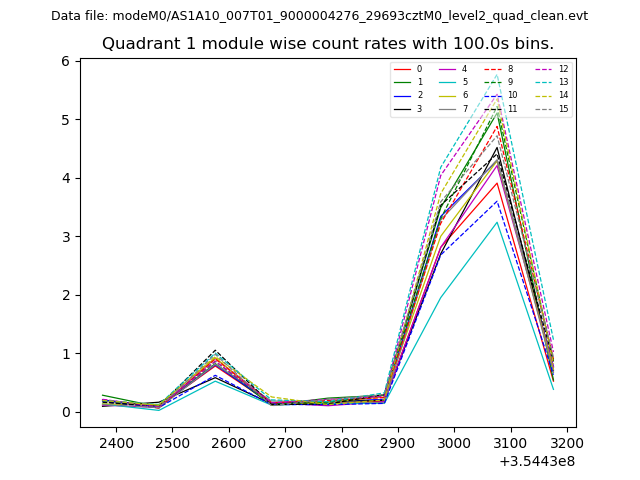 |
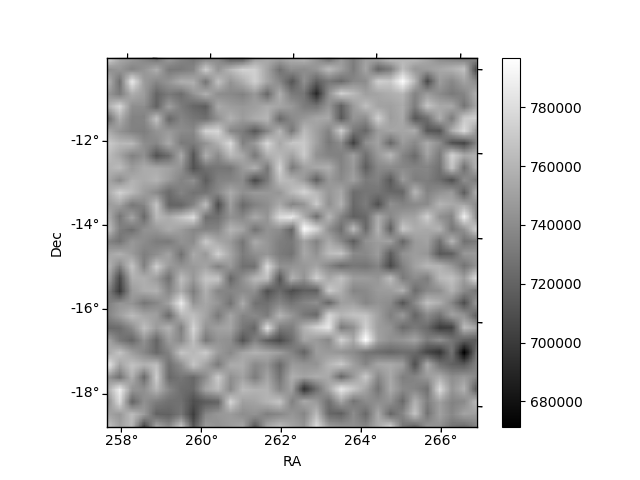 |
| Module-wise count rates for Quadrant C Data is divided into 100 sec bins |
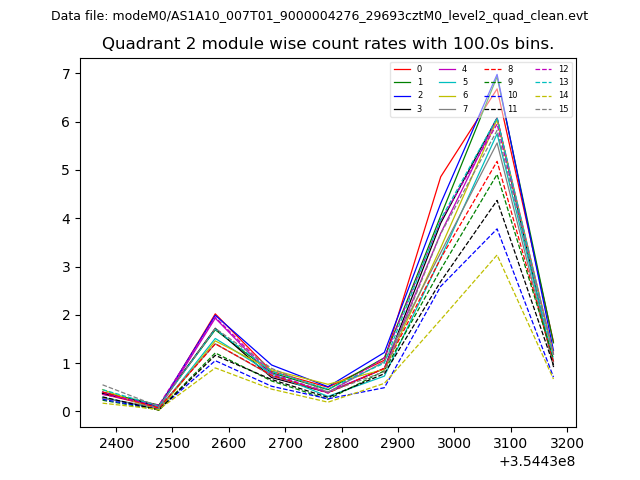 |
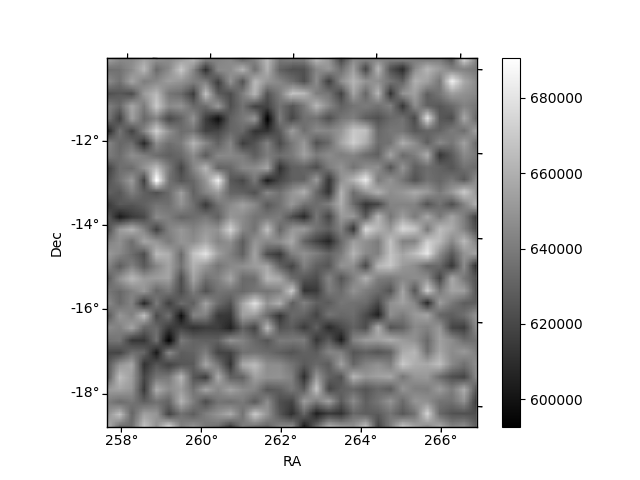 |
| Module-wise count rates for Quadrant D Data is divided into 100 sec bins |
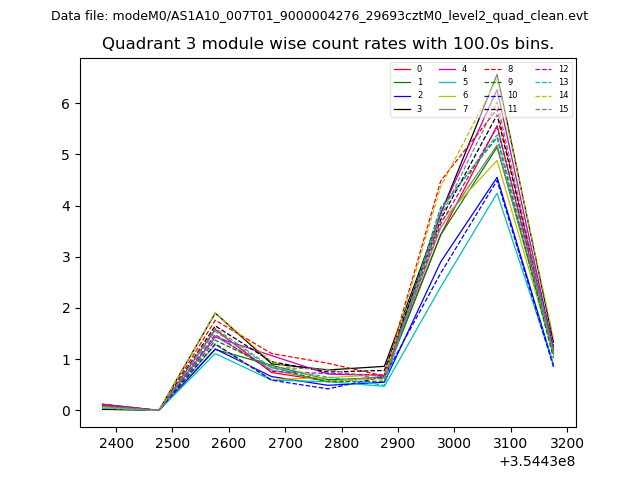 |
 |
| Parameter | Plot |
|---|---|
| CZT HV Monitor | 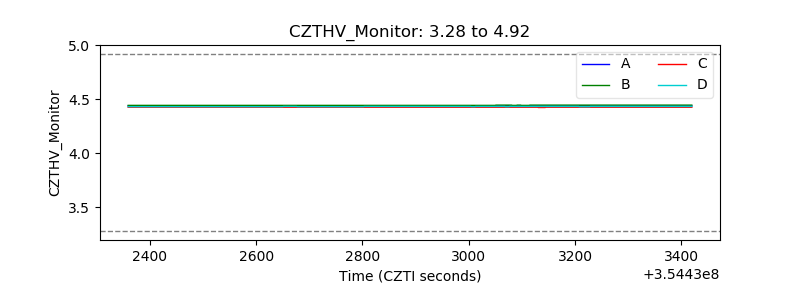 |
| D_VDD | 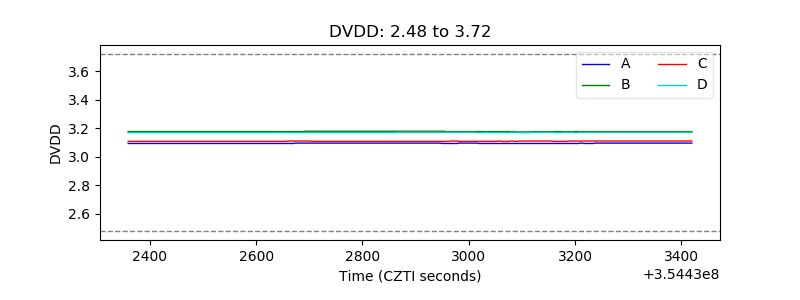 |
| Temperature 1 | 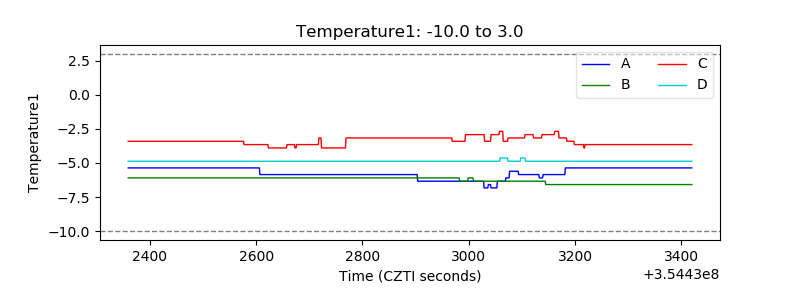 |
| Veto HV Monitor | 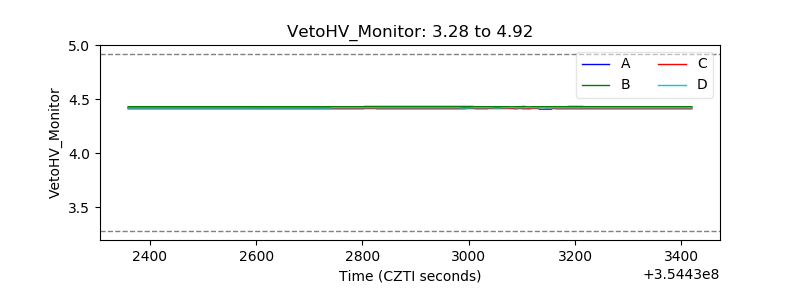 |
| Veto LLD | 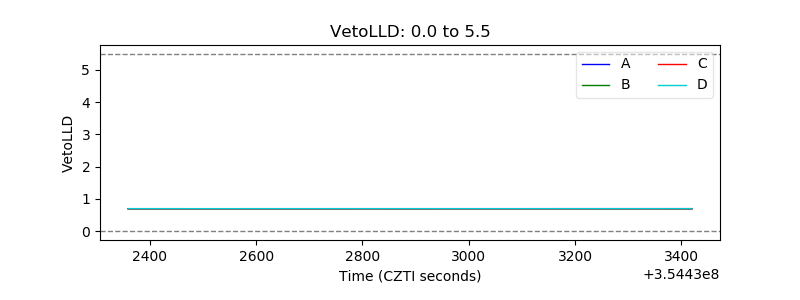 |
| Alpha Counter | 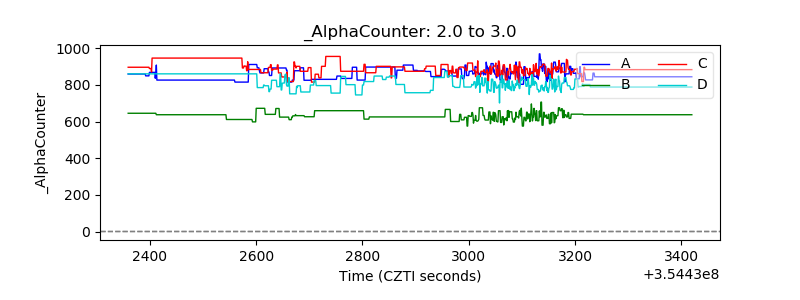 |
| _CPM_Rate | 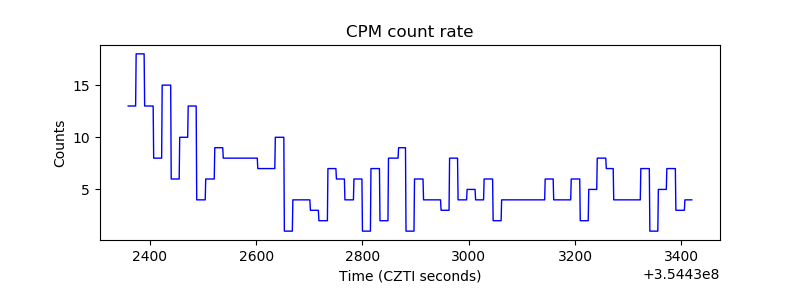 |
| CZT Counter |  |
| +2.5 Volts monitor |  |
| +5 Volts monitor |  |
| _ROLL_ROT | 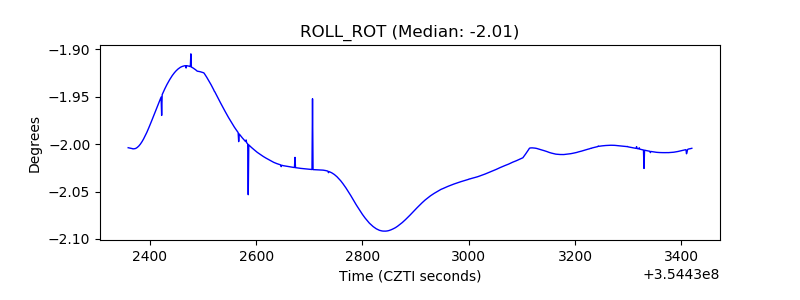 |
| _Roll_DEC | 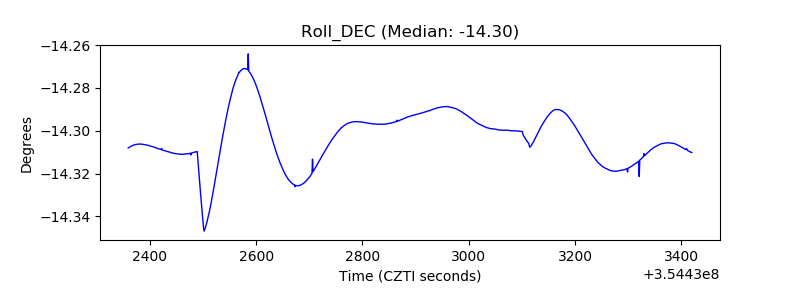 |
| _Roll_RA | 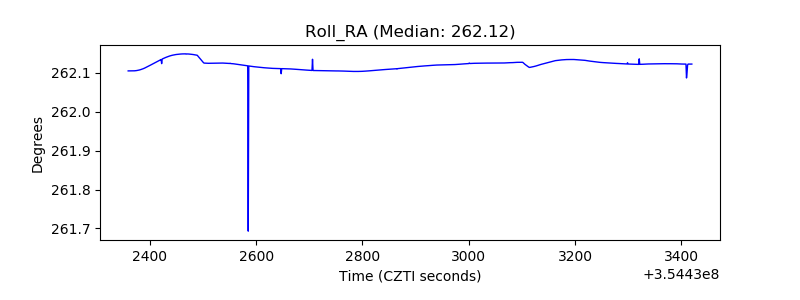 |
| Veto Counter | 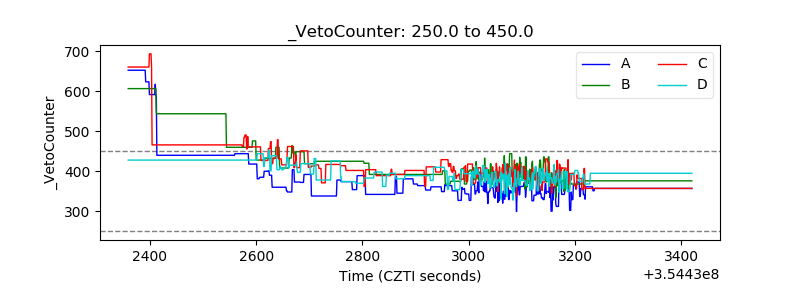 |