| Param | Original file | Final file |
|---|---|---|
| Filename | modeM0/AS1A10_007T01_9000004276_29697cztM0_level2.evt | modeM0/AS1A10_007T01_9000004276_29697cztM0_level2_quad_clean.evt |
| Size (bytes) | 1,423,713,600 | 184,089,600 |
| Size | 1.3 GB | 175.6 MB |
| Events in quadrant A | 7,778,405 | 1,127,509 |
| Events in quadrant B | 13,120,004 | 1,134,012 |
| Events in quadrant C | 8,331,438 | 1,119,313 |
| Events in quadrant D | 12,795,153 | 1,075,766 |
| Mode SS | |||
|---|---|---|---|
| Quadrant | BADHDUFLAG | Total packets | Discarded packets |
| A | 0 | 328 | 0 |
| B | 0 | 328 | 0 |
| C | 0 | 328 | 0 |
| D | 0 | 328 | 0 |
| Mode M0 | |||
|---|---|---|---|
| Quadrant | BADHDUFLAG | Total packets | Discarded packets |
| A | 0 | 33511 | 3 |
| B | 0 | 50402 | 3 |
| C | 0 | 34381 | 3 |
| D | 0 | 48950 | 3 |
| Mode M9 | |||
|---|---|---|---|
| Quadrant | BADHDUFLAG | Total packets | Discarded packets |
| A | 0 | 21 | 0 |
| B | 0 | 21 | 0 |
| C | 0 | 21 | 0 |
| D | 0 | 21 | 0 |
| Quadrant | Total seconds | Saturated seconds | Saturation percentage |
|---|---|---|---|
| A | 16220 | 234 | 1.442663% |
| B | 16220 | 444 | 2.737361% |
| C | 16220 | 315 | 1.942047% |
| D | 16221 | 1074 | 6.621047% |
Noise dominated data is calculated using 1-second bins in cleaned event files. If a bin has >2000 counts, and if more than 50% of those come from <1% of pixels, then it is considered to be noise-dominated and hence unusable.
| Quadrant | # 1 sec bins | Bins with >0 counts | Bins with >2000 counts | High rate bins dominated by noise | Noise dominated (total time) | Noise dominated (detector-on time) | Marked lightcurve |
|---|---|---|---|---|---|---|---|
| A | 18250 | 16220 | 16 | 16 | 0.09% | 0.10% | 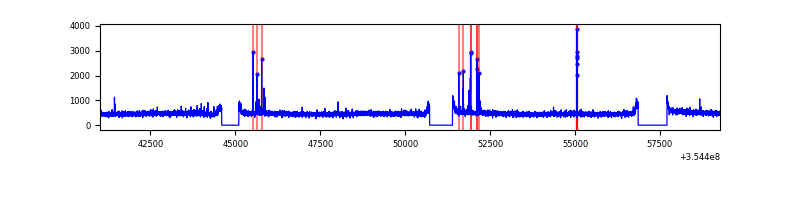 |
| B | 18250 | 16220 | 76 | 76 | 0.42% | 0.47% | 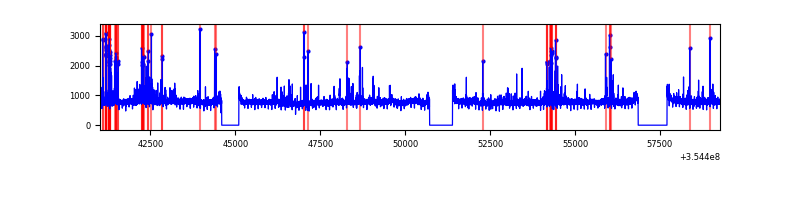 |
| C | 18250 | 16220 | 11 | 11 | 0.06% | 0.07% | 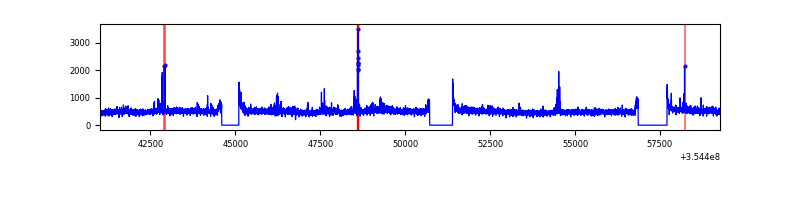 |
| D | 18251 | 16221 | 817 | 817 | 4.48% | 5.04% | 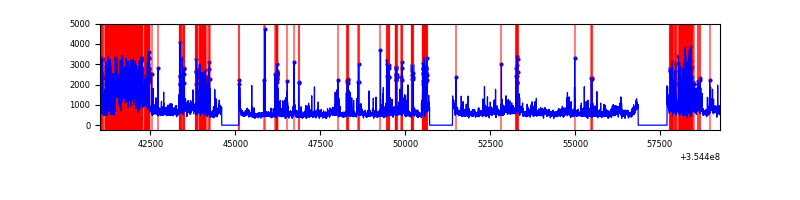 |
Top three noisy pixels from each quadrant. If the there are fewer than three noisy pixels in the level2.evt file, extra rows are filled as -1
| Pixel properties | Quadrant properties | ||||||
|---|---|---|---|---|---|---|---|
| Quadrant | DetID | PixID | Counts | Sigma | Mean | Median | Sigma |
| A | 0 | 13 | 89113 | 217.86 | 1977 | 1929 | 400.2 |
| A | 12 | 96 | 55871 | 134.79 | 1977 | 1929 | 400.2 |
| A | 13 | 254 | 33489 | 78.86 | 1977 | 1929 | 400.2 |
| B | 6 | 159 | 4683559 | 12416.82 | 1952 | 1900 | 377.0 |
| B | 0 | 229 | 520997 | 1376.76 | 1952 | 1900 | 377.0 |
| B | 0 | 190 | 92488 | 240.26 | 1952 | 1900 | 377.0 |
| C | 3 | 233 | 382082 | 847.55 | 1912 | 1927 | 448.5 |
| C | 14 | 238 | 315813 | 699.8 | 1912 | 1927 | 448.5 |
| C | 10 | 22 | 85271 | 185.81 | 1912 | 1927 | 448.5 |
| D | 7 | 80 | 2865809 | 6343.76 | 1896 | 1844 | 451.5 |
| D | 8 | 195 | 1984708 | 4392.1 | 1896 | 1844 | 451.5 |
| D | 2 | 250 | 238551 | 524.31 | 1896 | 1844 | 451.5 |
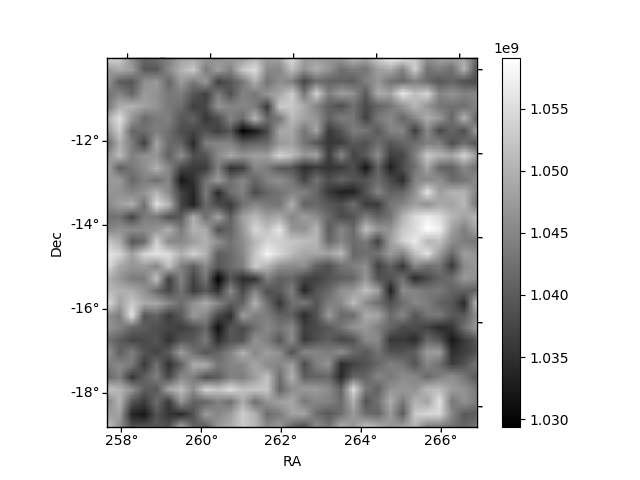
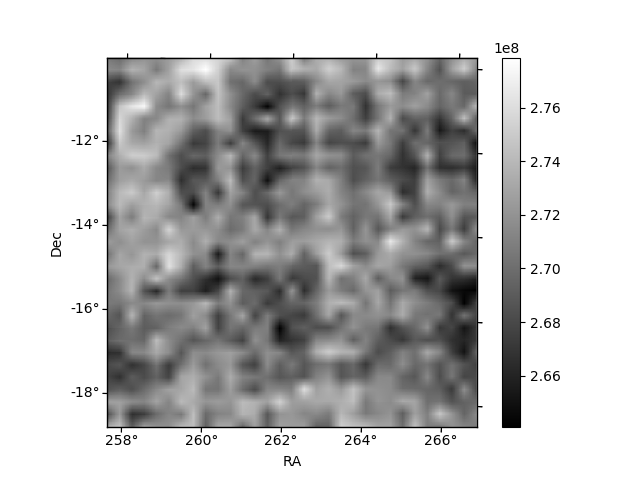
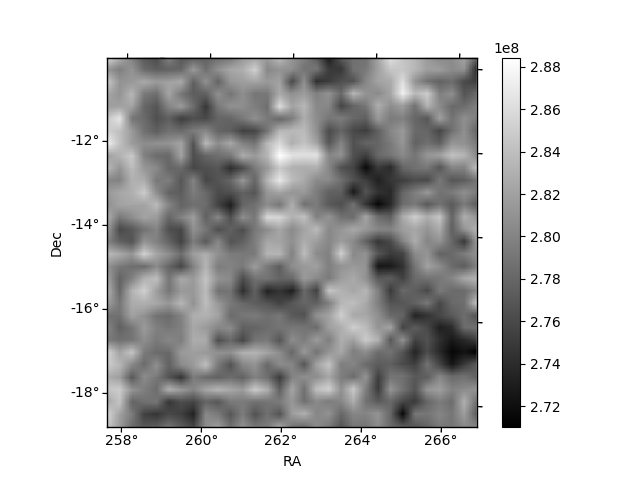
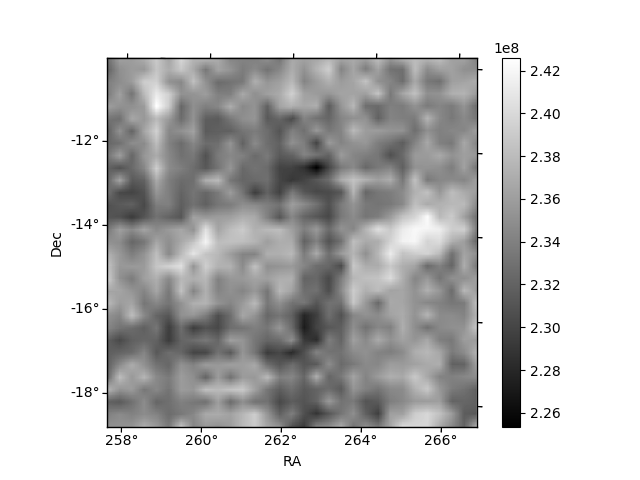
Histogram calculated using DETX and DETY for each event in the final _common_clean file
| Quadrant A |  |
 |
Quadrant B |
|---|---|---|---|
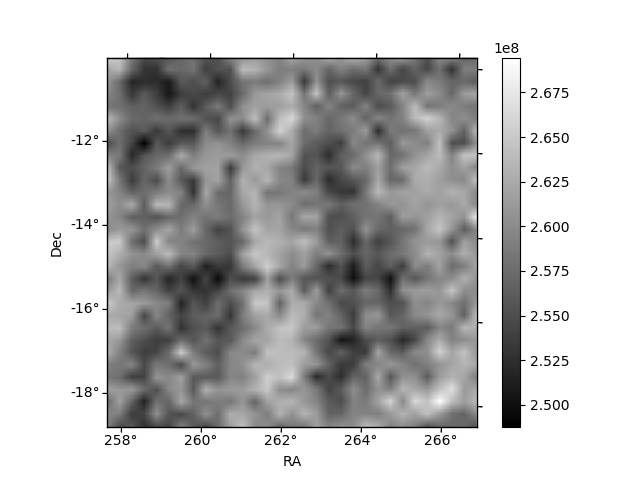
| Quadrant D |  |
 |
Quadrant C |
| Plot type | Count rate plots | Images |
|---|---|---|
| Comparison with Poisson distribution Blue bars denote a histogram of data divided into 1 sec bins. Red curve is a Poisson curve with rate = median count rate of data. |
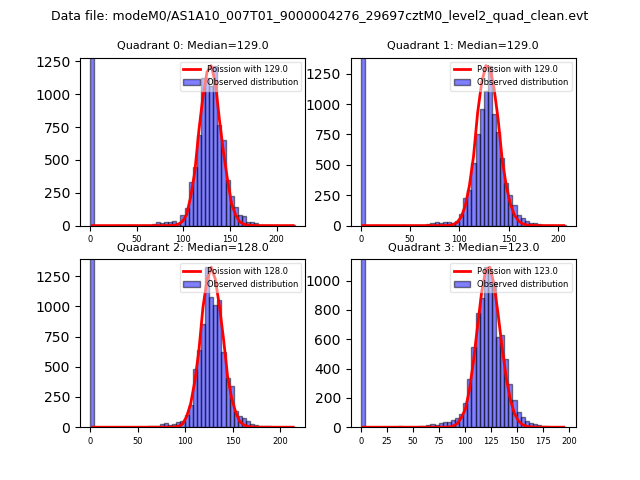 |
 |
| Quadrant-wise count rates Data is divided into 100 sec bins |
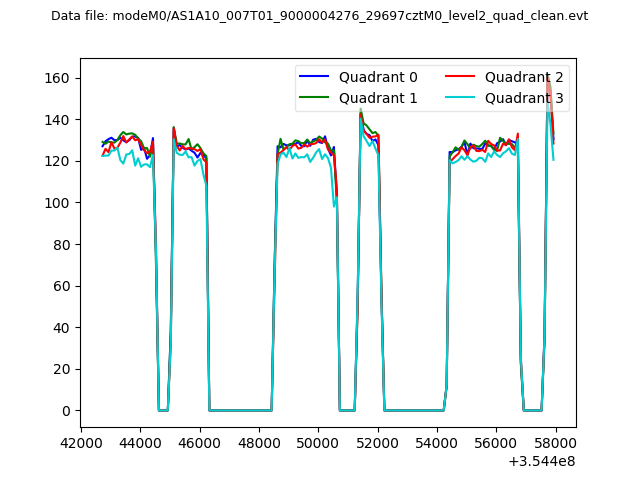 |
|
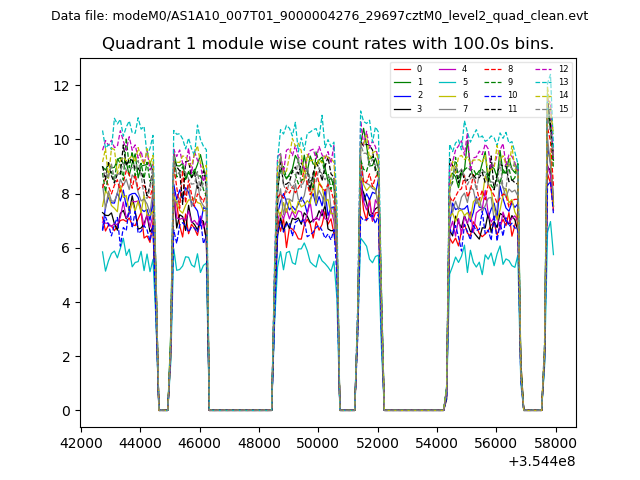
| Module-wise count rates for Quadrant A Data is divided into 100 sec bins |
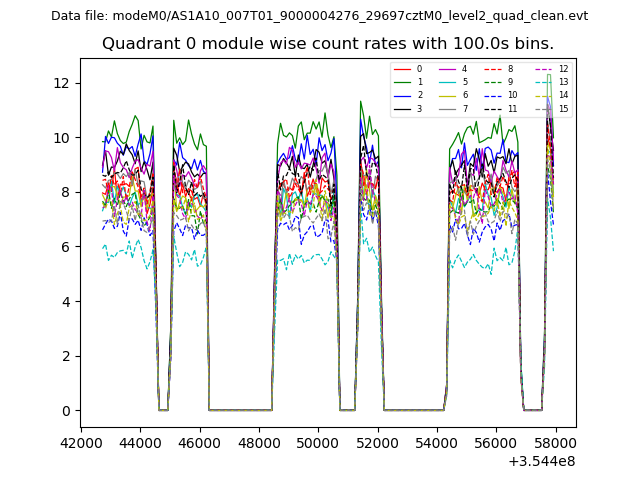 |
 |
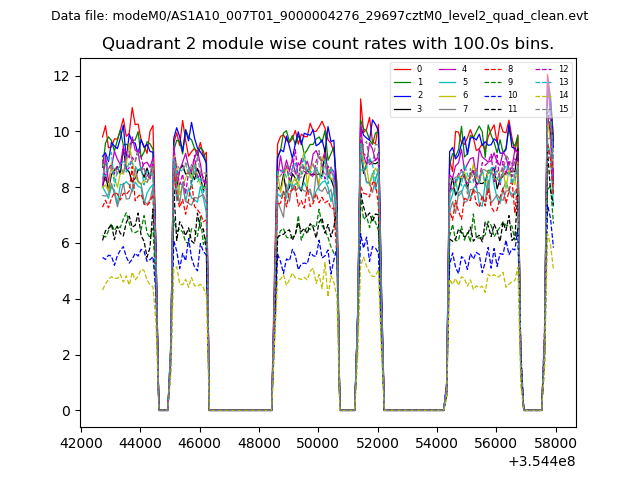
| Module-wise count rates for Quadrant B Data is divided into 100 sec bins |
 |
 |
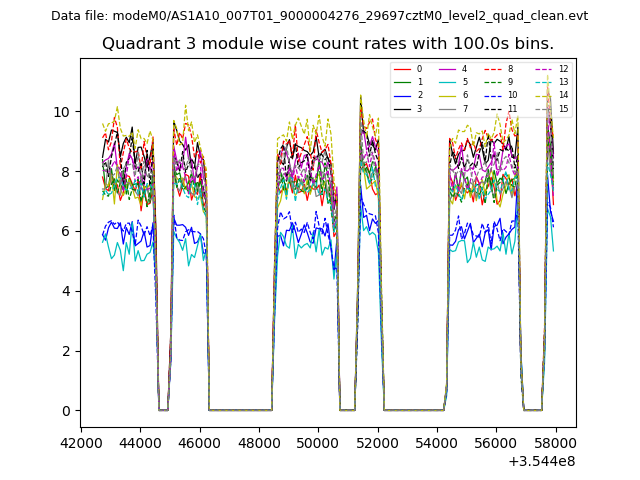
| Module-wise count rates for Quadrant C Data is divided into 100 sec bins |
 |
 |
| Module-wise count rates for Quadrant D Data is divided into 100 sec bins |
 |
 |
| Parameter | Plot |
|---|---|
| CZT HV Monitor | 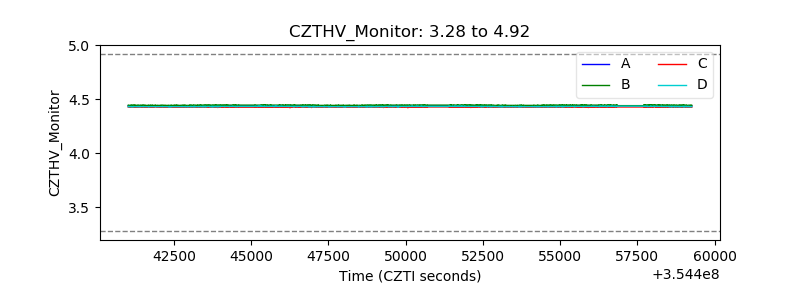 |
| D_VDD | 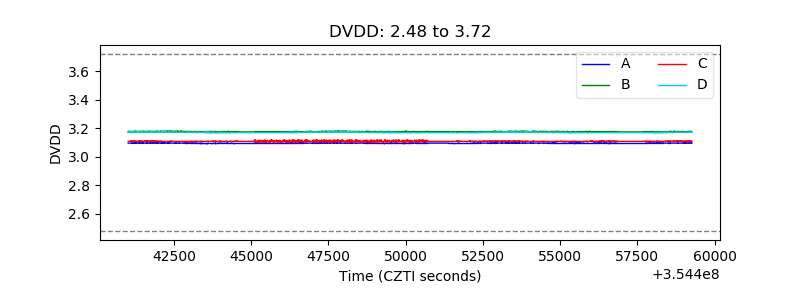 |
| Temperature 1 | 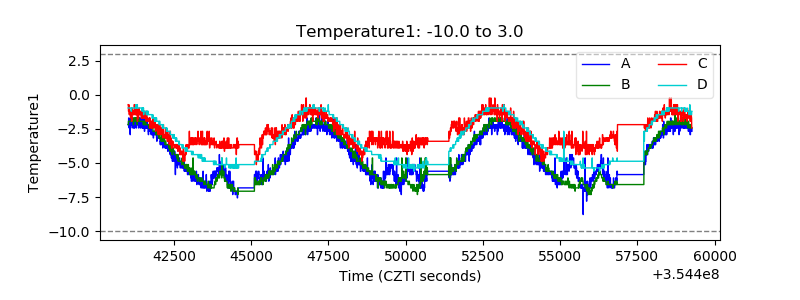 |
| Veto HV Monitor | 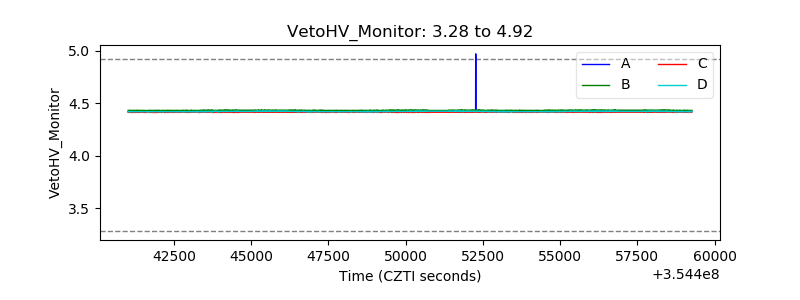 |
| Veto LLD | 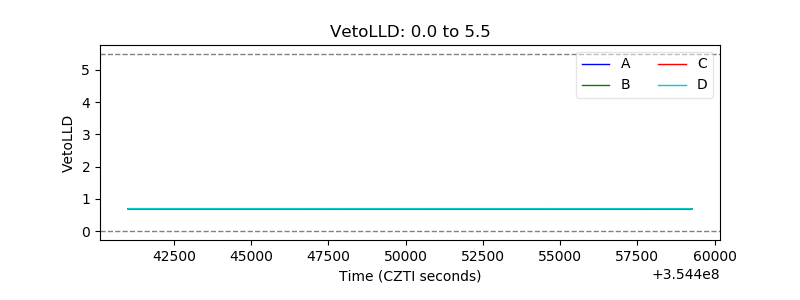 |
| Alpha Counter | 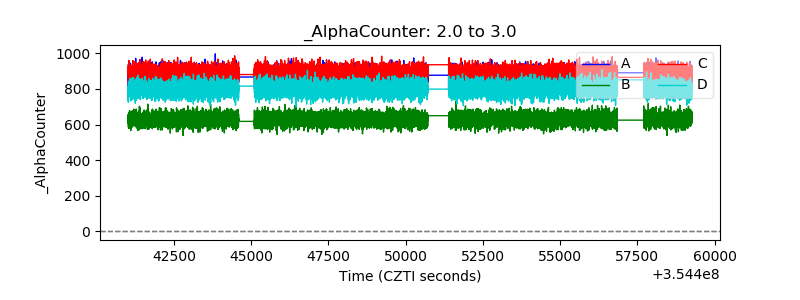 |
| _CPM_Rate | 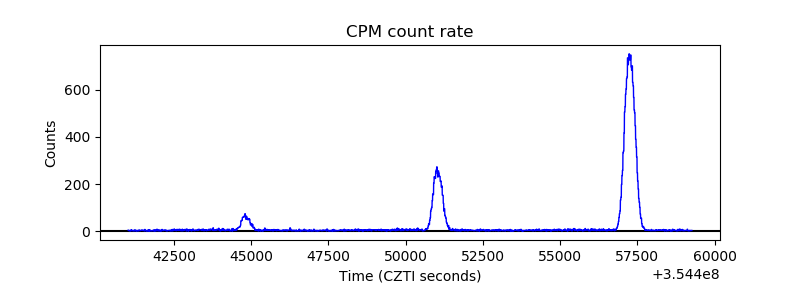 |
| CZT Counter | 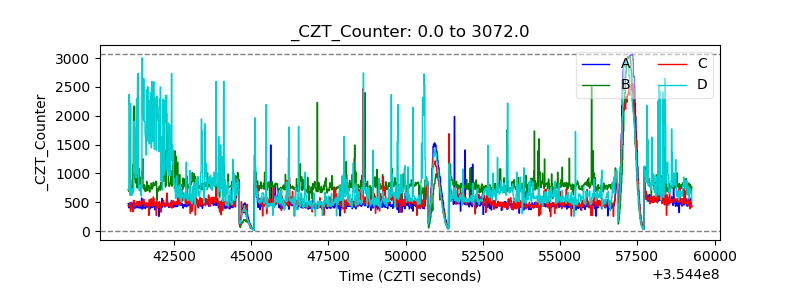 |
| +2.5 Volts monitor | 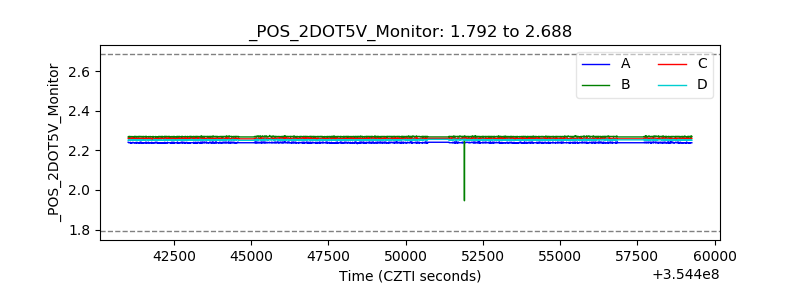 |
| +5 Volts monitor |  |
| _ROLL_ROT | 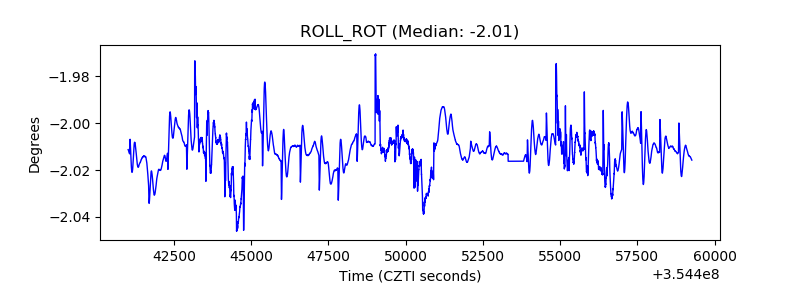 |
| _Roll_DEC | 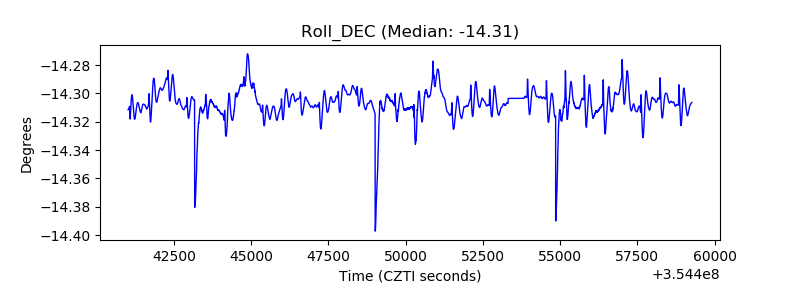 |
| _Roll_RA | 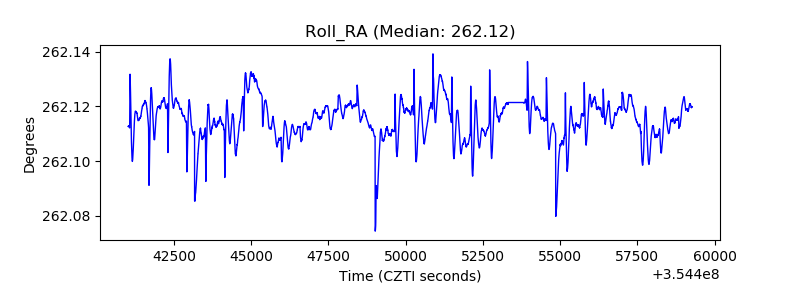 |
| Veto Counter | 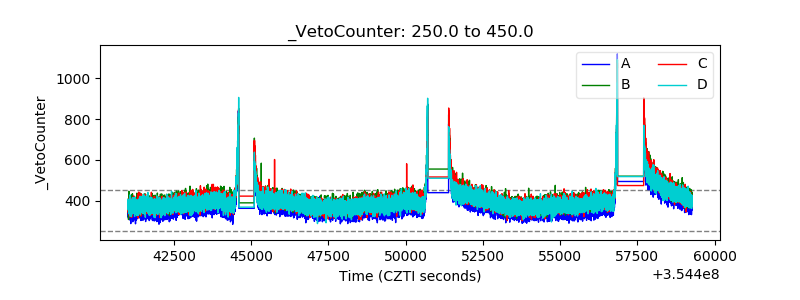 |