| Param | Original file | Final file |
|---|---|---|
| Filename | modeM0/AS1A10_007T01_9000004276_29698cztM0_level2.evt | modeM0/AS1A10_007T01_9000004276_29698cztM0_level2_quad_clean.evt |
| Size (bytes) | 632,085,120 | 65,554,560 |
| Size | 602.8 MB | 62.5 MB |
| Events in quadrant A | 3,322,852 | 388,245 |
| Events in quadrant B | 5,551,100 | 383,078 |
| Events in quadrant C | 3,516,859 | 379,709 |
| Events in quadrant D | 6,296,074 | 363,594 |
| Mode SS | |||
|---|---|---|---|
| Quadrant | BADHDUFLAG | Total packets | Discarded packets |
| A | 0 | 136 | 0 |
| B | 0 | 136 | 0 |
| C | 0 | 138 | 0 |
| D | 0 | 138 | 0 |
| Mode M0 | |||
|---|---|---|---|
| Quadrant | BADHDUFLAG | Total packets | Discarded packets |
| A | 0 | 14140 | 1 |
| B | 0 | 21008 | 1 |
| C | 0 | 14617 | 1 |
| D | 0 | 23601 | 2 |
| Mode M9 | |||
|---|---|---|---|
| Quadrant | BADHDUFLAG | Total packets | Discarded packets |
| A | 0 | 10 | 0 |
| B | 0 | 10 | 0 |
| C | 0 | 10 | 0 |
| D | 0 | 10 | 0 |
| Quadrant | Total seconds | Saturated seconds | Saturation percentage |
|---|---|---|---|
| A | 6743 | 54 | 0.800830% |
| B | 6743 | 172 | 2.550793% |
| C | 6743 | 159 | 2.358001% |
| D | 6744 | 584 | 8.659549% |
Noise dominated data is calculated using 1-second bins in cleaned event files. If a bin has >2000 counts, and if more than 50% of those come from <1% of pixels, then it is considered to be noise-dominated and hence unusable.
| Quadrant | # 1 sec bins | Bins with >0 counts | Bins with >2000 counts | High rate bins dominated by noise | Noise dominated (total time) | Noise dominated (detector-on time) | Marked lightcurve |
|---|---|---|---|---|---|---|---|
| A | 7763 | 6743 | 0 | 0 | 0.00% | 0.00% | 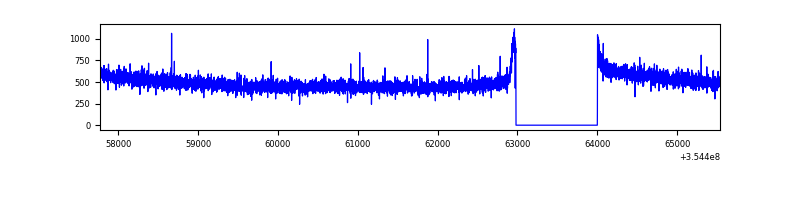 |
| B | 7763 | 6743 | 55 | 55 | 0.71% | 0.82% | 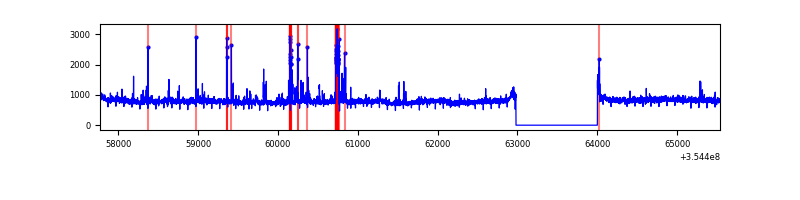 |
| C | 7763 | 6743 | 6 | 6 | 0.08% | 0.09% | 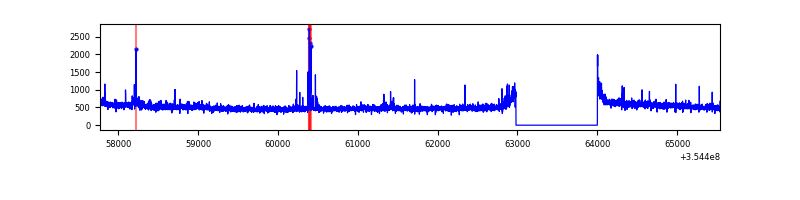 |
| D | 7764 | 6744 | 432 | 432 | 5.56% | 6.41% |  |
Top three noisy pixels from each quadrant. If the there are fewer than three noisy pixels in the level2.evt file, extra rows are filled as -1
| Pixel properties | Quadrant properties | ||||||
|---|---|---|---|---|---|---|---|
| Quadrant | DetID | PixID | Counts | Sigma | Mean | Median | Sigma |
| A | 13 | 254 | 13402 | 72.12 | 861 | 845 | 174.1 |
| A | 3 | 137 | 8449 | 43.67 | 861 | 845 | 174.1 |
| A | 0 | 226 | 7254 | 36.81 | 861 | 845 | 174.1 |
| B | 6 | 159 | 1934541 | 11992.29 | 844 | 824 | 161.2 |
| B | 0 | 229 | 177461 | 1095.45 | 844 | 824 | 161.2 |
| B | 10 | 245 | 58657 | 358.66 | 844 | 824 | 161.2 |
| C | 14 | 238 | 152074 | 786.6 | 824 | 831 | 192.3 |
| C | 3 | 233 | 42216 | 215.24 | 824 | 831 | 192.3 |
| C | 10 | 22 | 41697 | 212.54 | 824 | 831 | 192.3 |
| D | 7 | 80 | 1343148 | 6873.76 | 816 | 794 | 195.3 |
| D | 8 | 195 | 951588 | 4868.71 | 816 | 794 | 195.3 |
| D | 7 | 238 | 724457 | 3705.65 | 816 | 794 | 195.3 |
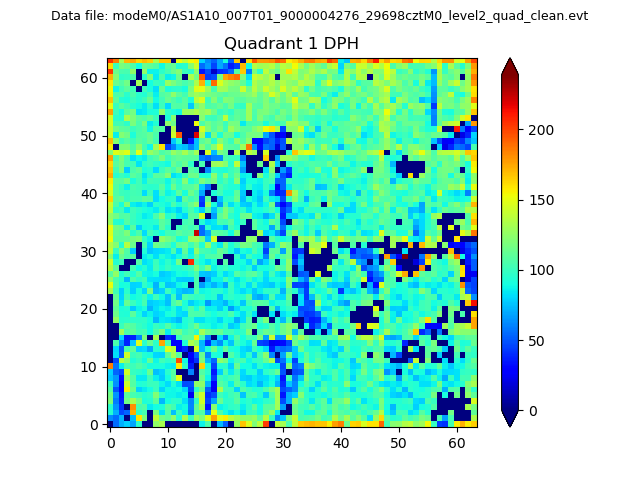
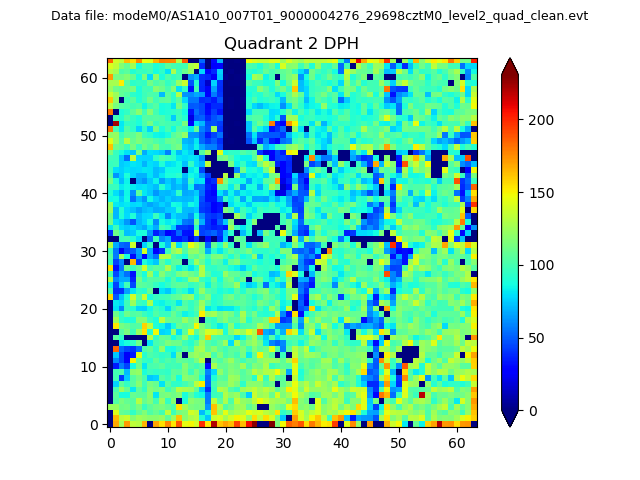
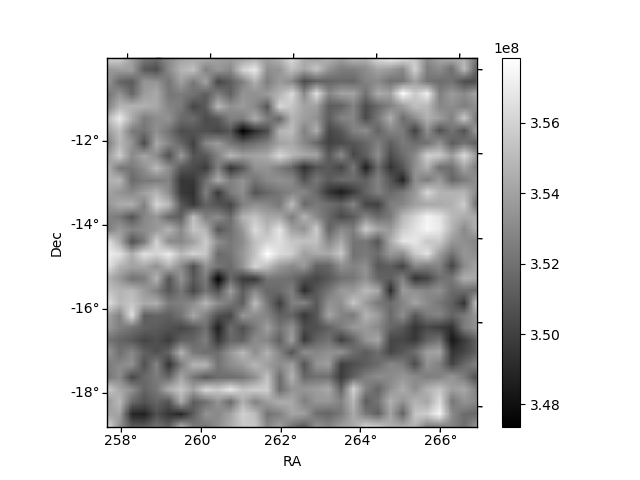
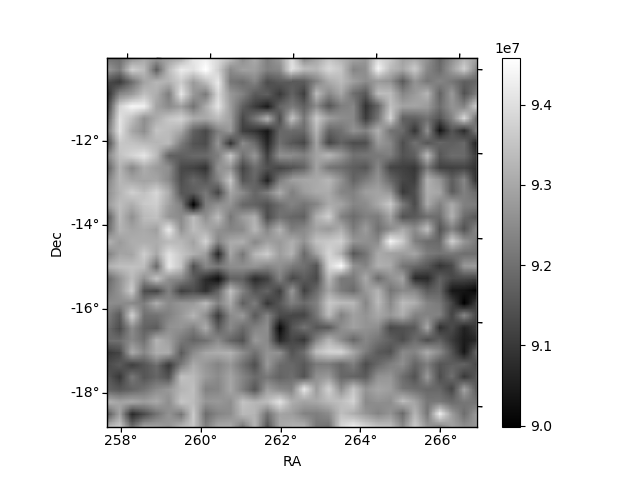
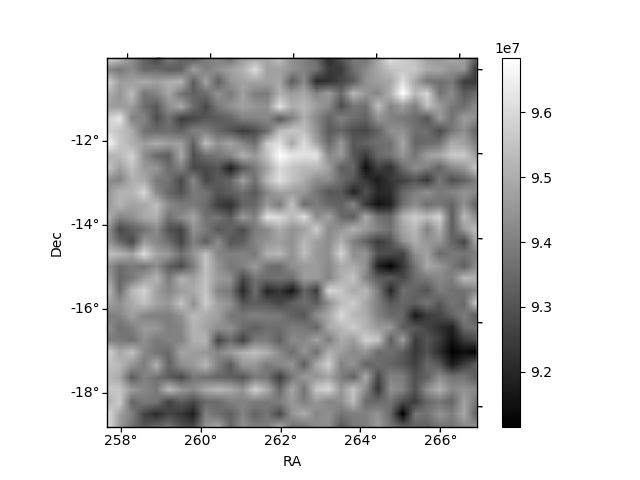
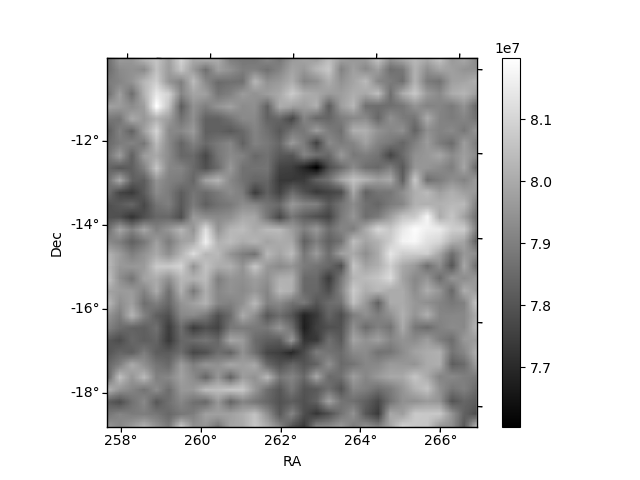
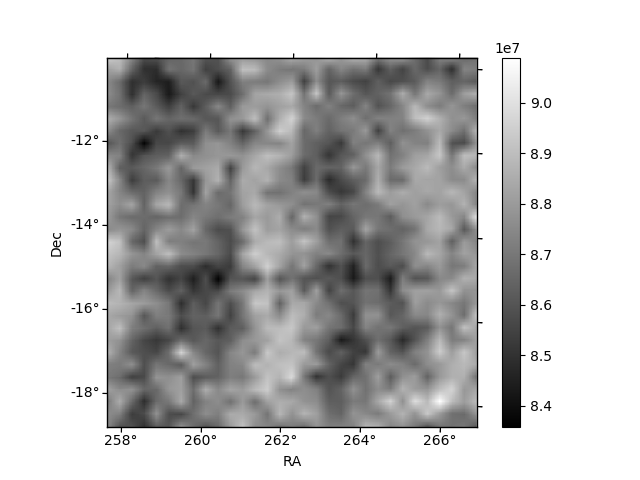
Histogram calculated using DETX and DETY for each event in the final _common_clean file
| Quadrant A | 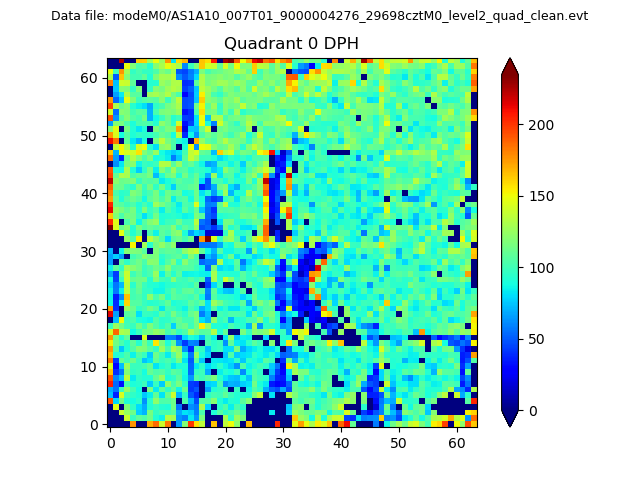 |
 |
Quadrant B |
|---|---|---|---|
| Quadrant D | 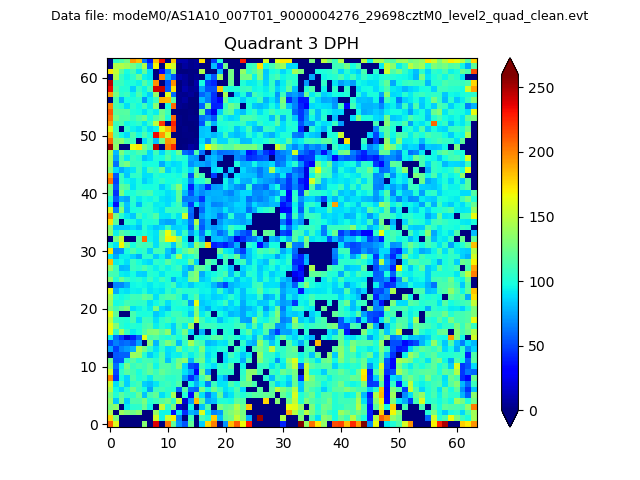 |
 |
Quadrant C |
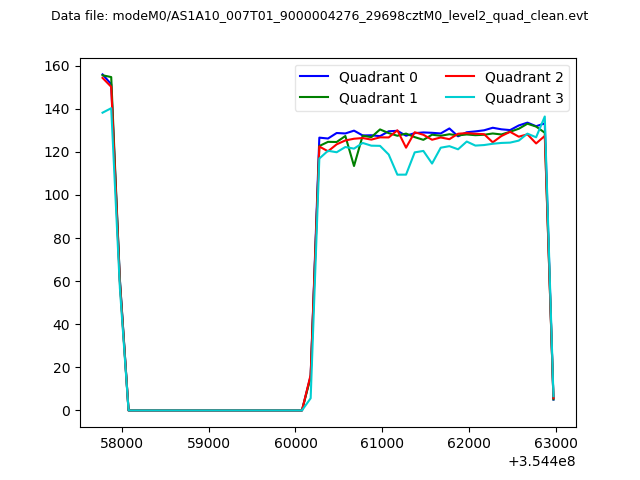
| Plot type | Count rate plots | Images |
|---|---|---|
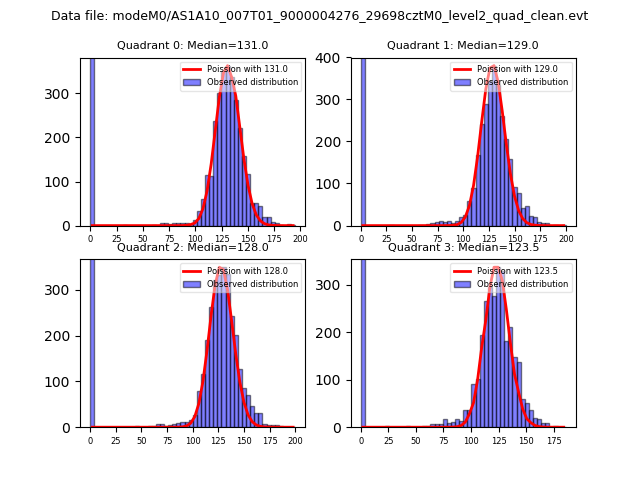
| Comparison with Poisson distribution Blue bars denote a histogram of data divided into 1 sec bins. Red curve is a Poisson curve with rate = median count rate of data. |
 |
 |
| Quadrant-wise count rates Data is divided into 100 sec bins |
 |
|
| Module-wise count rates for Quadrant A Data is divided into 100 sec bins |
 |
 |
| Module-wise count rates for Quadrant B Data is divided into 100 sec bins |
 |
 |
| Module-wise count rates for Quadrant C Data is divided into 100 sec bins |
 |
 |
| Module-wise count rates for Quadrant D Data is divided into 100 sec bins |
 |
 |
| Parameter | Plot |
|---|---|
| CZT HV Monitor |  |
| D_VDD | 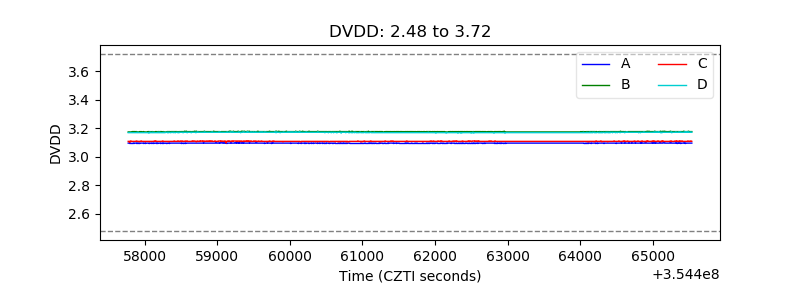 |
| Temperature 1 | 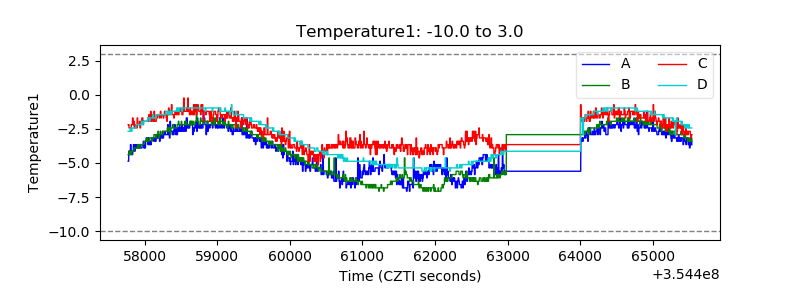 |
| Veto HV Monitor | 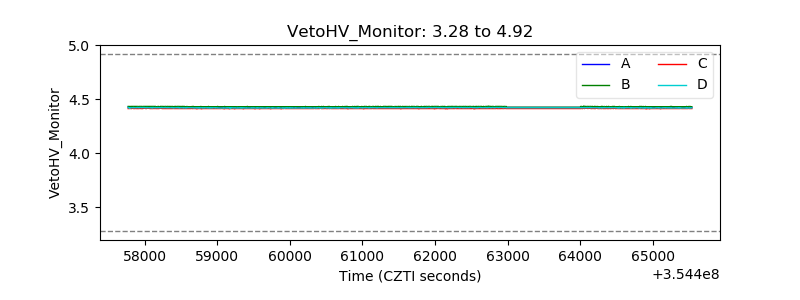 |
| Veto LLD | 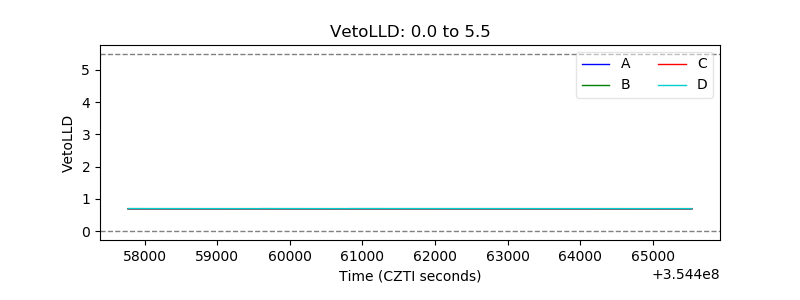 |
| Alpha Counter | 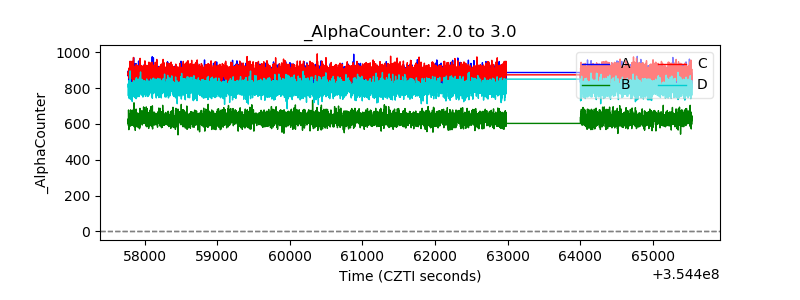 |
| _CPM_Rate | 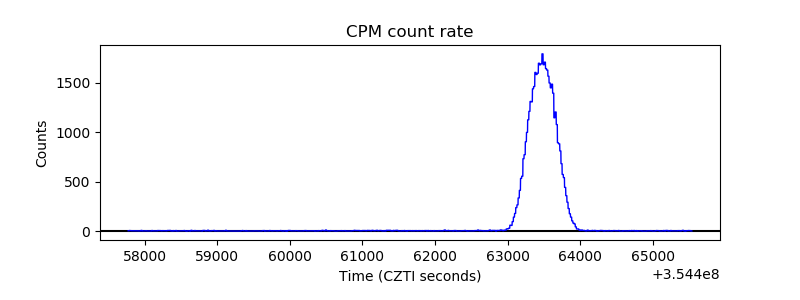 |
| CZT Counter | 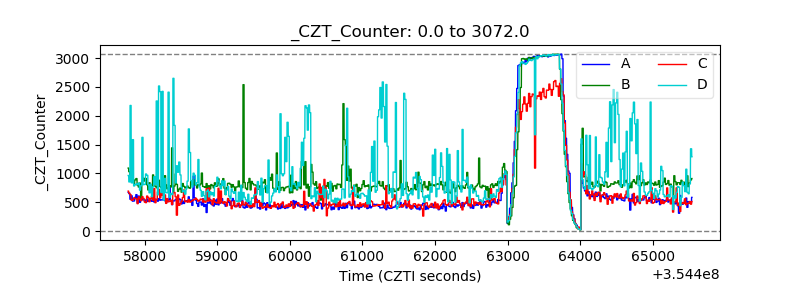 |
| +2.5 Volts monitor | 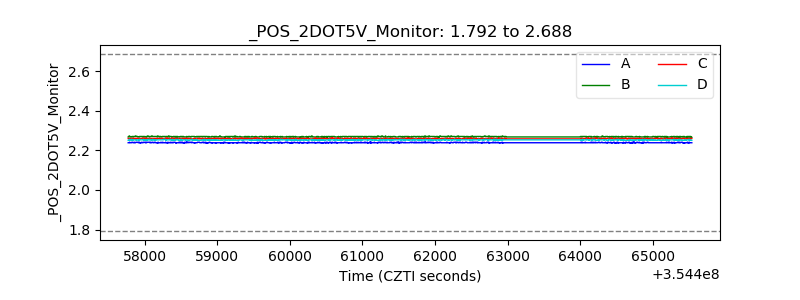 |
| +5 Volts monitor |  |
| _ROLL_ROT |  |
| _Roll_DEC | 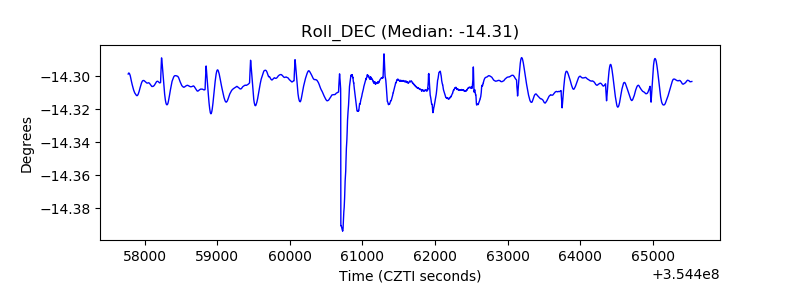 |
| _Roll_RA | 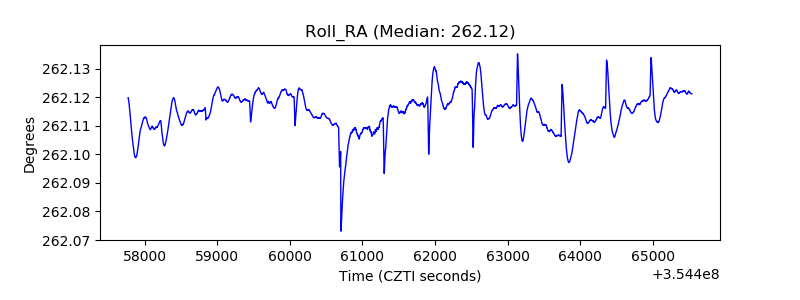 |
| Veto Counter |  |