| Param | Original file | Final file |
|---|---|---|
| Filename | modeM0/AS1A10_007T01_9000004276_29701cztM0_level2.evt | modeM0/AS1A10_007T01_9000004276_29701cztM0_level2_quad_clean.evt |
| Size (bytes) | 563,783,040 | 74,021,760 |
| Size | 537.7 MB | 70.6 MB |
| Events in quadrant A | 3,040,515 | 470,569 |
| Events in quadrant B | 5,074,473 | 468,517 |
| Events in quadrant C | 3,889,949 | 458,815 |
| Events in quadrant D | 4,679,585 | 440,596 |
| Mode SS | |||
|---|---|---|---|
| Quadrant | BADHDUFLAG | Total packets | Discarded packets |
| A | 0 | 118 | 0 |
| B | 0 | 118 | 0 |
| C | 0 | 118 | 0 |
| D | 0 | 118 | 0 |
| Mode M0 | |||
|---|---|---|---|
| Quadrant | BADHDUFLAG | Total packets | Discarded packets |
| A | 0 | 12707 | 1 |
| B | 0 | 18920 | 1 |
| C | 0 | 15350 | 1 |
| D | 0 | 18292 | 1 |
| Mode M9 | |||
|---|---|---|---|
| Quadrant | BADHDUFLAG | Total packets | Discarded packets |
| A | 0 | 12 | 0 |
| B | 0 | 12 | 0 |
| C | 0 | 12 | 0 |
| D | 0 | 12 | 0 |
| Quadrant | Total seconds | Saturated seconds | Saturation percentage |
|---|---|---|---|
| A | 5760 | 60 | 1.041667% |
| B | 5761 | 188 | 3.263322% |
| C | 5761 | 269 | 4.669328% |
| D | 5761 | 230 | 3.992362% |
Noise dominated data is calculated using 1-second bins in cleaned event files. If a bin has >2000 counts, and if more than 50% of those come from <1% of pixels, then it is considered to be noise-dominated and hence unusable.
| Quadrant | # 1 sec bins | Bins with >0 counts | Bins with >2000 counts | High rate bins dominated by noise | Noise dominated (total time) | Noise dominated (detector-on time) | Marked lightcurve |
|---|---|---|---|---|---|---|---|
| A | 7000 | 5760 | 0 | 0 | 0.00% | 0.00% | 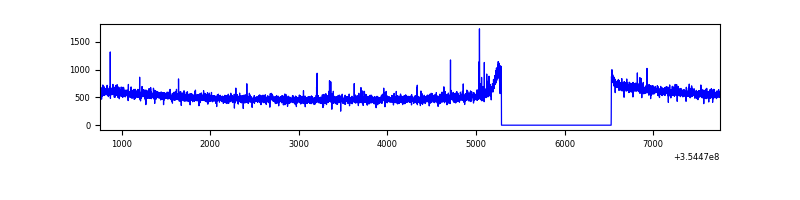 |
| B | 7001 | 5761 | 41 | 41 | 0.59% | 0.71% | 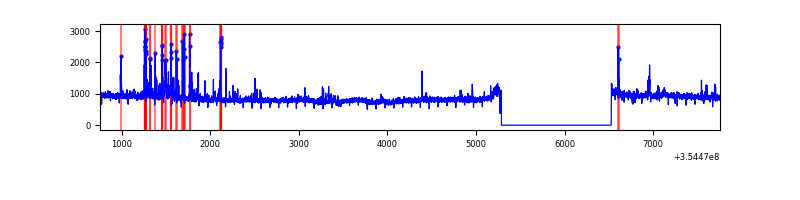 |
| C | 7001 | 5761 | 80 | 80 | 1.14% | 1.39% |  |
| D | 7001 | 5761 | 180 | 180 | 2.57% | 3.12% | 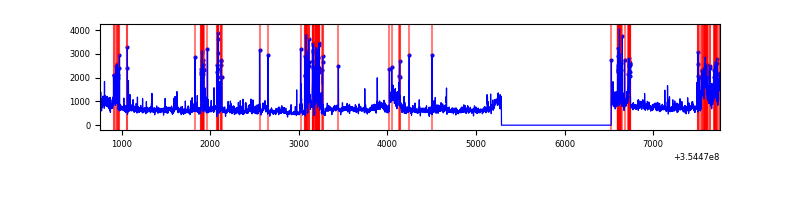 |
Top three noisy pixels from each quadrant. If the there are fewer than three noisy pixels in the level2.evt file, extra rows are filled as -1
| Pixel properties | Quadrant properties | ||||||
|---|---|---|---|---|---|---|---|
| Quadrant | DetID | PixID | Counts | Sigma | Mean | Median | Sigma |
| A | 14 | 31 | 13077 | 78.96 | 783 | 771 | 155.8 |
| A | 13 | 254 | 11432 | 68.41 | 783 | 771 | 155.8 |
| A | 3 | 137 | 7078 | 40.47 | 783 | 771 | 155.8 |
| B | 6 | 159 | 1770158 | 12212.16 | 773 | 756 | 144.9 |
| B | 5 | 255 | 202735 | 1394.03 | 773 | 756 | 144.9 |
| B | 10 | 245 | 44700 | 303.3 | 773 | 756 | 144.9 |
| C | 3 | 233 | 800127 | 4608.74 | 748 | 758 | 173.4 |
| C | 14 | 238 | 121824 | 698.0 | 748 | 758 | 173.4 |
| C | 10 | 22 | 21004 | 116.73 | 748 | 758 | 173.4 |
| D | 7 | 80 | 1129053 | 6415.11 | 747 | 731 | 175.9 |
| D | 8 | 195 | 616220 | 3499.38 | 747 | 731 | 175.9 |
| D | 2 | 250 | 39287 | 219.21 | 747 | 731 | 175.9 |
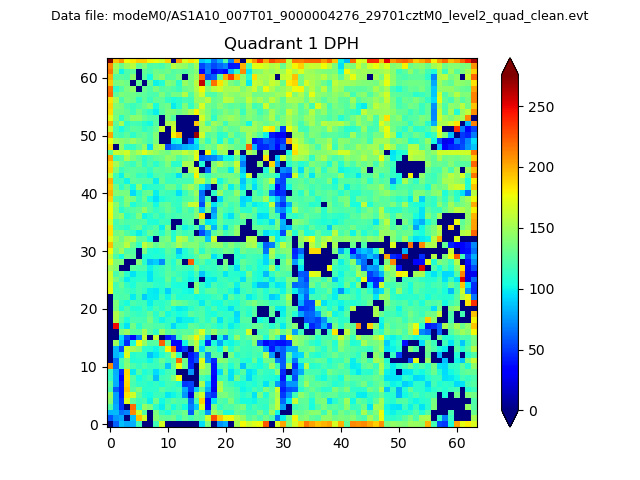
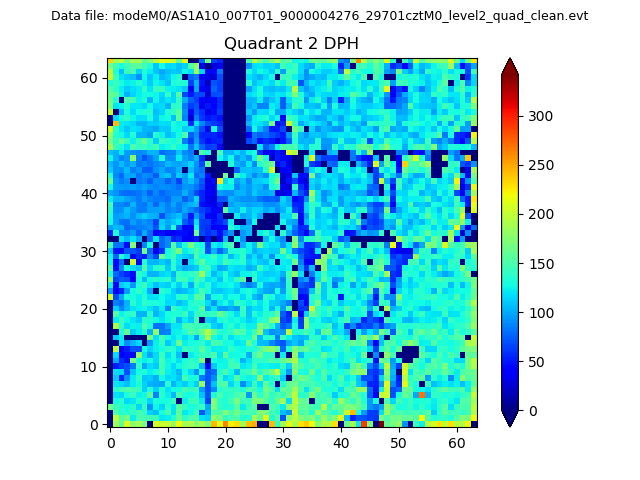
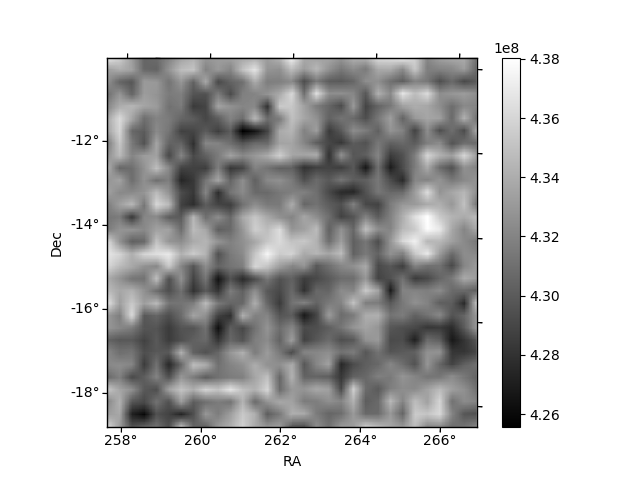
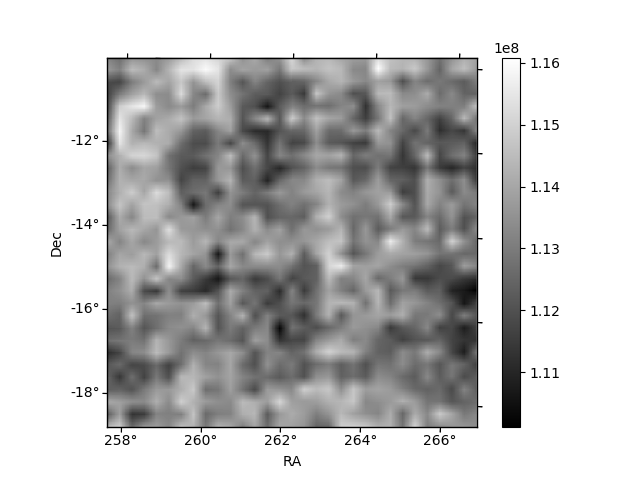
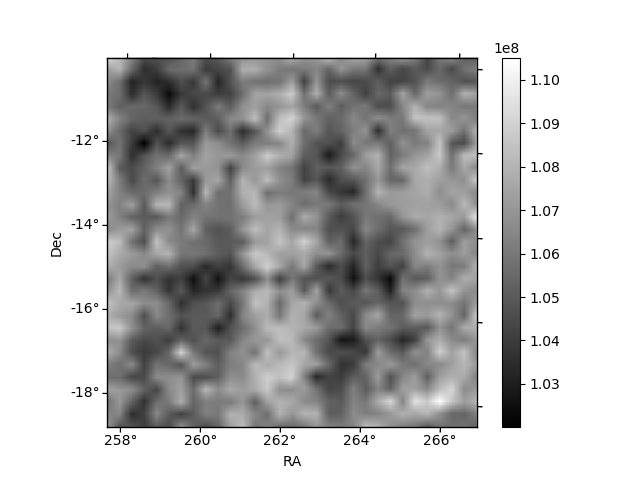
Histogram calculated using DETX and DETY for each event in the final _common_clean file
| Quadrant A | 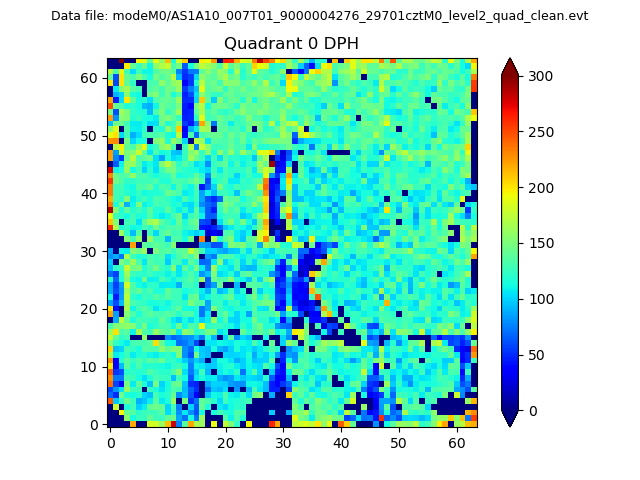 |
 |
Quadrant B |
|---|---|---|---|
| Quadrant D | 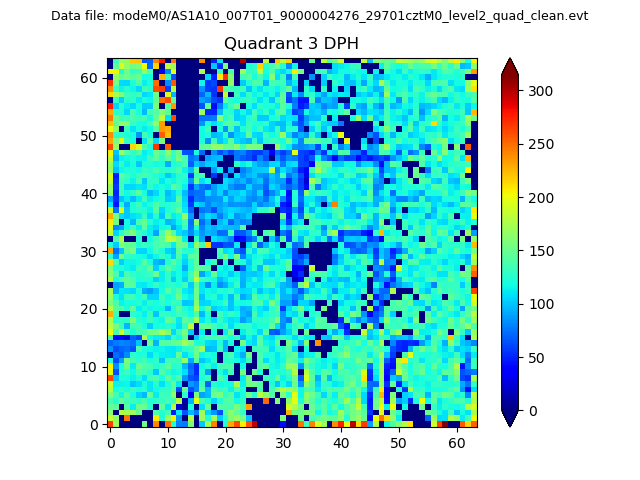 |
 |
Quadrant C |
| Plot type | Count rate plots | Images |
|---|---|---|
| Comparison with Poisson distribution Blue bars denote a histogram of data divided into 1 sec bins. Red curve is a Poisson curve with rate = median count rate of data. |
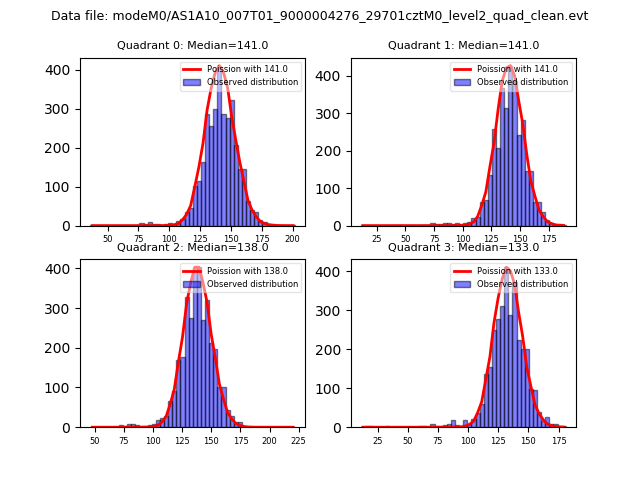 |
 |
| Quadrant-wise count rates Data is divided into 100 sec bins |
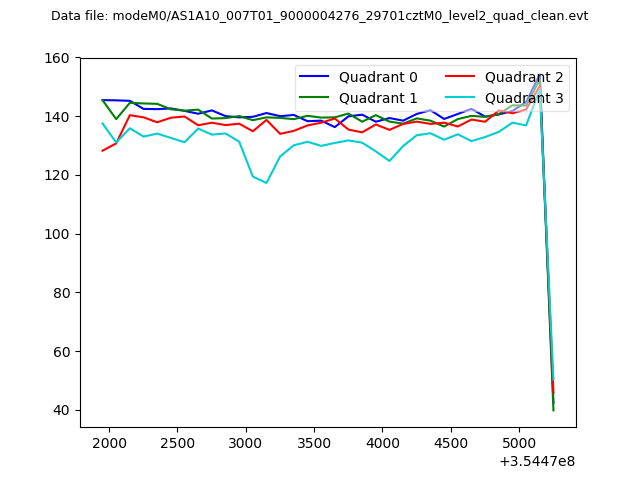 |
|
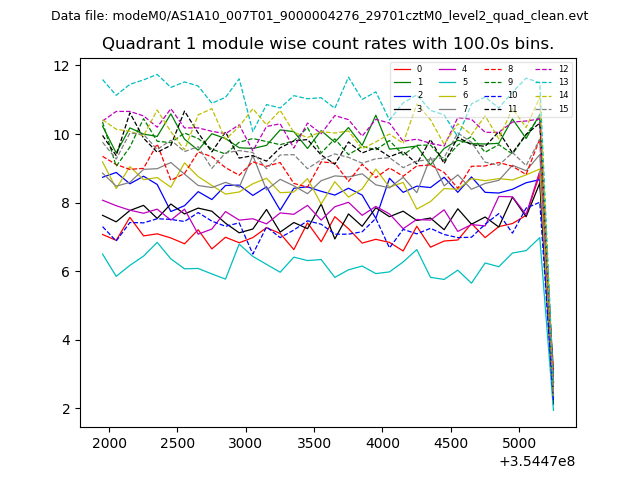
| Module-wise count rates for Quadrant A Data is divided into 100 sec bins |
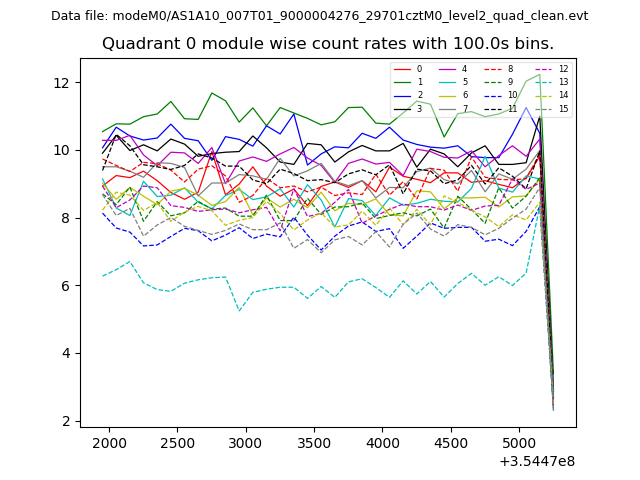 |
 |
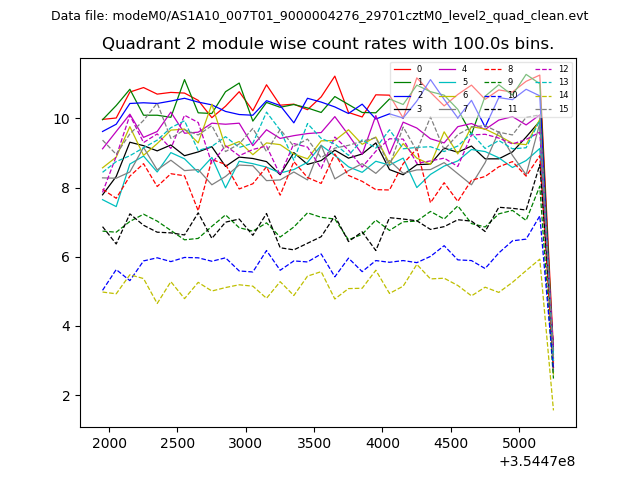
| Module-wise count rates for Quadrant B Data is divided into 100 sec bins |
 |
 |
| Module-wise count rates for Quadrant C Data is divided into 100 sec bins |
 |
 |
| Module-wise count rates for Quadrant D Data is divided into 100 sec bins |
 |
 |
| Parameter | Plot |
|---|---|
| CZT HV Monitor | 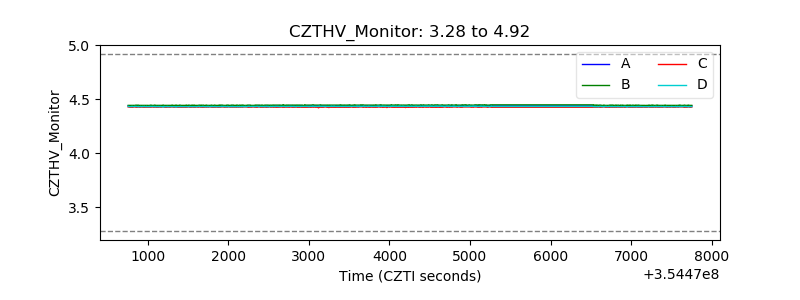 |
| D_VDD | 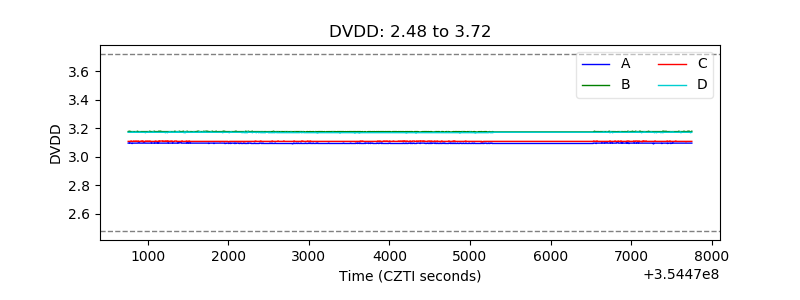 |
| Temperature 1 | 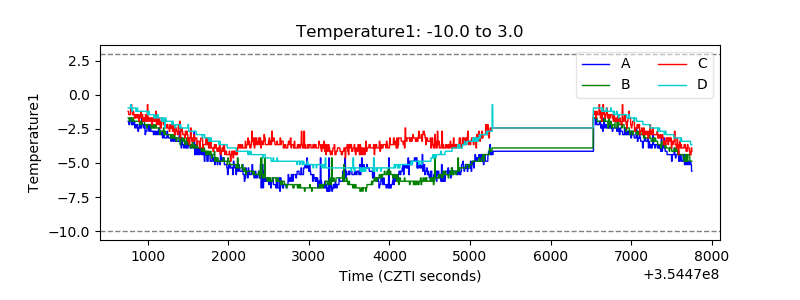 |
| Veto HV Monitor | 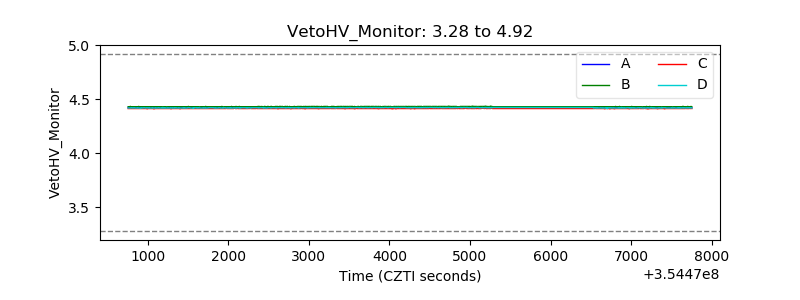 |
| Veto LLD | 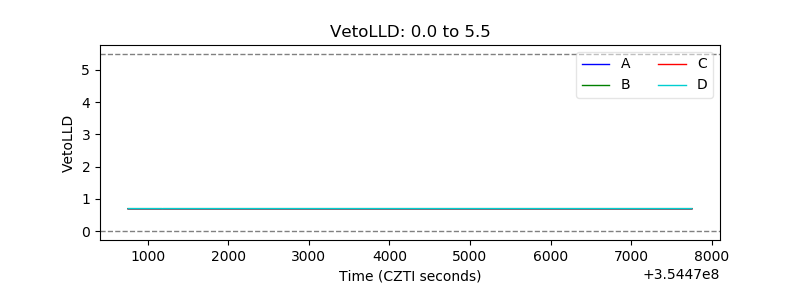 |
| Alpha Counter | 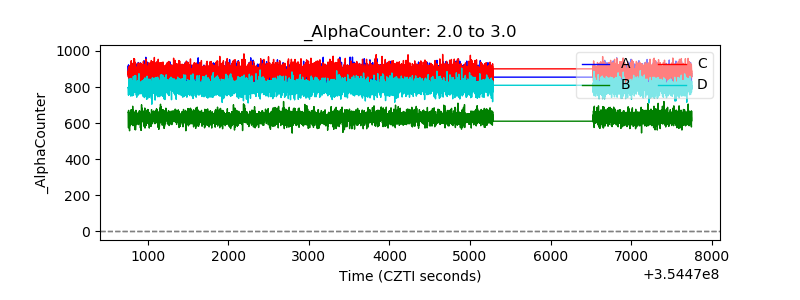 |
| _CPM_Rate | 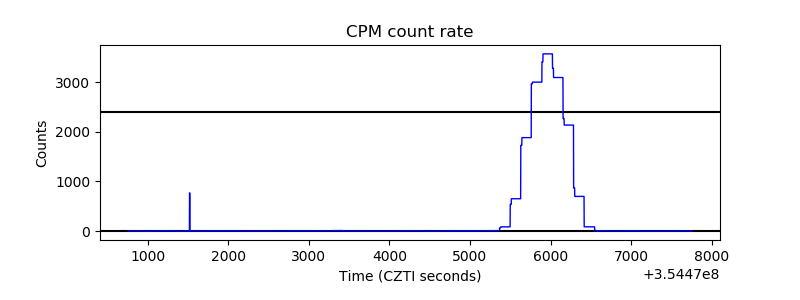 |
| CZT Counter | 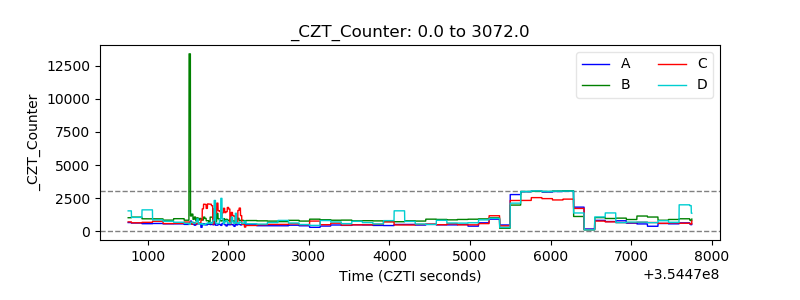 |
| +2.5 Volts monitor | 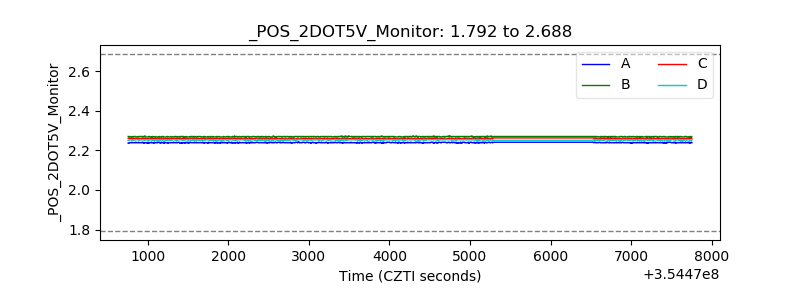 |
| +5 Volts monitor |  |
| _ROLL_ROT | 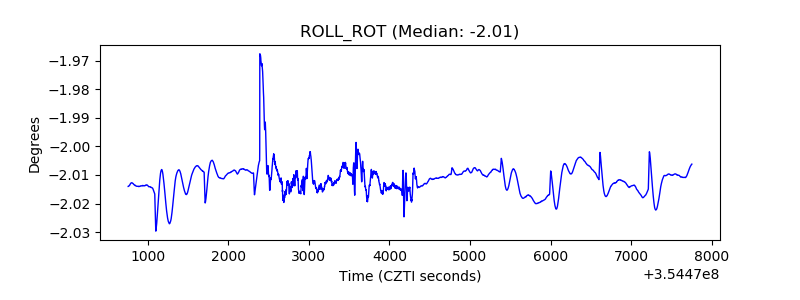 |
| _Roll_DEC | 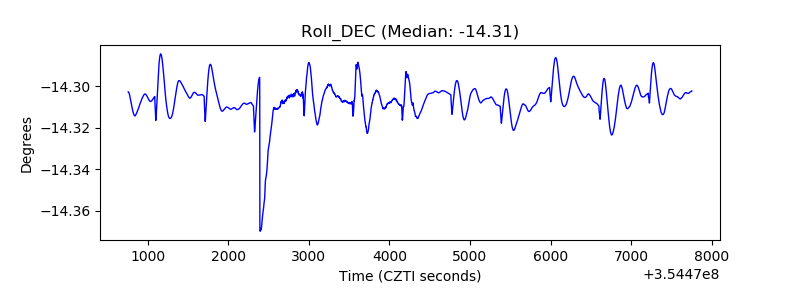 |
| _Roll_RA | 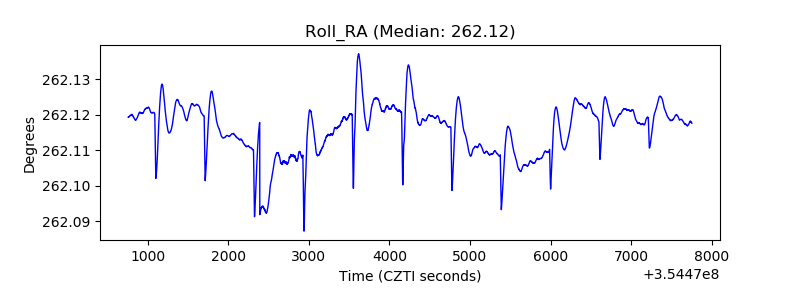 |
| Veto Counter | 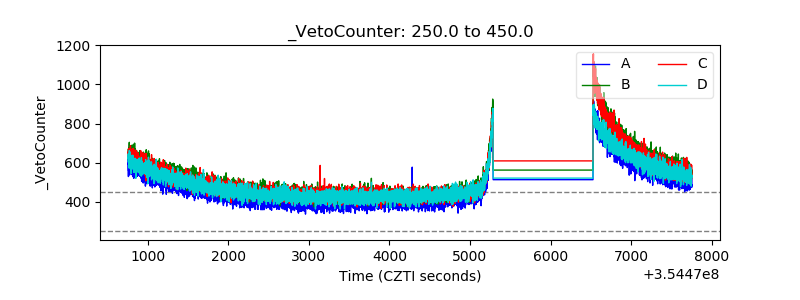 |